U.S. Geological Survey Open-File Report 2008-1206
Coastal Change Along the Shore of Northeastern South Carolina: The South Carolina Coastal Erosion Study
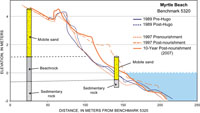
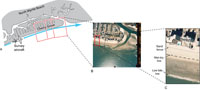
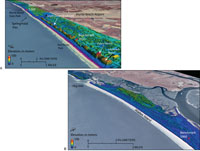
2.3 Mapping ShorelinesSandy shorelines are dynamic systems that change in response to natural processes or human modifications to the coast. Change is measured by comparing shoreline positions at different points in time from days to many years apart. The shoreline at any particular beach is established from features visible in the field or on aerial photographs (for example, wet-dry line, vegetation line), features measured from beach profiles (for example, crest of the primary dune), or elevation contours extracted from topographic surfaces (for example, mean high water). Beach Profiling Beaches in South Carolina have been monitored since 1993 by using beach profiles taken at established benchmarks along the entire coast. In its simplest form, a beach profile is constructed by a survey crew who use leveling instruments to determine the elevation of a series of points along a line. Profiles generally begin at the dune, cross the dry beach, and end in the surf zone at wading depths of less than 2 m (6.6 ft). Survey results are presented as a graph of land elevation relative to distance along the profile (Figure 2.8). Surveys along the same profile are collected at regular time intervals so that changes in the shape of the beach can be monitored on a seasonal or yearly basis. Changes in beach shape indicate erosion (loss) or accretion (gain) of sediment over that time period. Geologists at Coastal Carolina University and USGS have improved traditional beach-profiling techniques by extending cross-shore profiles beyond wading depths to water depths of about 8 m (26 ft). Different techniques are used on land and in the water. To survey the dry beach, Global Positioning System (GPS) navigation receivers are mounted on an all-terrain vehicle (ATV) or carried in backpacks on foot. Precise position and elevation data are collected at low tide while surveyors drive or walk along survey lines. To survey in deeper water, a fathometer is mounted on a small, rigid-hull inflatable boat that is precisely tracked by GPS (Figure 2.2B). At high tide, the boat drives as close as possible to the beach, thereby overlapping the area covered in land-based surveys. Data from the two surveys are then merged to form a single profile. Historical Shoreline Analysis Analysis of field surveys, historical maps, and aerial photographs reveals long-term trends in shoreline change (Shalowitz, 1964; Anders and Byrnes, 1991). A widely used source for establishing historic shoreline positions is the National Ocean Service (NOS) topographic sheet, or T-Sheet. T-sheets are usually the oldest reliable source of shoreline data, dating back to the mid-1800s, and provide a long-term record for most areas of the U.S. coast. Aerial photographs dating from the mid-1900s help to better define long-term trends in shoreline variability. Aerial photography allows rapid surveying of large sections of coast (Figure 2.9) and thereby provides snapshots of the shoreline at more frequent intervals. In recent years, use of laser-based techniques for mapping topography has revolutionized shoreline mapping. LIDAR (LIght Detection And Ranging) systems are deployed from airplanes and can rapidly survey extensive areas of the coast (Figure 2.2B). LIDAR operates by bouncing a laser beam off the ground hundreds of times per second across a wide swath beneath the airplane. The time it takes the laser beam to reach the ground surface and bounce back (or “be reflected”) to the airplane is used to calculate elevation. These systems can map hundreds of kilometers of coast in a few hours and are able to acquire elevation data every few meters (Figure 2.10). The large number of closely spaced topographic measurements is used to establish shoreline positions (Sallenger and others, 2003). Frequent surveying enables examination of shorter term trends in shoreline change, such as the effects of a single storm (Stockdon and others, 2002). Next Section: 2.4 Mapping Sediment Movement » |

 U.S. Department of the Interior |
U.S. Geological Survey
U.S. Department of the Interior |
U.S. Geological Survey
[an error occurred while processing this directive]
URL: https://pubsdata.usgs.gov
Page Contact Information: Publishing Service Center
Page Last Modified: Wednesday, 07-Dec-2016 21:39:05 EST