U.S. Geological Survey Open-File Report 2015-1153
![]() / Title Page / List of Figures / Conversion Factors / Abbreviations / Abstract / Introduction / Methods / Results / Discussion / Summary / Acknowledgments / References Cited / Appendix — Geospatial Data / Citation Page /
/ Title Page / List of Figures / Conversion Factors / Abbreviations / Abstract / Introduction / Methods / Results / Discussion / Summary / Acknowledgments / References Cited / Appendix — Geospatial Data / Citation Page /
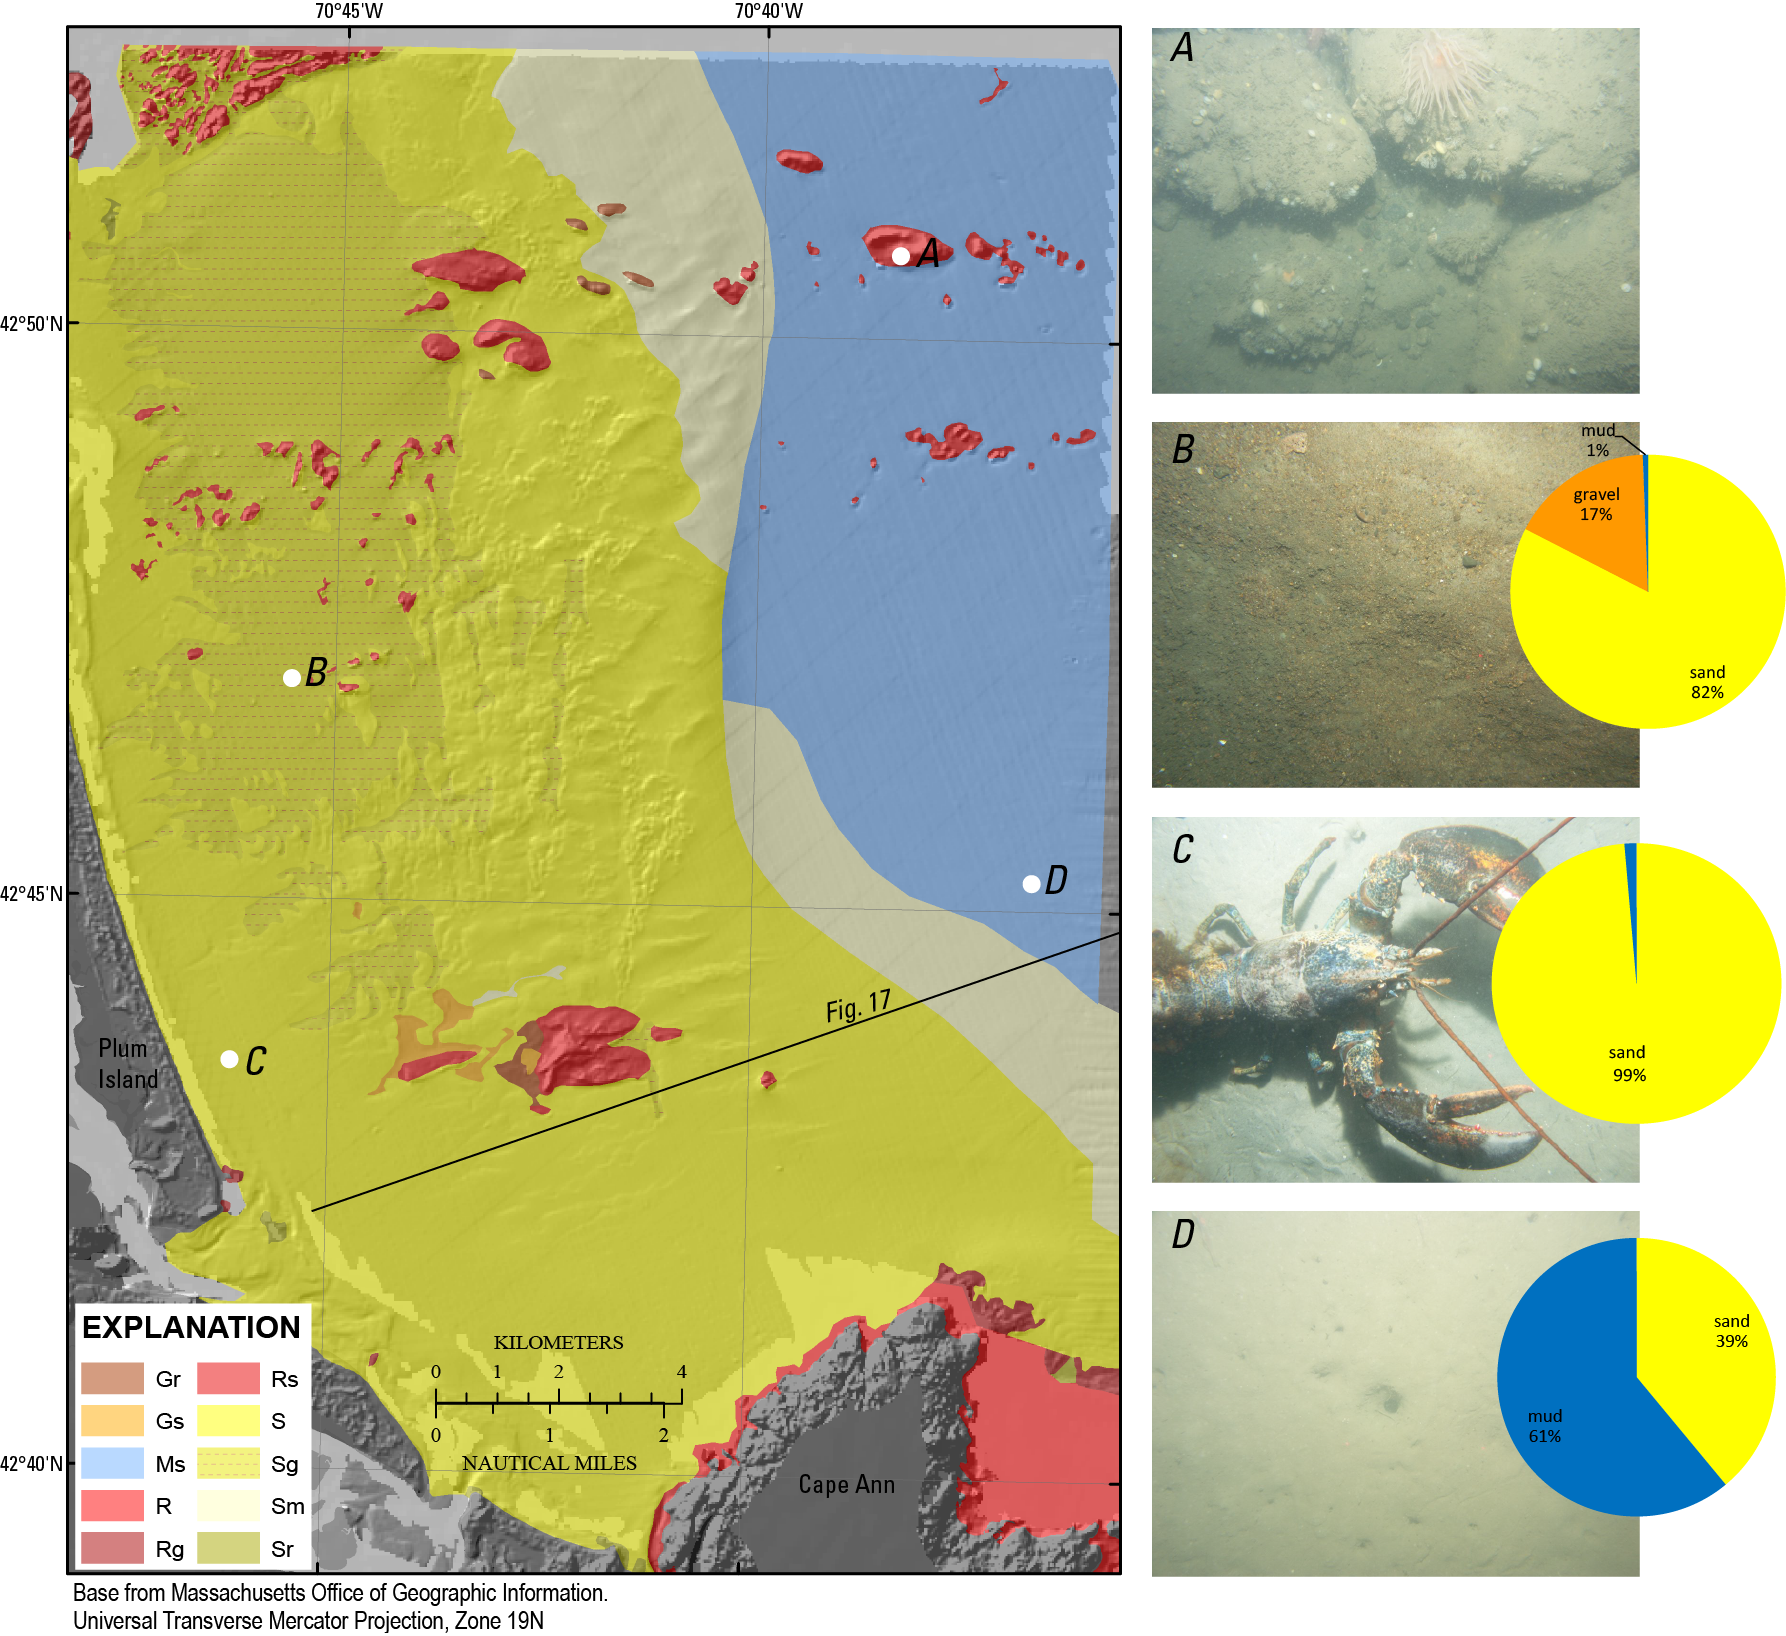
Figure 12. Inner continental shelf sediment textures between Cape Ann and New Hampshire with bottom photographs A–D showing sediment texture as defined in select locations. Grain-size statistics are plotted as pie charts showing the relative percentages of gravel, sand, and mud. A, A photograph of the sea floor within an area classified as rock and gravel (Rg). No sample was recovered in this area because of large particle size. B, A photograph of the sea floor within an area classified as primarily sand with some gravel (Sg). C, A photograph from a section of sea floor classified as primarily sand (S). D, A photograph from a section of the sea floor classified as primarily mud with some sand. The viewing frame for photographs A–D is approximately 50 centimeters, and the locations of the photographs are shown as white dots on the sediment texture map. The location of the seismic-reflection profile in figure 17 is also indicated by the black line. Sediment classes are shown in figure 8. %, percent.

![]() U.S. Department of the Interior |
U.S. Geological Survey
U.S. Department of the Interior |
U.S. Geological Survey
URL: http://pubsdata.usgs.gov/pubs/of/2015/1153/figurepages/ofr20151153_fig12.html
Page Contact Information: GS Pubs Web Contact
Page Last Modified: Wednesday, 07-Dec-2016 21:45:07 EST
