Skip past header information
USGS - science for a changing world

Open-File Report 2016–1119


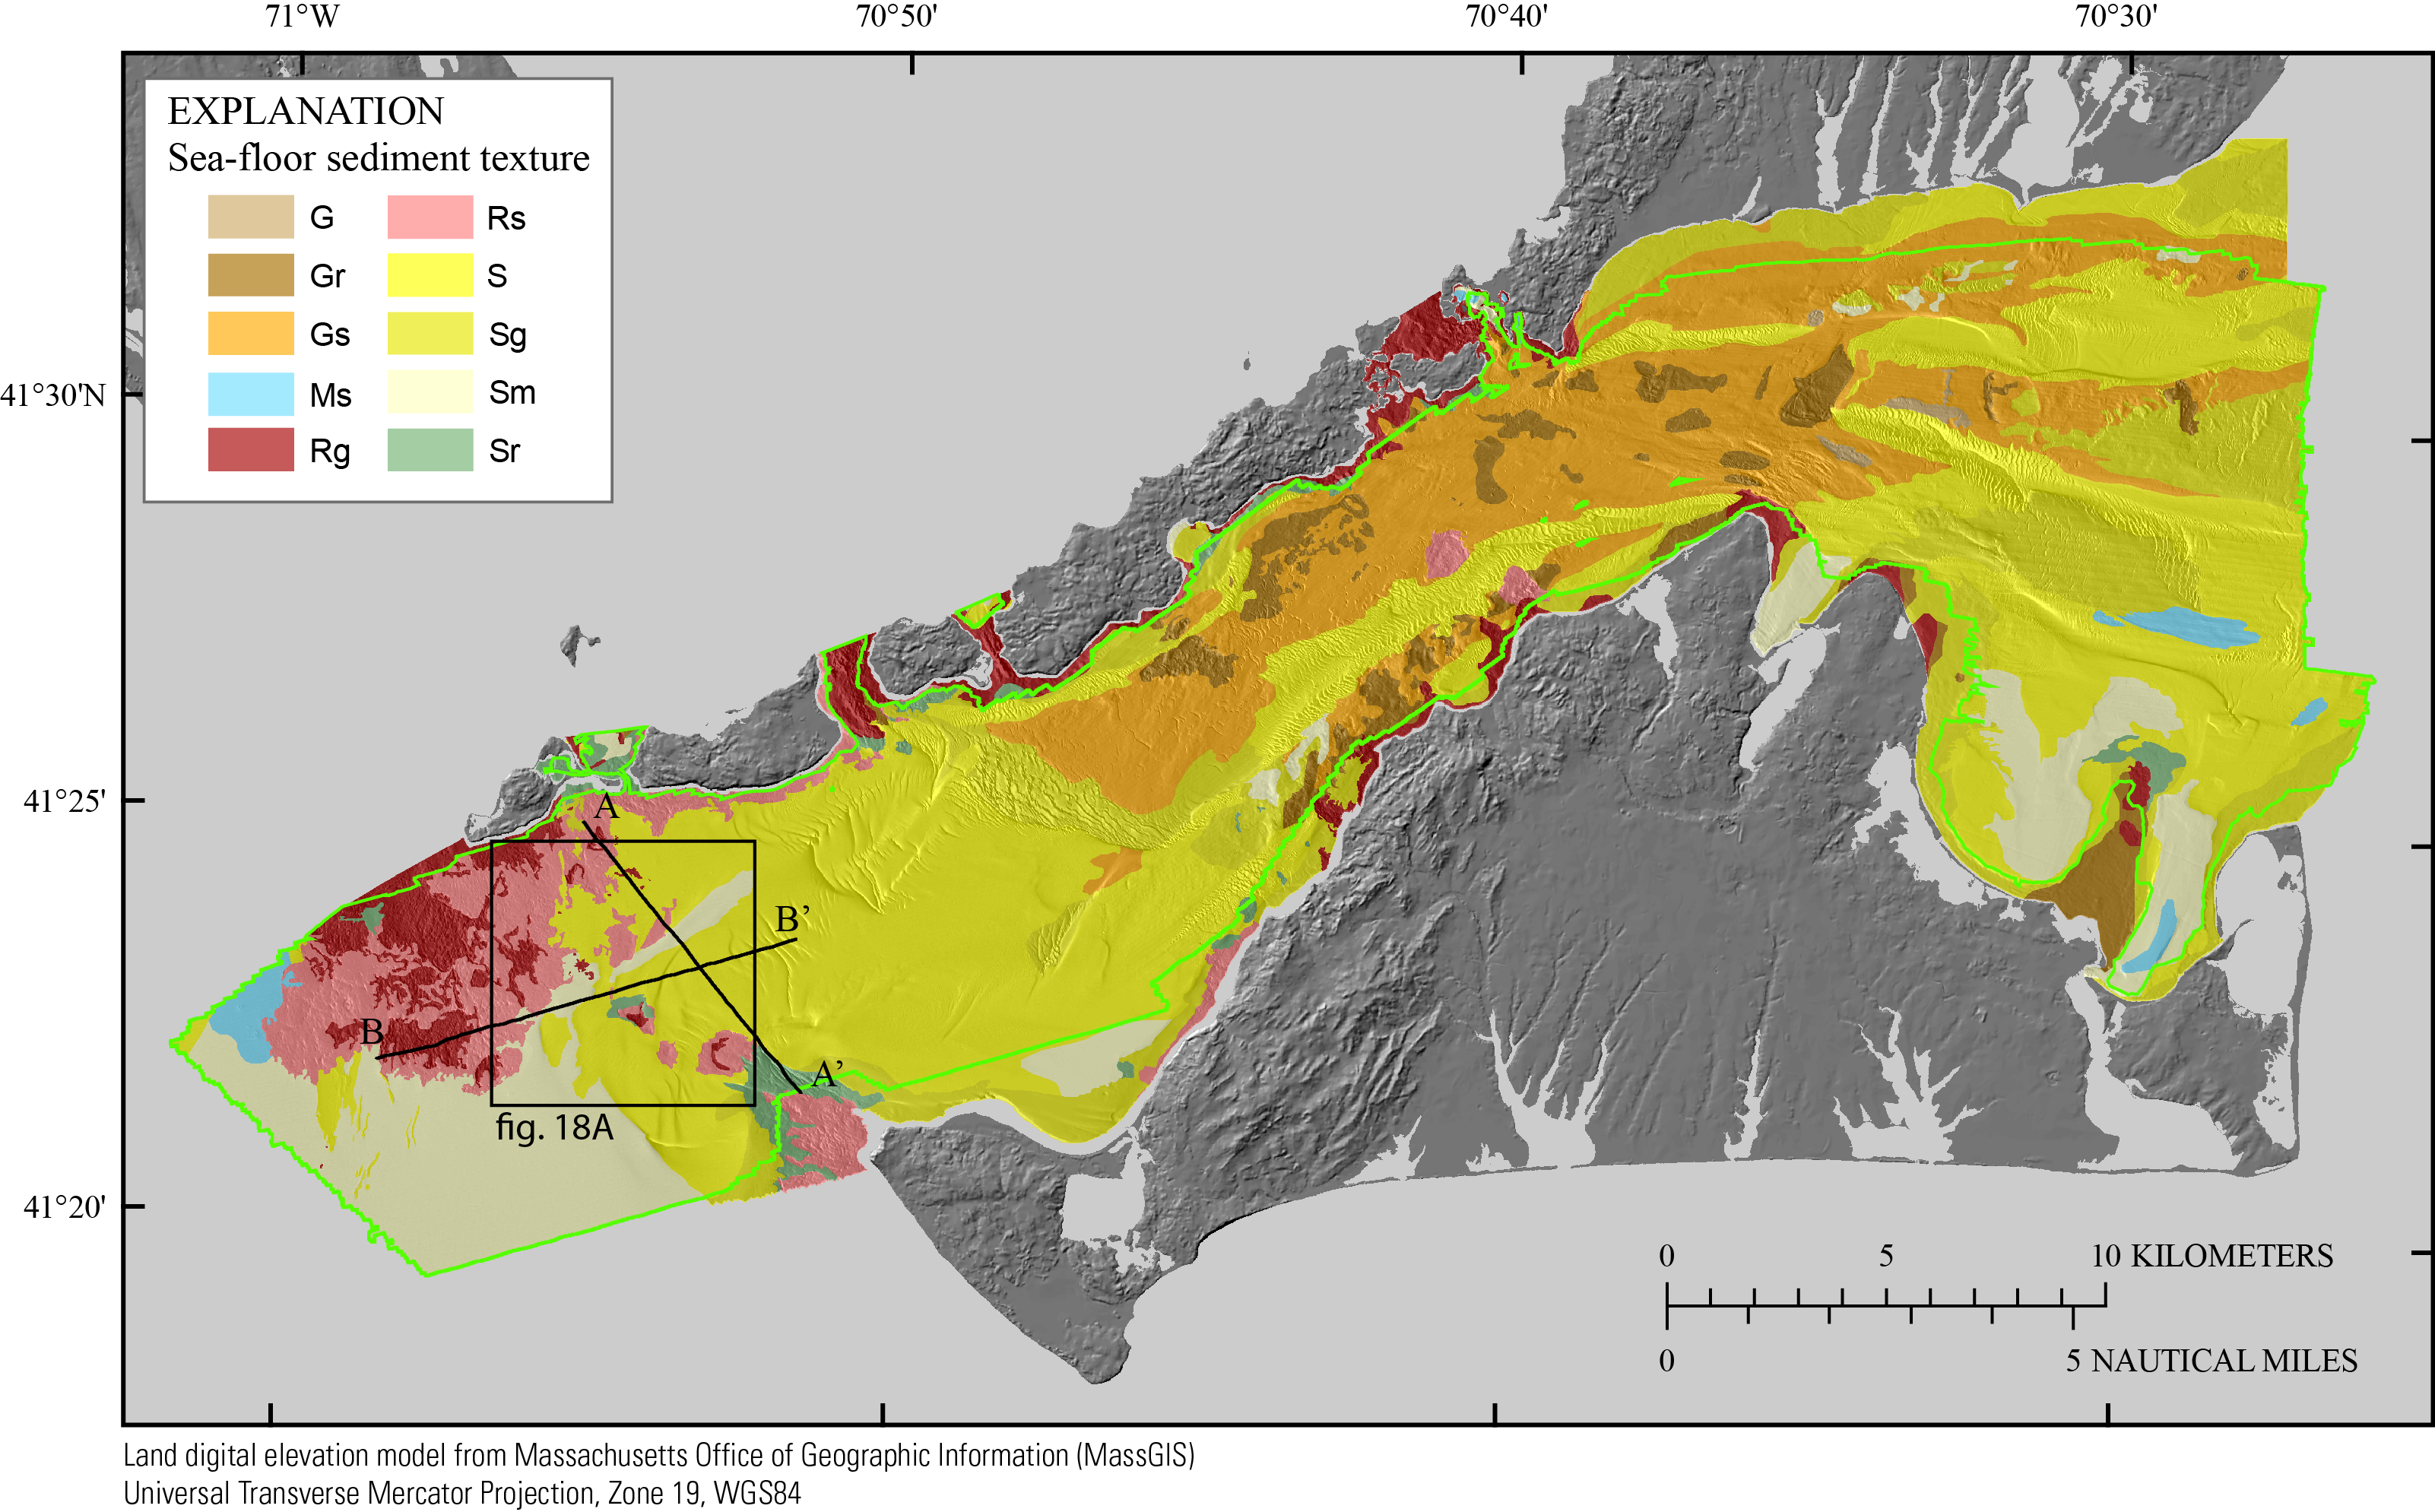
Shallow Geology, Sea-Floor Texture, and Physiographic Zones of Vineyard and Western Nantucket Sounds, Massachusetts 


Skip past contents information/ Title Page / List of Figures / Conversion Factors / Abbreviations / Abstract / Introduction / Methods / Results / Discussion / Summary / Acknowledgments / References Cited / Appendix 1 — Geospatial Data / Citation Page /


Map showing the distribution of sediment textures within Vineyard and western Nantucket sounds on the basis of the bottom-type classification from Barnhardt and others (1998) (fig. 7).


Figure 17. Map showing the distribution of sediment textures within Vineyard and western Nantucket Sounds on the basis of the bottom-type classification from Barnhardt and others (1998) (fig. 7). The green polygon is indicative of general confidence level of the interpretations, with high-confidence interpretations inside, and low-confidence interpretations outside. The black rectangle shows the extent of figure 18, and black lines show the locations of seismic profiles A-A' and B-B' from figures 10 and 11, respectively. The bathymetry hillshade relief map underlying the sediment texture layer is derived from the composite bathymetry in figure 3.

Accessibility FOIA Privacy Policies and Notices

Take Pride in America logo USA.gov logo U.S. Department of the Interior | U.S. Geological Survey
URL: http://pubsdata.usgs.gov/pubs/of/2016/1119/ofr20161119_figure17.html
Page Contact Information: GS Pubs Web Contact
Page Last Modified: Wednesday, 11-Oct-2017 17:56:27 EDT