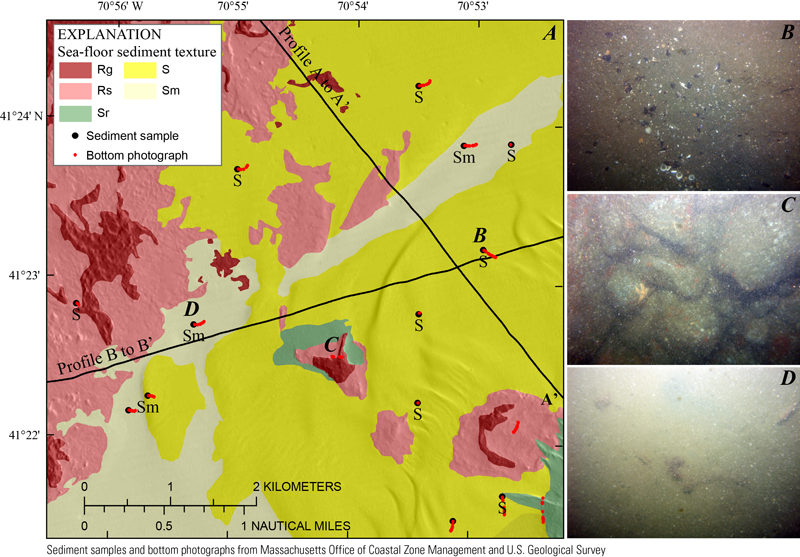
Figure 18. A, Map showing sediment textures within an approximately 6-square-kilometer area of western Vineyard Sound, between Aquinnah on Martha’s Vineyard and Cuttyhunk Island (see fig. 17 for location; see fig. 7 for bottom-type classification). The locations of seismic profiles A–A' (fig. 10) and B–B' (fig. 11) are indicated by black lines. The bathymetric hillshade relief map underlying the sediment texture layer is derived from the composite bathymetry in figure. 3. B, A photograph of sandy sediment obtained from a section of sea floor classified as primarily Sand (S). C, a photograph of the sea floor showing boulders within an area classified as primarily rock with gravel (Rg). D, A photograph from a section of sea floor classified as primarily sand with some mud (Sm). The scales of photographs B-D are approximately 60, 100, and 65 centimeters, respectively.
|
