Open-File Report 2018-1010
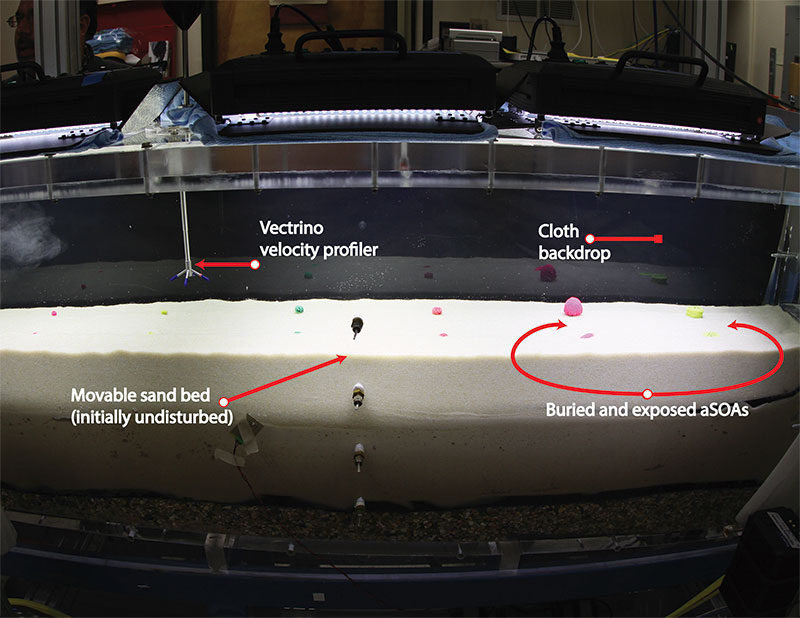
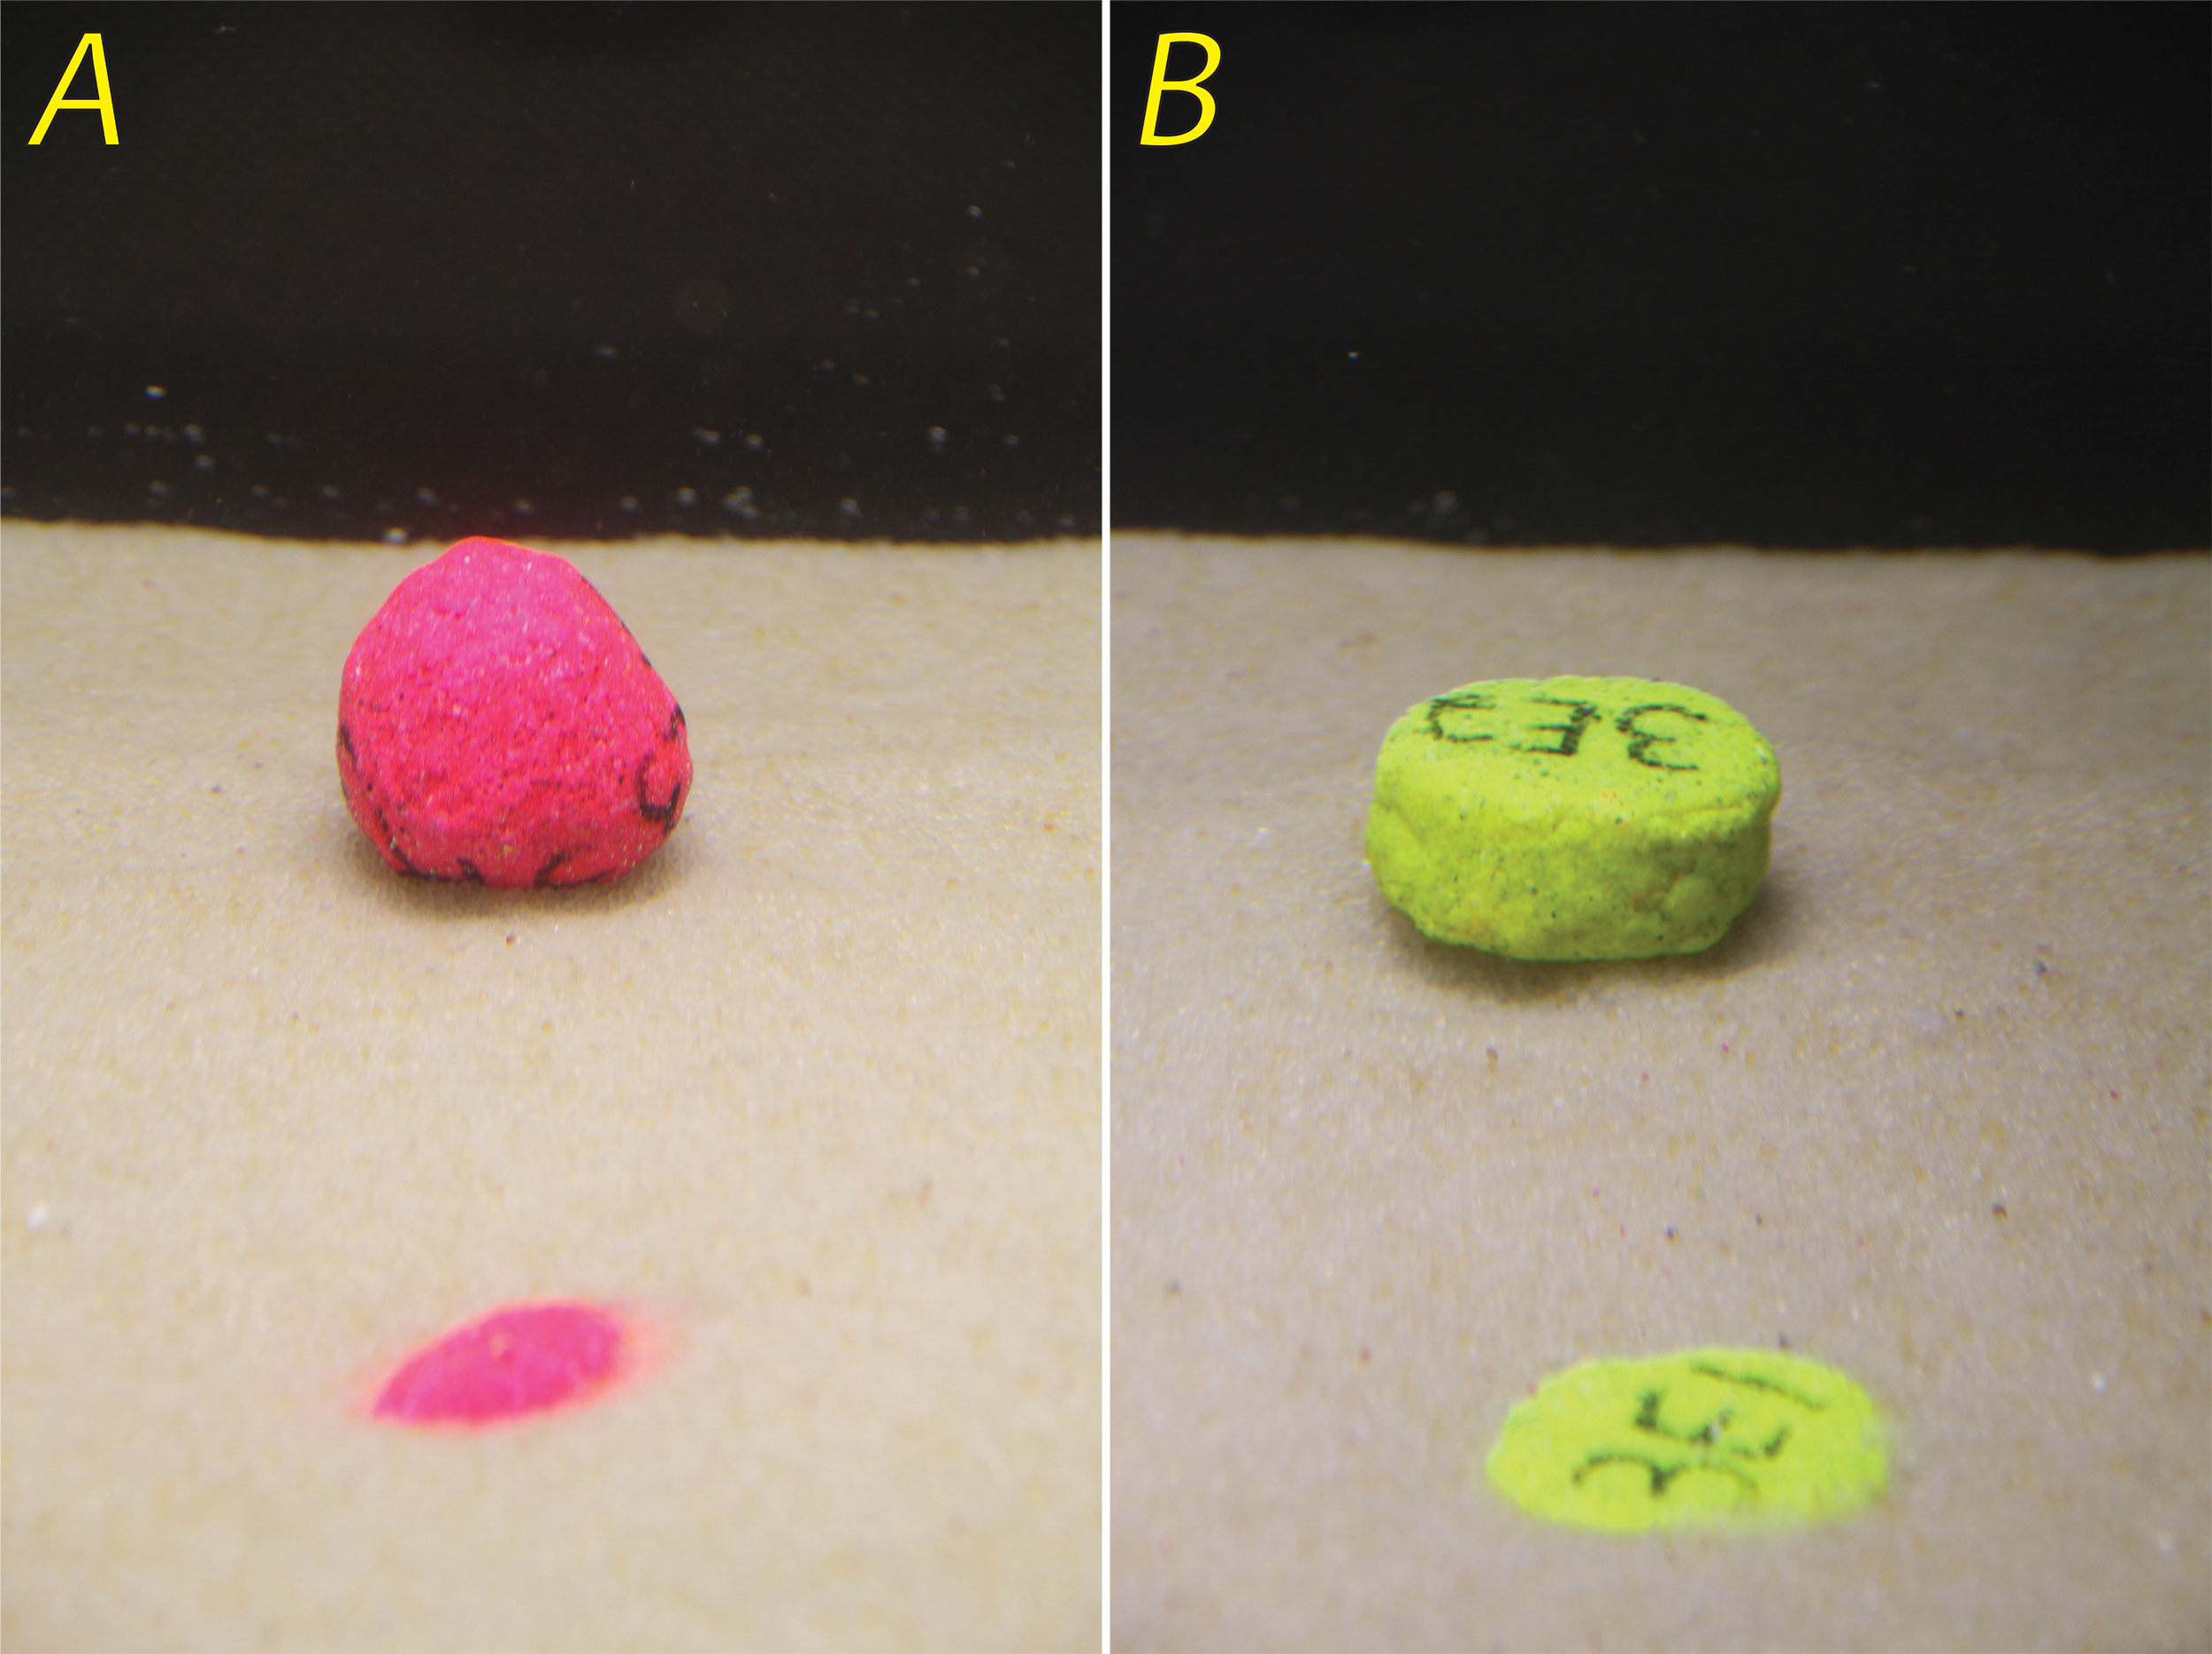
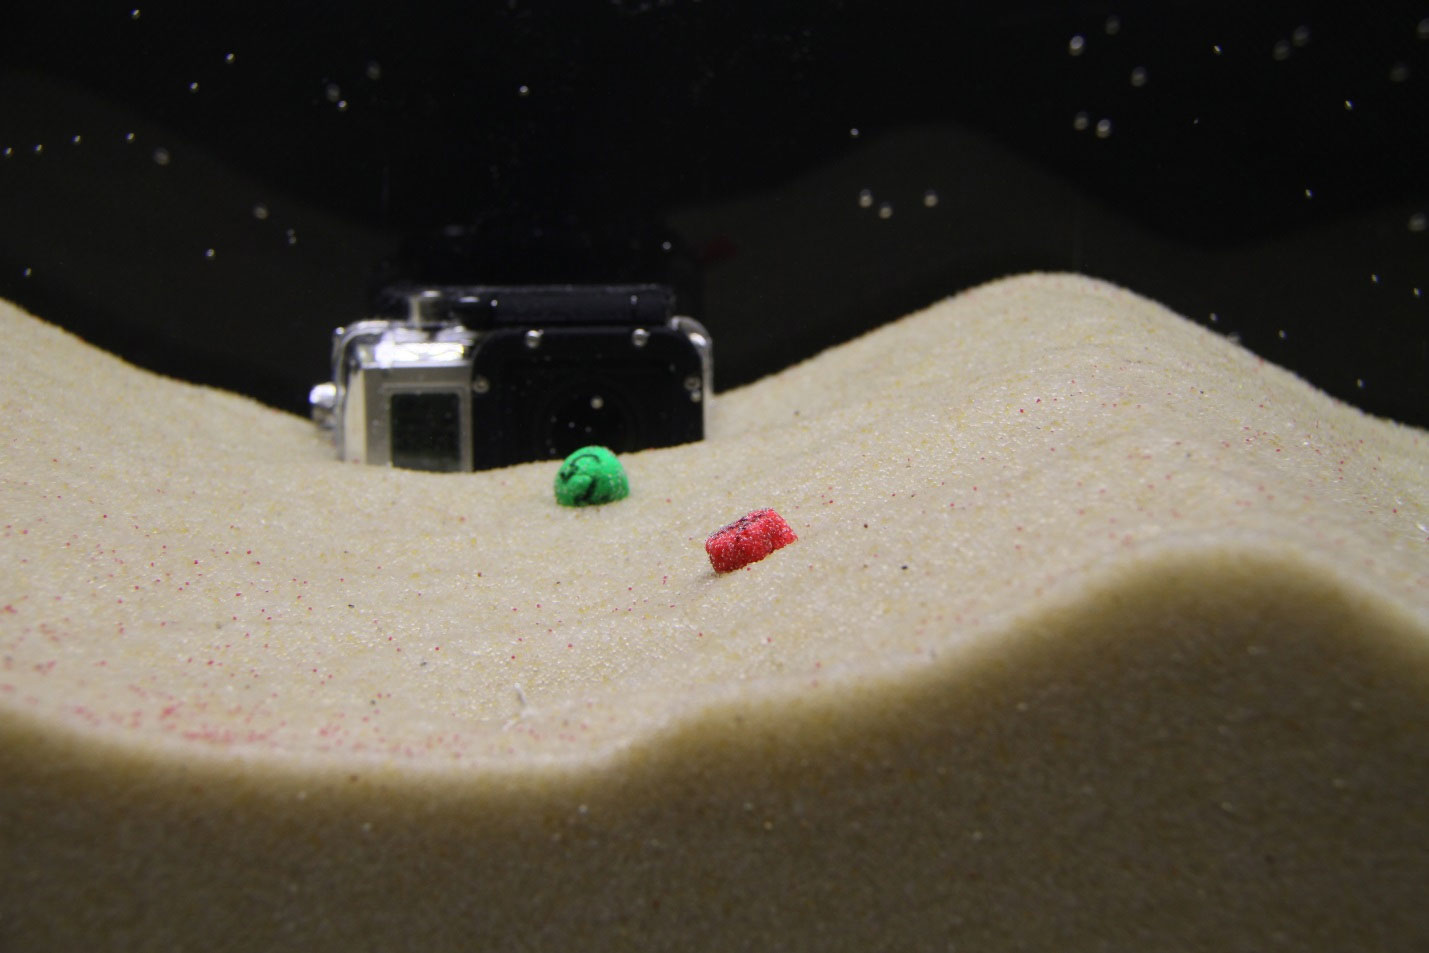
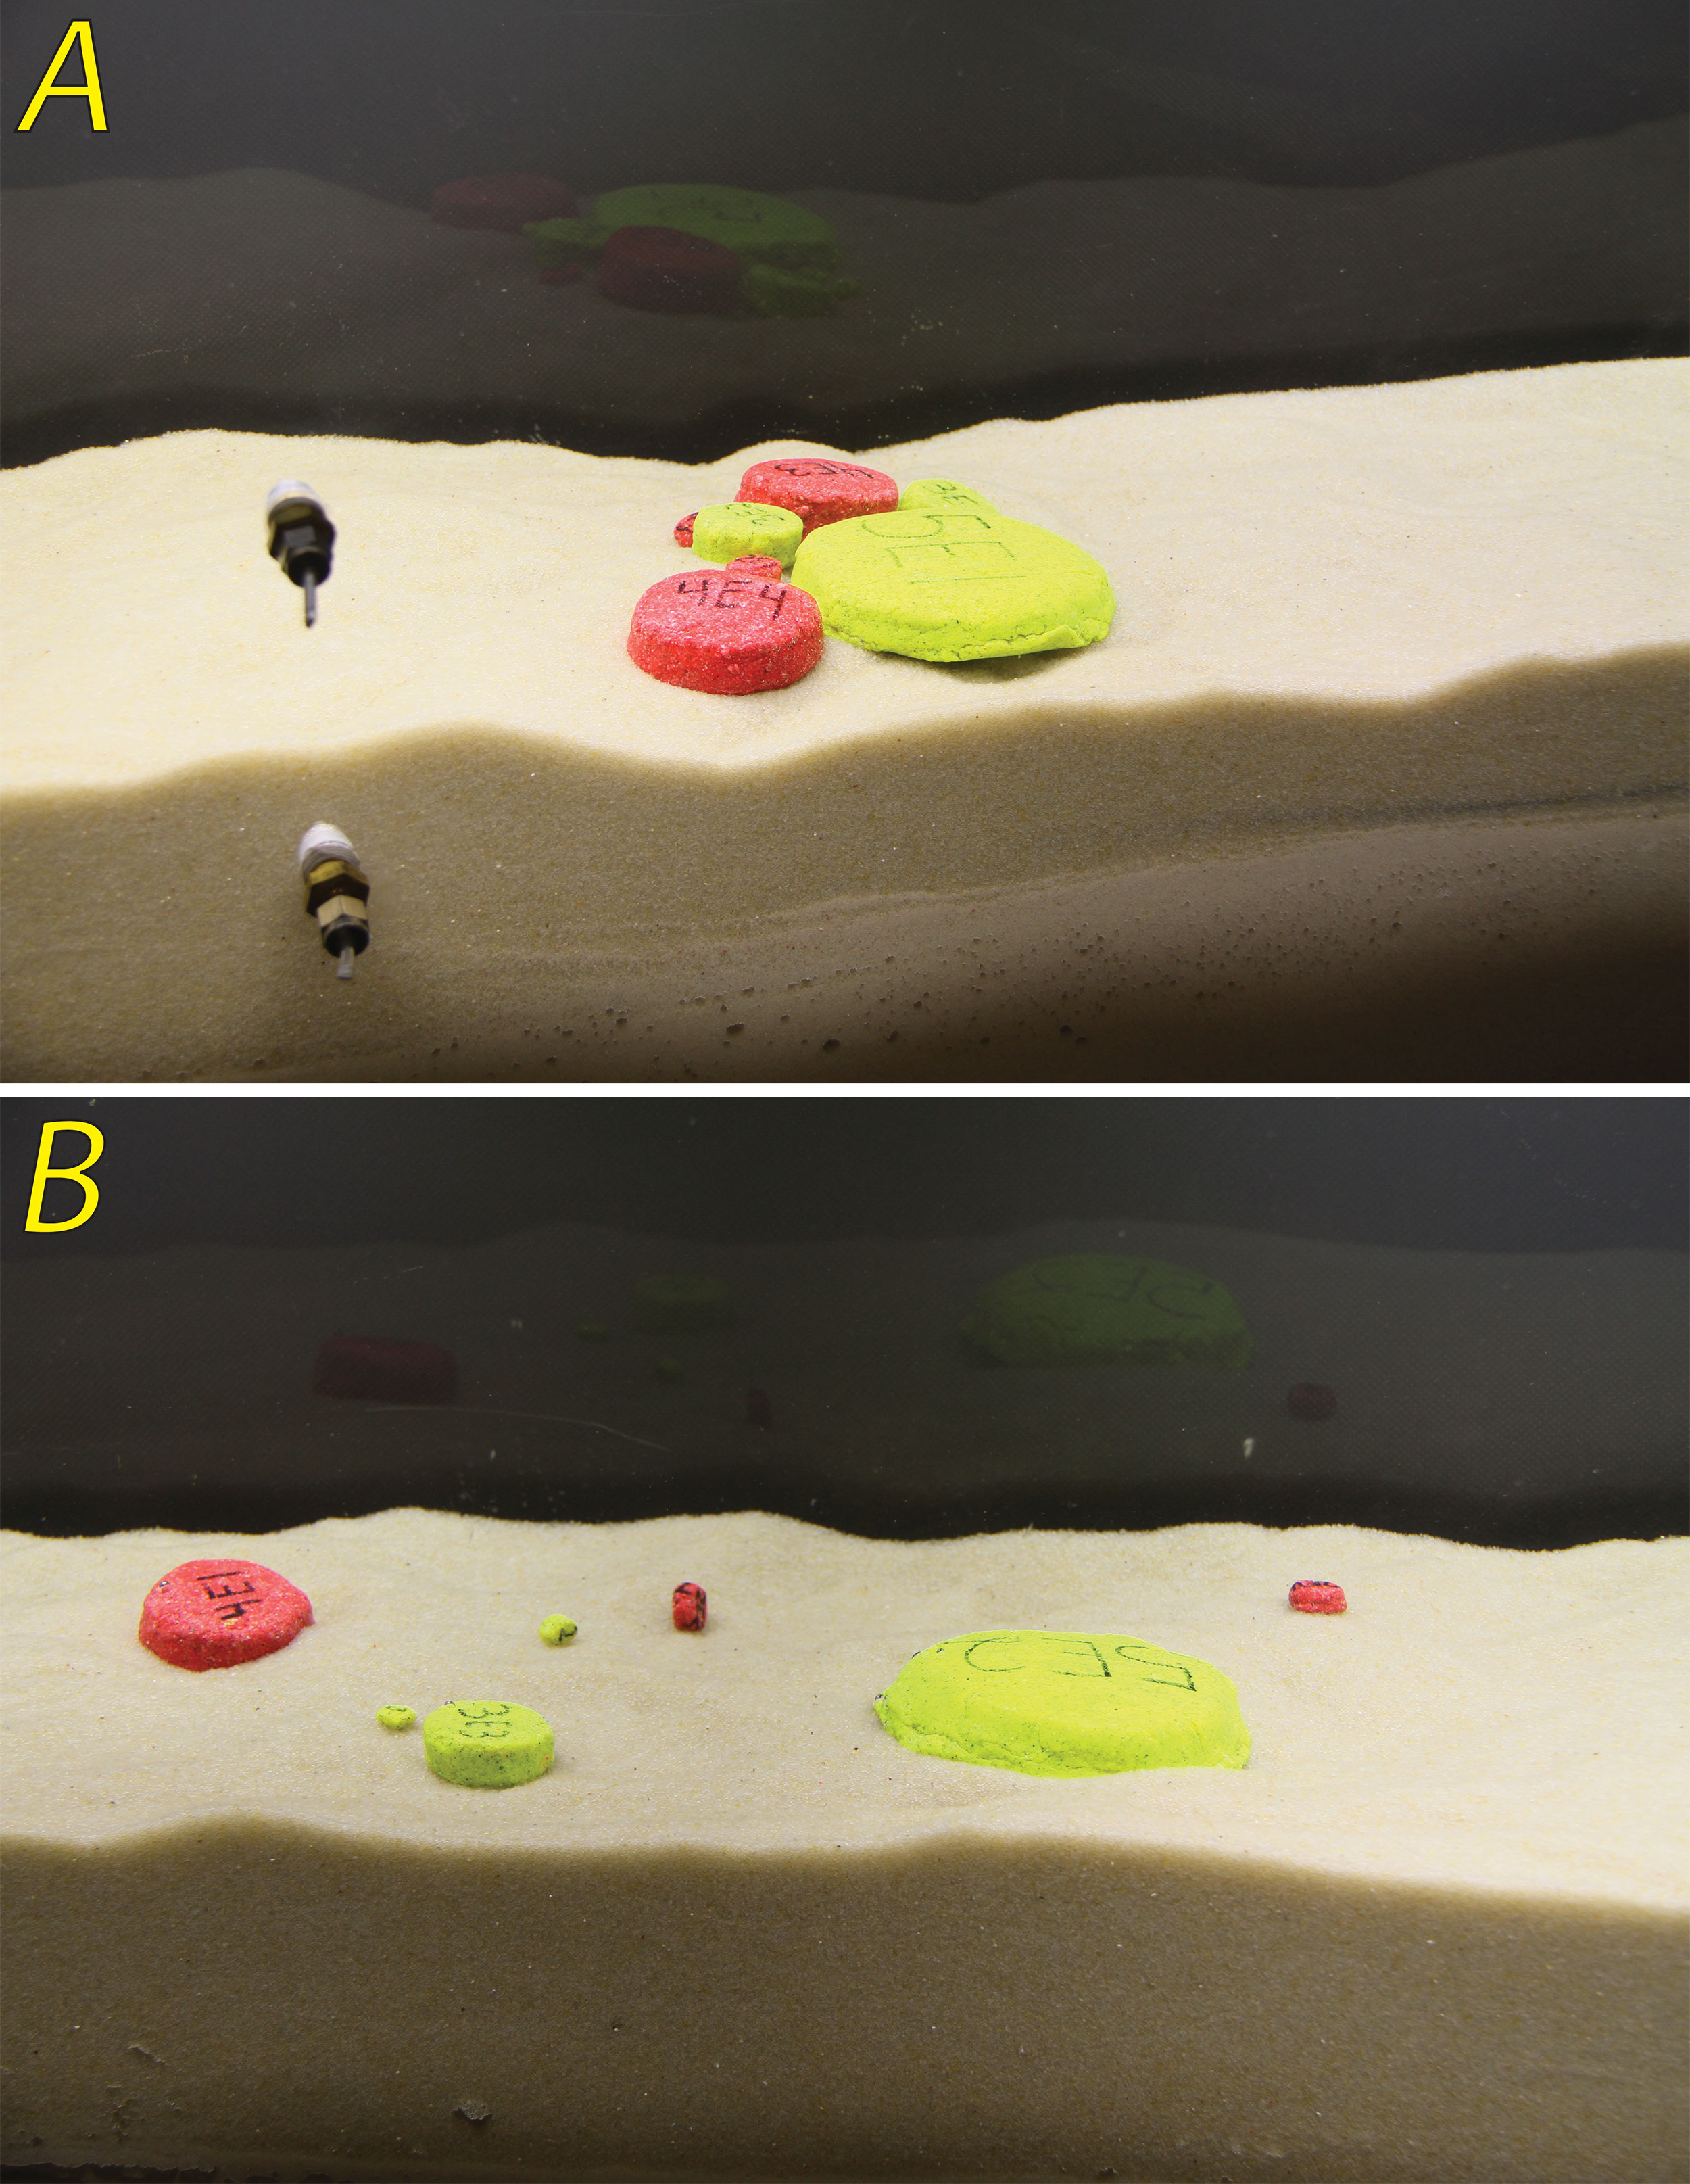
Experimental SetupThe experiments were carried out in March 2014, in the Sediment Dynamics Laboratory at the Naval Research Laboratory, Stennis Space Center, Mississippi. Artificial sand and oil agglomerates were deployed in the small-oscillatory flow tunnel (S-OFT) with a cross-sectional area of 25 cm-x-25 cm, a test-bed length of 2 meters (m), and a 35-cm-deep sediment well. Oscillating currents (simulating bottom velocities generated by waves) were driven in the tank by a flywheel with variable frequencies (20–90 rpm) and stroke lengths (22, 33, or 44 cm). For all aSOA experiments, the oscillatory current had a slight asymmetry resulting in preferential transport downstream (toward the sediment trap) in the tank. Two high-definition (HD) Digital-SLR cameras were mounted outside of the tank to record aSOA movement, each with a unique, separate field of view (fig. 1). Camera A was outfitted with an 18–55-millimeter (mm) zoom lens at a 29-mm focal length. Camera B was outfitted with an 18-mm fisheye lens. The tank was also outfitted with a Vectrino acoustic velocity profiler, mounted centrally (fig. 1). Additional information on the characteristics and design of the flow tunnel can be found in Calantoni and others (2013).  Figure 1. Photograph of an instrumented oscillatory flow tunnel outfitted with rough-surfaced false floor. [Click figure to enlarge] Incipient Motion Experiments (Fixed Floor)For the incipient motion tests, aSOAs were placed on a false floor consisting of a solid bottom plate covered in sand-paper surface (fig. 1). The onset of incipient motion was precisely measured with a Bed LAser Surface Tracking (BLAST) System (Penko and others, Naval Research Laboratory, written commun., 2016). Two 520-nanometer (nm), 75-degree fan-beam continuous wave lasers were mounted above the tank (fig. 1) that projected a 3-mm-wide and 1-m-long laser line along the tank floor in the flow direction. The aSOAs were placed such that they intersected the laser lines and were in the field of view of the two Canon 7D DSLR cameras, which captured HD video (1,080 pixels) at 29.97 frames per second (fps) (fig. 2). The time of incipient motion was calculated with a change-detection algorithm using the extracted frames for the HD video.  Figure 2. Photograph of a planar laser and an artificial sand and oil agglomerate (aSOA) placement in incipient motion experiments. [Click figure to enlarge] The properties of the aSOAs used in the laboratory experiments are outlined in table 1 and the sequence of incipient motion experiments are listed on the Data Catalog page. The creation of the aSOAs can be found in Dalyander and others (2015). The aSOAs were placed in the tank with the water at rest and spaced depending on their diameter in order to avoid adjacent aSOA interaction through wake effects. The frequency of the flywheel revolution was then increased from 20 rpm to 90 rpm, keeping the stroke length constant, as data were collected for aSOA motion and water velocity. This sequence was repeated for each size class of aSOA. The BLAST system recorded HD video of the laser projection on the aSOAs in a darkened laboratory and additional video data were taken under illuminated conditions for qualitative visual observation of motion dynamics. Vectrino 3D water-velocity data, laser-line position data, and video are available as a USGS data release (Jenkins and others, 2017) and are linked to the Data Catalog page for the set of false-floor experiments. The steps used to process the raw data are available on the Data Processing page. Sea-Floor Interaction Experiments (Movable Sand Bed)In the sea-floor interaction experiments, the rough false floor was removed and replaced with coarse grain sand. The aSOAs were placed on the surface of the sand bed that then evolved under the varying flow conditions, in order to study how the aSOA-sand interactions affected the aSOA motion. The tank was illuminated with light-emitting diode (LED) light stands and fitted with a black backdrop to highlight aSOA and bed motion (fig. 3). The BLAST system was used to take initial and periodic scans of aSOA location and bed-ripple geometry for each experiment, and the DSLR cameras captured high-resolution images of aSOA dynamics and bed interaction. (There is some overlap in the fields of view of the two cameras.) Four experiments (denoted as A–D) were conducted using a variety of aSOAs from different size and shape classes. In experiment A, aSOAs with diameters that ranged from 0.5 cm to 2.5 cm were placed atop an initially flat sand bed with the water at rest. In order to investigate the influence of the initial position of the aSOAs relative to the sea floor (for example, partially buried versus sitting proud on top), some aSOAs were initially placed on top of the bed, while others were buried so that just the upper surface was exposed (fig. 4). Subsequent experiments included different combinations of 0.5–10 cm of aSOAs placed on or in a rippled sand bed. During one experiment, a GoPro camera was deployed within the tank to provide a unique perspective of aSOA and ripple dynamics (fig. 5). A final experiment was also run with tightly (fig. 6A) and loosely (fig. 6B) arranged groups of aSOAs to simulate SOAs before and after they break off from the initially formed mats, respectively. The sequence of experiments is given on the Data Catalog page. Video and velocity data are available as a USGS data release (Jenkins and others, 2017) and are linked on the Data Catalog page.
|

![]() U.S. Department of the Interior |
U.S. Geological Survey
U.S. Department of the Interior |
U.S. Geological Survey
URL: http://pubsdata.usgs.gov/pubs/of/2018/1010/ofr20181010_experiments.html
Page Contact Information: GS Pubs Web Contact
Page Last Modified: Thursday, 26-Apr-2018 11:25:25 EDT