Open-File Report 2018-1010
ResultsIncipient Motion Experiments (Fixed Floor)For aSOAs with diameters ranging from 0.5 to 1 cm, the observed incipient motion was consistent with threshold values predicted by shear-stress based formulations (table 2; fig. 8). The calculated stress values at incipient motion ranged between the highest estimates of critical stress considered (corresponding to an unmodified Shields parameter originally developed for grains in a uniform-grain-size bed) and the lowest estimate of critical stress threshold (developed for larger particles in a mixed-grain bed). For larger round aSOAs (diameters ≥2.5 cm), incipient motion occurred under stresses lower than the lowest theoretical critical stresses, which may indicate the influence of a pressure gradient forcing on larger aSOAs. In contrast, larger ellipsoidal aSOAs (diameters ≥2.5 cm) began to move at greater shear-stress values, occasionally greater than the highest theoretical critical values, most likely due to their decreased profile height. 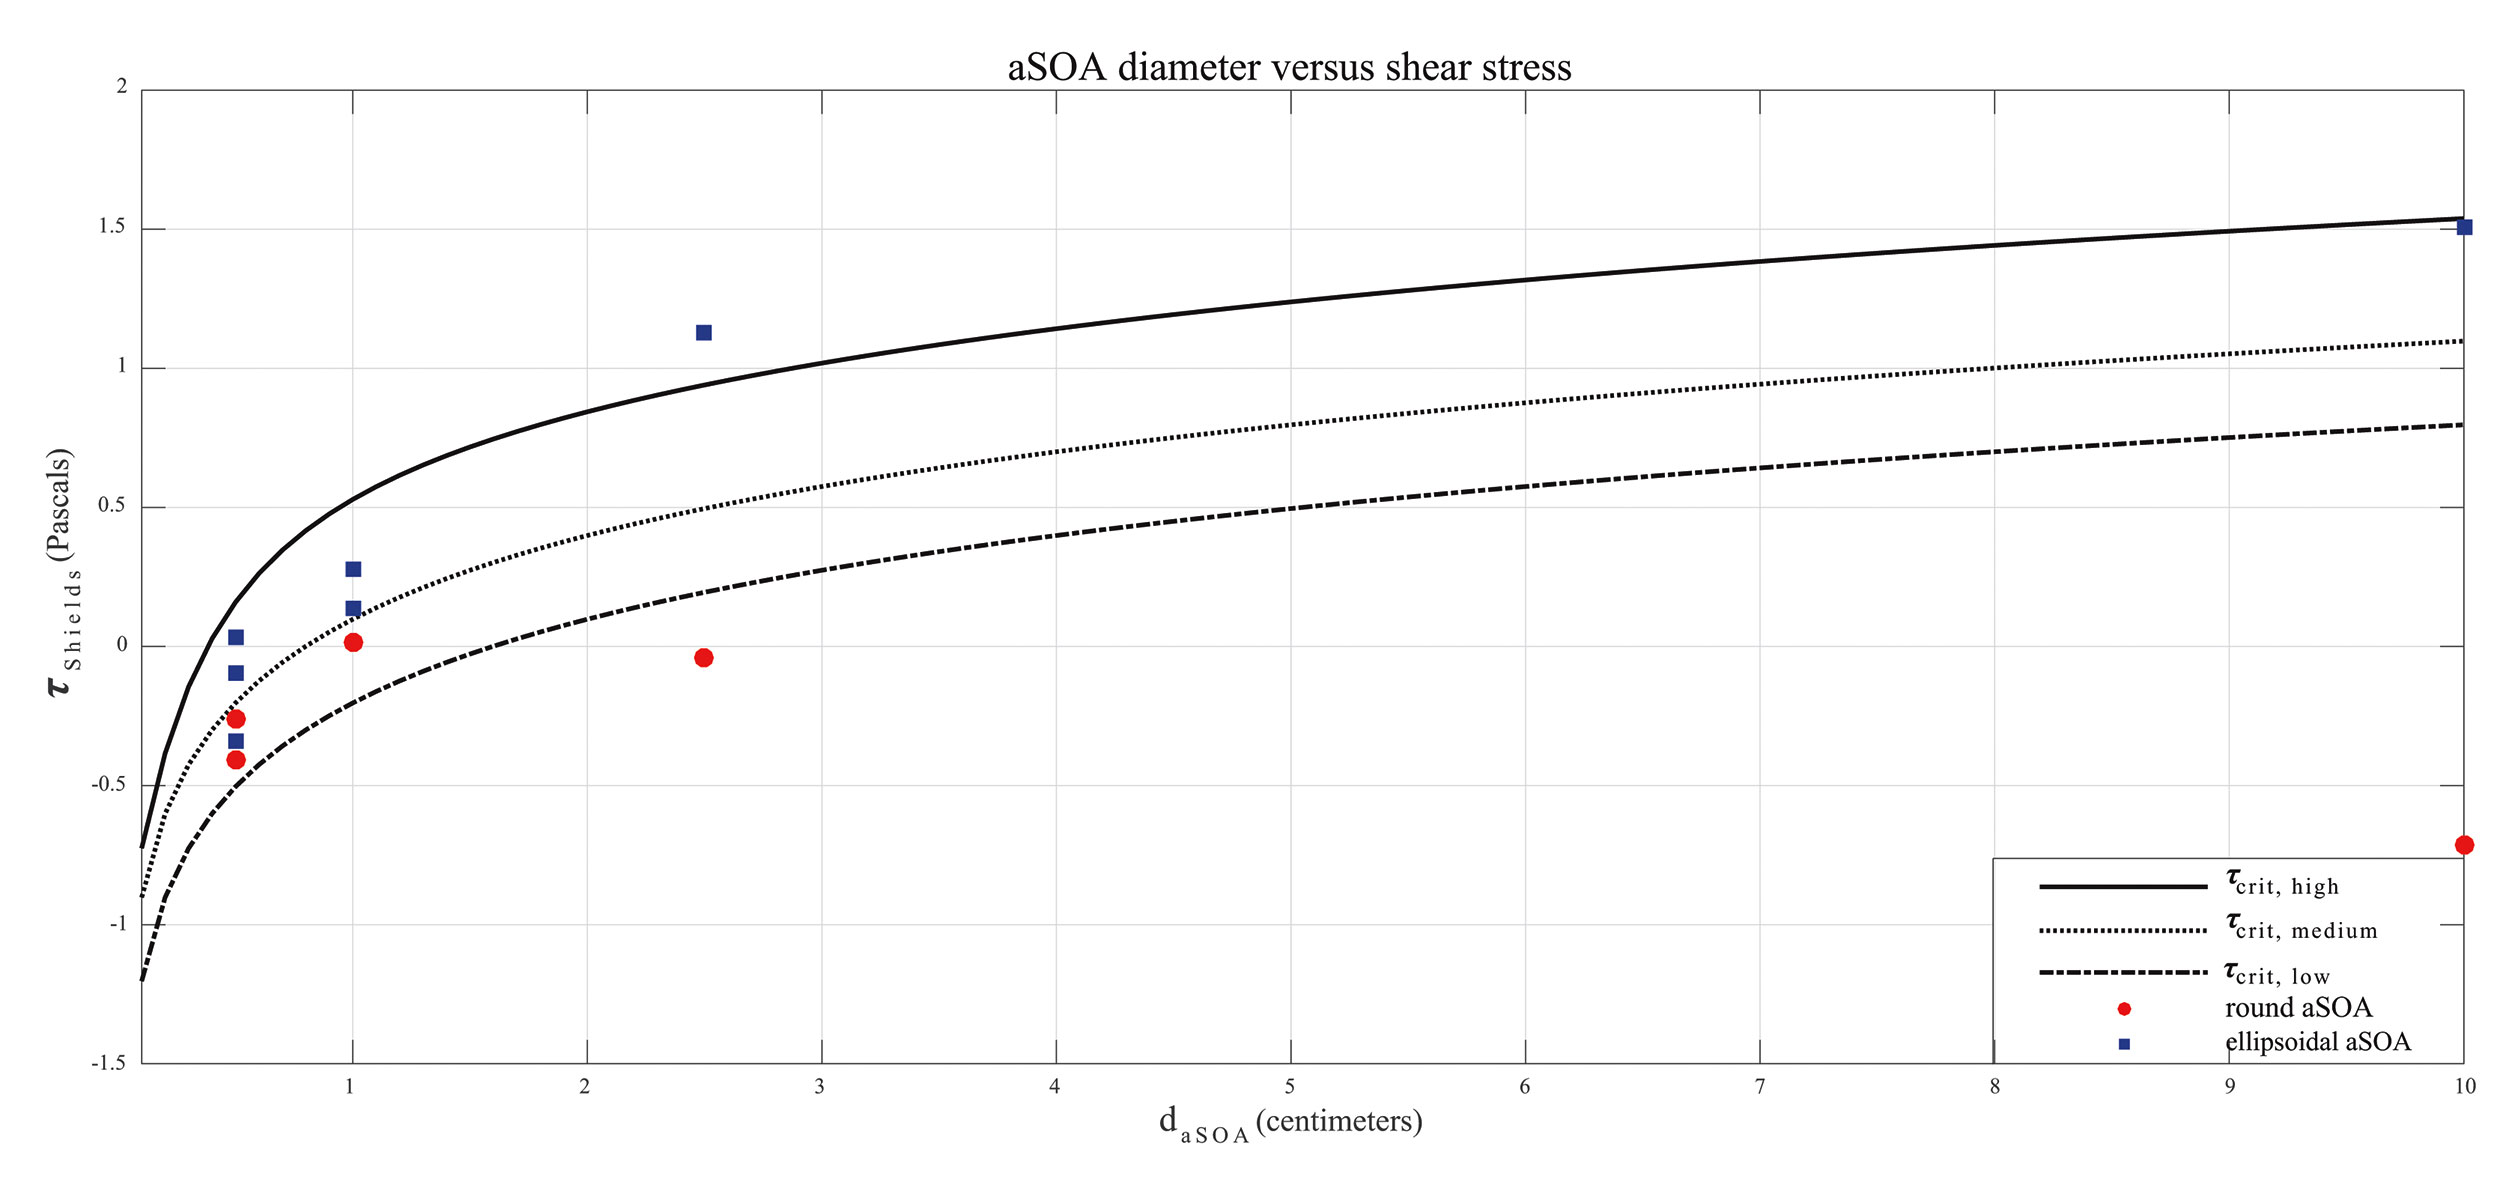 Figure 8. Plot of artificial sand and oil agglomerate (aSOA) diameter versus shear stress on a log scale. Curves on this plot indicate predicted high-, medium-, and low-critical stresses of incipient motion. Observed shear stress at incipient motion for aSOAs are shown as red circles for round aSOAs and blue squares for ellipsoidal aSOAs. [Click figure to enlarge] Sea-Floor Interaction Experiments (Movable Sand Bed)Experiment A (0.5-, 1-, and 2.5-cm aSOAs)A variety of aSOA movement and sea-floor interactions were observed during experiment A, which consisted of an initial deployment of two aSOAs each (one sitting proud atop of the seafloor and one partially buried) of the smallest three size classes (0.5, 1, and 2.5 cm). At the start of the experiment, no aSOA movement or significant bed interaction was observed, while sand began to be mobilized with increasing frequency of the oscillatory current. As the flywheel frequency increased, some aSOA rocking and twitching motion was observed. The sand began to scour around the aSOAs sitting proud atop the sea floor, while aSOAs that were initially partially buried began to be exhumed. Microtopographic bed features (ripples of various scales) also formed and began migrating, in some cases partially or completely burying the relatively stationary aSOAs. The exhumation of partially buried aSOAs eventually reversed, resulting in infilling and burial. After segment 004, the flywheel was stopped and the tank was restarted from the water at rest. The bed was not releveled and all aSOAs were left in place. For segments 005, 006, and 007, the flywheel began at a relatively higher frequency of 60 rpm and was increased to 70 rpm. During these higher flow velocity segments, all exposed aSOAs rocked, slid, or otherwise moved. The 0.5- and 1-cm aSOAs moved freely by bedload transport (spinning, rolling, or bouncing over ripple crests). In some cases, mobilized aSOAs were trapped in eddies at the toe of migrating ripples and subsequently buried. Ripples evolved and migrated more quickly under the higher velocity flows, resulting in cycles of burial and reexposure of aSOAs. Exposed and mobilized aSOAs moved in the along-channel direction, driven by asymmetry in the flow. Experiment B (0.5-, 1-, and 2.5-cm aSOAs)The final conditions from experiment A of the movable sand bed and aSOA positions were used as the initial conditions for experiment B, but with the addition of a GoPro HD video camera in the trough of the rippled bed (fig. 8). A total of five segments were carried out for this experiment, which was halted after flow conditions exceeded the threshold for the unsecured GoPro to become mobilized. Similar aSOA dynamics as seen in experiment A were observed. Bubbles, low-density debris, and sand began to move at low frequencies. As the frequency was increased, aSOAs began to rock, roll, slide, and scour. Microtopographic bed forms also began to move. Activity increased under further increased frequencies, which led to the reexposure of larger buried aSOAs as bed forms translated and developed. Some smaller aSOAs of size 0.5 cm remained unburied and moved freely with current under increased frequency. Higher frequencies were sustained for an extended period, which led to further development of microtopographic features and a cycle of burial and reexposure of aSOAs as they interacted with translating sand ripples. Experiment C (5-10-cm aSOAs)The primary focus of this experiment was larger (5+ cm) aSOAs, although the smaller aSOAs used in experiment B were not removed from the tank and may be visible in the videos. Round and ellipsoidal aSOAs (5 cm) and a 10-cm ellipsoidal aSOA were placed on the rippled bed (a 10-cm round aSOA, primarily constructed for the purpose of incipient motion experiments, was not deployed). Even under higher velocity flows, the motion of the 5-cm aSOAs was constrained to small sliding or flipping motions. The only significant movement exhibited by the 10-cm ellipsoidal aSOA was when it began to emerge, as a ripple that had buried the aSOA began migrating away. In that instance, a gap between the aSOA and the sea floor was created by the angle of burial, resulting in eddy formation (visible through sand movement) and eventually leading to the aSOA flipping over. Burial and exhumation of the aSOAs occurred frequently, predominantly through the migration of a ripple over a relatively stationary aSOA. Experiment D (0.5–10-cm aSOAs)In this experiment, two groups of aSOAs with members from each size class were placed on a leveled sand bed with a distance between them to minimize initial interactions between groups. One had a loose group with each aSOA a few centimeters away from its neighbors, while the other had a tight group with aSOAs directly adjacent to one another. In the loosely strewn group, scouring, rocking, and sliding of 0.5-cm and 2.5-cm aSOAs occurred under low-velocity flow. The 5-cm-diameter aSOA slid, while smaller aSOAs flipped and rolled. As the frequency of the flywheel increased, the strewn mat dispersed even more widely. Eventually, larger (2.5-cm+) aSOAs from this group were buried by developing ripples. In the tightly arranged group, the presence of the larger aSOAs noticeably sheltered and constricted the motion of the smaller aSOAs in the group. Small aSOAs (0.5–1cm) rocked but did not break free of the cluster under the same flow conditions that led to free movement of the same sized aSOAs in the loosely arranged group. Small and large aSOAs in the tightly arranged group interacted as they began to flip and rock, occasionally resting against or partially atop each other. Ripples that formed in the bed around the tightly grouped aSOAs were smaller than those that formed near the loosely strewn grouping. Relatively lower overall mobility in the tightly arranged group led to earlier and more complete burial of aSOAs. |

![]() U.S. Department of the Interior |
U.S. Geological Survey
U.S. Department of the Interior |
U.S. Geological Survey
URL: http://pubsdata.usgs.gov/pubs/of/2018/1010/ofr20181010_results.html
Page Contact Information: GS Pubs Web Contact
Page Last Modified: Thursday, 26-Apr-2018 09:54:33 EDT
