Scientific Investigations Report 2010–5065
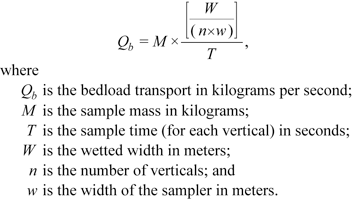
Bed Material—Characterization, Transport, and BudgetPartly building on the channel mapping, a primary objective of this study was to estimate the volume of bed material entering the lower Chetco River and the distribution of this material during transportation and deposition within the study reach. Because of the multiple uncertainties and factors in such an analysis, we have adopted multiple measurement and analysis approaches. The overall analysis framework is that of a sediment budget (for example, Reid and Dunne, 1996, 2003), accounting for the various inputs and outputs of bed-material affecting the 16-km-long study reach. The analyses focused on bed material, the sediment along the bed of the active channel. For the Chetco River, bed material includes the substrate of the low-flow channel and the flanking gravel bars, and consists chiefly of sand and gravel (clast diameters greater than 0.063 mm and ranging up to 250 mm). These materials are transported through the river corridor primarily as bedload by bouncing, sliding, or rolling along the bed, although some sand (clasts with diameters between 0.063 and 2 mm) may be transported as suspended load, supported higher in the flow by turbulence. The specific factors that require consideration for a bed-material budget are the (1) volume of bed-material transported into the reach from upstream, (2) volume of bed material transported directly into the reach by tributaries, (3) volume of bed material leaving the reach by fluvial transport into the Pacific Ocean, (4) volume leaving by other means (dredging, gravel extraction), (5) change in storage within the reach (owing to channel and bar deposition and erosion), and (6) attrition of bed-material clasts by mechanical breakage as they are transported and conversion of some mass of the bed-material load into finer materials. Adding to the challenge posed in considering all these factors is that the fluxes can vary tremendously in space and time (Gomez, 1991). Two independent approaches were applied to assess bed-material transport rates and storage throughout the study reach: (1) a transport equation approach in which bed-material transport was calculated on the basis of prescribed flow, channel geometry, and sediment conditions, and (2) a mapping based approach in which bed-material fluxes were estimated from spatial and temporal changes in the volume of stored sediment along the study reach. Underlying these approaches were basic characterization of the sediment and flow conditions, in addition to the mapping of active channel features as described above. Bed-Material Characterization and SourceThere were two objectives in characterizing the bed material. The first was to assess the size distribution of the bed material to support analyses of transport rates and bar-surface armoring. The second was to assess sediment sources and possibly particle attrition rates by evaluating spatial patterns in clast lithology. Gravel Distribution and TexturesA robust description of the Chetco River bed material is central to understanding overall patterns of sediment storage along the study area. Particle size information also supports sediment flux calculations by bedload-transport equations, and inferences of relations among sediment supply, channel morphology, and shear stress (for example, Dietrich and others, 1989; Lisle and others, 2000). The active gravel bars along the Chetco River study area are expansive (figs. 3, 8, and 21), some extending for lengths greater than 1 km with widths exceeding 0.25 km. The total bar area within the study reach in 2008 is about 0.9 km2, approximately equal to the total low flow channel area. The mean bar height above the channel thalweg is 3 m, as determined from the mapping, LIDAR topography, and longitudinal profile survey. SamplingBed-material textures were characterized by sampling 12 mainstem Chetco River gravel bars along the length of the study reach during September 2008. These data were supplemented by measurements at three tributary channels (table 4). For each of these bars, surface-particle sizes on the bar apex were measured. For three of the Chetco River mainstem bars, additional surface samples at the middle and downstream areas of the bar were measured, and substrate was sampled at the bar apex (table 4). Surface material sampling was by a modified grid technique (Kondolf and others, 2003), measuring grain size for 200 particles at 0.3-m increments along two parallel 30-m tapes. The tapes were spaced 1–2 m apart and were aligned parallel to the long axis of the bar. Clast measurements were by aluminum template (Federal Interagency Sediment Project US SAH-97 Gravelometer). Subsurface samples were collected to assess the difference between the bed surface and subsurface textures (a measure of “armoring”) and to support transport calculations with substrate-based bed-material transport equations. Subsurface samples at the bar-apex surface-sample measurement sites were collected from three bars—Fitzhugh Bar (FPkm 15.5), Social Security Bar (FPkm 6.1), and Tidewater Estuary Bar (FPkm 3.0) (table 4). Each subsurface sample was collected by removing the surface layer, consisting of the approximate depth equivalent to the median surface particle diameter, and then collecting 15–20 L from an excavation about 40 cm deep and 20 cm in diameter. Subsurface-sample masses ranged from 33 to 39 kg, and are probably not large enough to adequately characterize the distribution of clasts greater than 64 mm (Church and others, 1987; Kondolf and others, 2003). These samples were dried, sieved, and weighed by the USGS sediment laboratory in Vancouver, Washington. For each of the subsurface samples, one clast was in the largest size bin, accounting for 15 percent, 5 percent, and 2 percent of the samples at Fitzhugh Bar, Social Security Bar, and Tidewater Estuary Bar, respectively. For Fitzhugh Bar in particular, this single large 128–256 mm clast forms a relatively large proportion of the total sample, possibly biasing the gradation curve to larger values and resulting in a calculated d50 (and other percentile) value larger than would be derived from a larger sample, which would presumably have a relatively smaller volume in the largest size categories. Assessment of Bed-Material SizesFor all main stem Chetco River bar-apex surface samples, the median particle diameter (d50) ranged from 57 to 17 mm (fig. 22). The three tributary samples were also bracketed by this range of median particle diameters. The surface material size distributions show a trend of coarsening between FPkm 14.5 and the confluence of the North Fork Chetco River at FPkm 7.6, followed by fining towards the estuary (FPkm 3). For the three bars with multiple surface samples, median particle size decreases by approximately 30–50 percent along the length of the individual bars (fig. 23). The bar apices also show bimodal size gradations, the apex sites have similar or greater amounts of fine sediments (less than 10 mm) than at the distal bar sites, probably because of sand and fine gravel deposition on these typically lower elevation sites by waning or later smaller flows after bar mobilization events. The three subsurface samples were substantially finer than the surface-material samples measured at the same locations (fig. 23). Previous studies have shown that the relative coarseness of the surface layer increases as a function of the excess transport capacity and that reaches where sediment supply exceeds transport capacity should have little to no armoring, whereas reaches with excess capacity would show increasing levels of armoring (Dietrich and others, 1989; Buffington and Montgomery, 1999). Although the exact relations are uncertain, the degree of armoring (defined as the ratio of d50 surface material to d50 substrate) can be used as an indication of sediment supply relative to transport capacity (Bunte and Abt, 2001). Generally, armoring ratios of about 1 indicate high sediment supply, whereas armoring ratios greater than 2 typically indicate channels with excess transport capacity (Bunte and Abt, 2001). On the Chetco River, armoring ratios at Fitzhugh Bar, Social Security Bar, and Tidewater Estuary Bar were 1.52, 2.09, and 2.41 respectively, indicating high sediment supply relative to transport conditions at the upstream end of the study reach (although the Fitzhugh Bar armoring ratio may actually be higher if the subsurface sample is biased as described above), but could indicate excess transport capacity relative to sediment supply in the North Fork and Estuary Reaches. The increasing ratio of median surface layer diameter to subsurface median diameter is also counter to typical conditions where armoring ratios decrease with channel slope (Pitlick and others, 2008), a possible indication of downstream changes in sediment supply relative to transport capacity. Bed-Material Lithology and SourcesAn important component of the overall sediment budget is the volume of material entering the study reach by tributaries. At the upstream end of the study reach, the contributing drainage area is 702 km2, 77 percent of the total basin area at the mouth of the Chetco River. The largest tributaries are Emily Creek (FPkm 13.2, drainage area 32 km2), North Fork Chetco River (FPkm 7.6, drainage area 104 km2), and Jack Creek (FPkm 5.8, drainage area 22 km2), together accounting for 158 km2 of the 211 km2 of drainage area gained by the Chetco River through the study reach. All three of these tributaries have small fans at their junction with the mainstem Chetco River that have episodically grown and eroded, indicating that bed-material is entering from these tributary catchments. The simplest approach to estimating the volume of bed material entering the Chetco River from the tributaries is to assume that sediment volume is proportional to contributing area. This assumption, however, fails to account for possibly different sediment production rates within the drainage basin because of geology, physiography, and land use (Maguire, 2001). To independently assess the contributions of tributaries, clast lithology at all sites of particle size analysis were evaluated, taking advantage of the distinct geologic terranes contributing sediment to different parts of the drainage basin. For all bed-material size measurements, clasts greater than 11 mm were classified according to lithology. The lithologic classifications used in this study were not complete identifications traceable to specific geologic units, but simple categories facilitating rapid and consistent hand sample identification. A total of 16 lithologic categories were developed, but 3 of these categories—quartzite (metasandstone), sandstone, and basalt—dominated the total assemblage of particles sampled. Surface material was classified in the field during the particle size counts, and lithologies of subsurface material were determined on the sieved samples after size analysis by the USGS sediment laboratory. The dominant clast type for all mainstem sampling sites was a dark grey and very hard metasedimentary rock designated as “quartzite,” composing 50–80 percent of most mainstem samples (fig. 24), followed by fine- to coarse grained lithic sandstones typically composing 20–40 percent of the sampled clasts. These clast types are likely derived mainly from the Dothan Formation, which underlies the western part of the drainage basin, and they enter the study reach from upstream and from tributaries. Several clast types are unique to the upper drainage basin and the mainstem Chetco River at the upper end of the study are, including coarse-grained igneous and metamorphic rock, and ultramafic rocks, but they typically compose less than 10 percent of the sampled rock types. Bed material was sampled at the three major tributaries, Emily Creek, North Fork Chetco River, and Jack Creek, for which the percentage of sandstone was greater than most main stem sample sites. The small number of distinctly upper-basin lithologic classes and their variation among samples precludes strong inferences regarding the contribution of bed material by the tributaries except that these clast types, in relatively similar percentages all the way to the estuary, indicate that the bed material brought in by tributaries is not a substantial percentage of the sampled distributions. A mixing model analysis of the ratio of sandstones to quartzites applied to samples from Emily Creek and North Fork Chetco River with adjacent mainstem samples indicates that the North Fork contributes as much as 7 percent of the total bed-material volume at its confluence (compared to the 12 percent of the total basin area at the confluence), and that Emily Creek contributes 7–31 percent at its confluence (compared to the 4.4 percent of the total basin area at the confluence), although these values are highly sensitive to the selection of local main stem distributions. Given the ranges permitted by this analysis, it is assumed that bed-material sediment influx from tributaries is related to drainage area, indicating that about 25 percent of the bed material in the study reach is contributed by local tributaries. Bed-Material Particle AttritionIn contrast to the bed material introduced by tributaries is the bed material worn down by fracture, abrasion, dissolution, and weathering as it moves downstream. Particle attrition reduces bed-material sediment volumes because some of the finer particles created by mechanical breakage will become part of the suspended load that leaves the active channel environment either for overbank flood-plain deposition or to the Pacific Ocean. Primary evidence for such attrition is the downstream fining of bed material typically seen in gravel-bed rivers (Mackin, 1948; Schumm and Stevens, 1973), made stronger by instances of differential fining of distinct clast lithologies (Plumley, 1948; Shaw and Kellerhals, 1982; Kodama, 1994). Many studies, however, have shown that such fining results chiefly from sorting by selective deposition (Paola and others, 1992; Hoey and Ferguson, 1994; Rice 1999). For the Chetco River, a decreasing trend in the size of sandstone clasts relative to quartzite clasts in the downstream direction indicates some particle breakdown (fig. 24). Although complicated by many factors such as the introduction of tributary sandstone clasts, the approximately 40 percent reduction in particle diameter for the sandstone clasts relative to quartz would indicate nearly an 80 percent volume reduction of sandstone. If the sandstone clasts were the only clast type with considerable attrition, the volume reduction of the gravel would be less than 10–20 percent given the small percentage of sandstone composing the greater than 11 mm sediment. Downstream volume loss was also assessed by applying the attrition coefficients provided by (1) the fractional diameter reduction of quartzites in natural rivers of 0.0017/km by Shaw and Kellerhals (1982), giving a volume reduction of 5.5 percent for length of channel between FPkm 15 and 5; and (2) the experimental tumbler results by Collins and Dunne (1989) for Olympic Peninsula rocks that indicate fractional diameter reduction rates equating to a 10–30 percent volumetric reduction by abrasion between FPkm 15 and 5. The Collins and Dunne (1989) attrition rates were determined to be the maximum plausible volumetric reduction because of the likely greater hardness of the Chetco River bed materials. Taken together, the volumetric bed-material attrition rate along the length of the Chetco River study reach was determined to be between 5 and 30 percent. Flow ModelingThe driver of bed-material transport is streamflow, including the temporal sequence of high flows over the years and the spatial distribution of hydraulic conditions along the channel. The sequence of past flows for the Chetco River comes from records of the USGS streamflow-gaging station at FPkm 15.2 (fig. 2). To determine the spatial distribution of hydraulic conditions produced by this range of flows on the Chetco River, a one-dimensional hydraulic model of the study reach was constructed. The results from this model support the equation-based predictions of bed-material transport described subsequently. For the Chetco River study area, the Hydrologic Engineering Center’s River Analysis System (HEC-RAS) Version 4.0 model (U.S. Army Corps of Engineers, 2006) was applied. The HEC-RAS model calculates one-dimensional (cross section averaged) energy-balanced water surface profiles for a series of cross sections, specified discharges, and energy loss coefficients. Calculated values include cross section-average water-surface elevations and energy slopes (Sf) for each cross section. Calculations proceed upstream for applications in subcritical flow regimes. For this analysis, valley-bottom geometry was defined using 68 cross sections between FPkm 0.5 and FPkm 15.5. Cross sections spanned the entire valley bottom and were spaced at intervals approximately equal to the active channel width (typically about 300 m), but with a maximum spacing of 900 m. The cross sections were developed from the LIDAR topography merged with bathymetric surveys, from 2008, and from streamflow measurement surveys at the USGS streamflow-gaging station. The upstream-stepping flow computations for each simulated discharge were started at normal depth at the downstream cross section at FPkm 0.5. Discharge was assumed to increase by 14 percent at the North Fork Chetco River confluence at FPkm 7.6, consistent with incremental area contributed by this basin relative to the drainage area at the upstream end of the reach. Flow from other tributaries entering the Chetco River within the study area was not considered because the North Fork Chetco River is the only tributary basin with large enough area likely to contribute substantial discharge at, or near, the same time that discharge is peaking in the main stem Chetco River. The HEC-RAS model was calibrated by comparing the calculated water-surface elevations to the rating curve in use during summer 2008 at the USGS streamflow-gaging station at FPkm 15.2 near the upstream end of the modeled reach of the Chetco River. A suitable fit resulted from applying Mannings n values of 0.04 to the channel bed and banks for the entire study reach. The calculated profiles from this model closely match the water-surface profile determined from the LIDAR topography survey of 2008, when flow was approximately 7.8 m3/s according to the stage-discharge relation at the USGS streamflow-gaging station and water-surface elevations during the flow at 1,440 m3/s on December 29, 2008. From this calibrated model, water-surface elevation and Sf were calculated for each of the 68 cross sections and for 20 discharges ranging between 5.5 and 2,270 m3/s, encompassing the range of flows likely to transport bed material as well as all recorded flood peaks since 1970 (fig. 25). The calculated water-surface and energy profiles generally match the thalweg and low-flow water-surface profiles, but become more regular with increasing discharge (fig. 25). This transformation is due to the decreasing influence of channel morphology, such as pool-and-riffle geometry, and increasing influence of overall valley geometry on flow hydraulics as discharge increases. Because of the specified downstream boundary condition of normal depth, the modeling results do not account for the approximately 2 m tidal range affecting the Estuary Reach, which has a significant effect on low flows, but is not likely to affect mean sediment transport conditions during high flows. All profiles show a gradient inflection for low flows that corresponds to the upstream limit of tidal influence and a slight change in the thalweg slope near FPkm 5. The gradient inflection for high flows moves upstream into the Mill Creek Reach, approaching FPkm 10 for flows of 2,000 m3/s, corresponding to the substantial increase in valley-bottom width near the North Fork confluence. This change in slope has implications for reach-scale bed-material transport. The flow modeling also shows that most bars are inundated by flows of 250–500 m3/s. Direct Measurement of Bedload TransportAlthough challenging and subject to many uncertainties, direct measurement of bedload transport can substantially aid estimates of annual fluxes of bed material (Hicks and Gomez, 2003). An ideal situation is to make numerous bedload transport measurements over a range of flows to produce a bedload rating curve relating bedload transport rates to river flow (for example, Emmett, 1980; Wilcock and others, 1996; Pitlick and others, 2008). This process requires multiple measurements, possibly over several years to encompass the necessary range of flows, and is especially difficult for rivers such as the Chetco River in which sediment transporting flows are in response to short duration rainfall events. As a consequence, the purpose of making bedload measurements on the Chetco River was not to develop a bedload transport rating curve but solely to aid in selection of bedload transport equations as described in the following sections. The measurements reported here, however, could be incorporated into a bedload rating curve as part of a sustained measurement program. SamplingTwo measurement trips were completed during winter 2008–09. The measurements were made from the bridge crossing the river at the USGS streamflow measurement site at FPkm 15.2, near the upstream boundary of the study reach. The channel here makes a sweeping left bend, with the low flow channel abutting steep bedrock of the valley wall, and the left side formed by an active gravel bar inset against vegetated flood plain. For sampling, an 80 kg TR-2 bedload sampler with a 30-cm-wide by 15-cm-tall opening was used with a 0.5 mm mesh collection bag (fig. 26). The TR-2 sampler was designed by the USGS in 1986 to sample coarse sand and gravel near Mount St. Helens after the eruption of 1980 (Childers, 1992), and has size and weight characteristics appropriate for the high flows and coarse sediment loads typical of the Chetco River. The sampler was suspended from the bridge with a truck-mounted hydraulic winch. The nose of the sampler was stabilized by a line running through a wheeled pulley riding a stay line crossing the river about 30 m upstream, with the free end controlled by personnel on the bridge deck. Sampling protocols were modified from the single-equal-width-method prescribed by Edwards and Glysson (1999) to account for time limitations. For each sampling transect, the cross section was sampled by 8–10 verticals (in contrast to the 20–40 verticals recommended by Edwards and Glysson (1999)) spaced at 4.6–6.1 m apart. The sampler was placed on the bed for 30 seconds for each sample. The intent was to make multiple transects for each measurement, but time and equipment limitations allowed only one complete (or nearly complete) transect for each measurement. The sampler was emptied after most individual vertical measurements, except near the flow edges where little material was collected. Samples were dried, weighed, and sieved by the U.S. Geological Survey Sediment Laboratory in Vancouver, Washington (table 5). Transport rates were calculated by
The first measurement trip was December 28–29, 2008, during a wet storm producing high flows along the southern Oregon coast. Flow on the Chetco River increased from about 105 m3/s early on December 27 to a peak of 1,200 m3/s at 1215 on December 28, before decreasing to about 880 m3/s by midnight of December 28. Flow then increased again, peaking even higher at 1215 on December 29 with a discharge of 1,450 m3/s. For comparison, the 2- and 5-year recurrence interval flows on the Chetco River are 1,060 and 1,425 m3/s, respectively (fig. 27). During these flows, depths exceeded 12 m and surface velocities were greater than 3 m/s. Two measurement transects were completed on December 28. The first, between 1100 and 1310, spanned the peak flow for the day. Because it was difficult to maintain the stability of the sampler in the water and to be certain that it was securely on the channel bed (severe drag on the supporting cable and stay-line prevented detectable slackening of the support cable when the sampler grounded), this measurement is considered inferior to the second measurement of the day, between 1400 and 1606, in which the sampler maintained better position and contact with the bed. An attempted measurement during the high flow of December 29 was unsuccessful because the velocities and flow depths prohibited the sampler from reaching the channel bottom in a controlled manner. The second measurement trip was on February 24, 2009, in the midst of several days of elevated flow after a late winter frontal system that crossed the Chetco River drainage basin. Flow increased from less than 30 m3/s early on February 21 to a peak of 450 m3/s at 1800 on February 23 and decreased overnight. During the February 24 sampling between 1123 and 1217, flow was steady at 290 m3/s for the entire measurement period (fig. 27). This flow has been exceeded on a mean daily basis for 4.4 percent from October 1, 1969 to March 5, 2009. Sampling proceeded well for this bedload measurement, with much less intense flow than the December 28–29 event, and solid contact with the bed, until the 8th (and penultimate) vertical near the right bank, when the sampler support cable failed, halting completion of the transect. The partial results are reported in table 5 and the calculated transport rate should be considered a minimum value, although the two missing verticals would add negligibly to the total judging from (1) the relative contribution of load from that part of the cross section during the December 28 measurements, (2) the trend of sample masses from this transect, and (3) acoustic Doppler “moving bed” measurements made later in the day (fig. 28). Results and Discussion of Bedload SamplingDespite the sampling difficulties and incomplete results, the measurements show high rates of coarse bedload transport at high flows (fig. 28, table 5). The transport rate for the December 28 1400 measurement, corresponding to a flow slightly exceeding the 2-year recurrence-interval discharge, was nearly 150 kg/s, with an average unit transport rate of 2.1 (kg/m)/s. As expected, the transport rate of the lower flow of February 24, 2009, was much less—only 15.7 kg/s and a unit transport rate of 0.26 (kg/m)/s. The transport rate calculated from the December 28 1400 measurement is higher than nearly all reported examples of high bed load transport rates on western U.S. gravel-bed streams and rivers—which typically range up to about 0.4 (kg/m)/s—but is less than the 3.9 (kg/m)/s measured for the North Fork Toutle River in a drainage basin tremendously disturbed by the 1980 Mount St. Helens eruption (Pitlick, 1992; Pitlick and others, 2009). The measured transport rate at the highest flow, 1,190 m3/s, was substantially lower than the rate later in the day at a slightly lower flow, but this discrepancy is due to poor sampler contact with the bed for several measurement verticals. Evident from all measurements, including the “moving bed” Doppler measurement also made on February 24, 2009, is that most bedload transport was over the gravel bar forming the left bank, despite higher velocities in the channel thalweg (fig. 28). The median particle size of the bedload scaled with water discharge for the December 28, 2008, measurements ranging from 13 to 31 mm, whereas sediment collected during the February 24, 2009, high flow was chiefly sand with a median diameter of 0.8 mm. The d84 for measurements made on December 28, 2008, at 1100 and 1400 were 50 and 60 mm respectively, slightly finer than the 70- to 110-mm d84 values for surface and subsurface bed-material samples collected from Fitzhugh bar, 0.5 to 1 km upstream (fig. 29). Although bedload is typically finer than the surface material and is closer in size to subsurface material (Lisle, 1995), it is possible that the TR-2 sampler, with its 152- by 305-mm opening, was undersampling the largest clasts. Alternatively, still higher flows may be required to transport the coarsest particles in this reach. Estimation of Bed-Material Transport Rates Using Established Transport EquationsApplication of bed-material transport formulas are a common means of estimating sediment fluxes in streams (Collins and Dunne, 1989; Gomez, 1991; Hicks and Gomez, 2003). A primary advantage of using bedload transport equations is that the approach can be applied on any stream for which information on flow, channel geometry, and bed sediment characteristics is available. Moreover, the application of these formulas is typically straightforward and can provide a relatively rapid means of estimating sediment flux across a range of flow scenarios, from individual storm events to decades. For the Chetco River, multiple transport relations for seven locations were applied between FPkm 15.3 and 2.6 for the nearly 40 years of available flow data, enabling assessment of spatial and temporal trends in bed-material transport. Although several empirical and semiempirical transport equations are available for bedload transport (Gomez and Church, 1989), all actually predict only the transport capacity, defined as the “maximum load a river can carry” (Gilbert and Murphy, 1914, p. 35). For conditions of unlimited bed material available from the bed and banks, a correct relation for transport capacity coupled with accurate descriptions of flow and bed material should result in accurate estimates of bed-material flux. For the Chetco River, the assumption of unlimited supply relative to transport capacity is probably approximately valid because of the voluminous gravel accumulations flanking and underlying the valley bottom within the study area and in the 12 km upstream of the study area. Nonetheless, even if river conditions meet this requirement that bed-material transport is a function of flow, channel, and bed texture rather than sediment availability, large uncertainties still arise because bed-material transport is highly variable in time and governed by highly nonlinear relations between local flow and bed-material transport—both of which are difficult to characterize at high resolution (Gomez, 1991; Wilcock and others, 2009). These challenges, in conjunction with the wide variety of field situations and few measurements, in part explain the large number of transport equations available and the variation in their forms and data requirements (Hicks and Gomez, 2003). For this study, we assess and possibly mitigate for these factors by (1) evaluating multiple transport relations for multiple cross sections, (2) checking transport equations against the direct bedload measurements, (3) characterizing flow at individual cross sections using the results from a calibrated one-dimensional flow model, and (4) evaluating the results in the context of other information on sediment flux rates. Equation Selection and AnalysisThe bedload transport calculations for the Chetco River were implemented by the software package Bedload Assessment in Gravel-bedded Streams (BAGS), a program operating within a Microsoft Excel workbook (Pitlick and others, 2009). Using BAGS enables users to select from six semiempirical transport formulas, which were developed and tested using data from gravel or sandy-gravel streams (Wilcock and others, 2009). Users specify an equation and geometry, flow, and sediment parameters. With this information, bed-material transport rates are calculated for a specific flow and cross section geometry. The bedload transport formulas implemented in BAGS are:
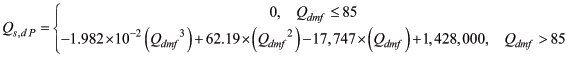
Although all six formulas are substantively similar and have been successfully applied to gravel-bed rivers, key attributes differentiate the equations, elaborated in Wilcock and others (2009). The substrate-based methods (Parker-Klingeman-McLean and Parker-Klingeman) rely on grain size data from the bed subsurface, and were developed using data collected by Milhous (1973) at Oak Creek, a small gravel-bed stream in the Oregon Coast Range. There are two surface-based methods; the first of which utilizes the Parker (1990 a, b) equation, which was developed from grain-size distributions and transport rates at Oak Creek, whereas the second surface-based method implements the Wilcock and Crowe (2003) equation, which was developed from flume experiments using varying amounts of sand. The two calibrated equations of Bakke and others (1999) and Wilcock (2001) require measurements of bedload transport in order to calibrate reference shear stress, and thus improve the overall transport estimates. In this study, four of the six bedload equations in BAGS were applied to the Chetco River; the two calibrated models of Bakke and others (1999) and Wilcock (2001) equation were not used because of too few direct bedload measurements for reliable calibration. For the Chetco River, we first applied the four equations not requiring calibration to a cross section adjacent to the bedload measurement site to enable comparison with the direct bedload measurements collected during winter 2008–09 (fig. 30). Underlying the resulting calculations are the surface and subsurface bed-material size distributions measured near the cross section, channel cross sections from the HEC–RAS model, and a range of simulated streamflows and their associated model-calculated energy-slope (Sf) values. Although all four equations overpredict the measured transport value for the higher quality December 28, 2008, 1400 measurement at a streamflow of 1,120 m3/s by a factor of 1.7–3.8, the Parker (1990a, b) and Wilcock and Crowe (2003) surface-bed-composition equations performed better than the substrate-based methods in closely predicting the transport rate measured for the 290 m3/s streamflow of February 24, 2009 (fig. 28). The subsequent analysis was carried forward using only the Parker (1990a, b) and Wilcock and Crowe (2003) bed material transport relations, which have a similar theoretical framework. The major distinction between the two approaches is in determination of the reference Shields shear stress (τ*rsg); in the Parker (1990a, b) equation, (τ*rsg) is assumed to be a constant value of 0.0386, but in the Wilcock and Crowe (2003) equation, (τ*rsg) varies with the sand content of the surface bed material. For each of 7 cross sections between FPkm 2.6 and FPkm 15.3, we calculated transport rates for 12 discharges ranging between 15 and 2,000 m3/s, using the model calculated Sf values and nearby measurements of bar-surface particle size (fig. 30, tables 4 and 6). Discharges were increased by 14 percent at the North Fork confluence to account for tributary inflow. The results for each discharge produced a relation between discharge (Q) and bed-material transport rate (Qs), which were fitted by curves to produce a sediment-discharge rating curve. Although many sediment rating curves are fit by power functions (Hicks and Gomez, 2003; Wilcock and others, 2009), this form did not fully characterize the calculated Chetco River bed-material transport rates. As a consequence, we developed continuous ratings by fitting piecewise polynomial functions to the results for each cross section. In part, the poor fit of power functions resulted from using the energy slope (Sf ) instead of a reach-averaged channel slope. The energy slopes calculated by the step backwater modeling varied substantially with discharge at nearly all cross sections (fig. 30A), reflecting the transition from channel control on slope (mostly because of the pool and riffle structure of the low flow channel) to broader valley bottom controls at higher discharges. Consequently, the transport rating curves were highly variable, especially at low discharges, but approached more typical power functions at higher discharges as Sf approached reach-scale valley slopes (for example, fig. 30B). Partly as a consequence of the nonsystematic variation of Sf with discharge, high transport rates were calculated for some cross sections at very low discharge (commonly where cross sections were located at riffles). In these cases, we assumed no transport at low discharges. The cutoff discharge ranged from 50 to 230 m3/s for all but one of the cross sections—flows typically confined to the low flow channel or barely covering low channel-flanking bars and not likely to transport substantial bed material (fig. 25; Mueller and others, 2005). For the cross section at FPkm 8.5, no transport was assumed for flows less than 425–450 m3/s, depending on the transport relation. Very low transport rates calculated for this cross section were likely the result of relatively coarse bed material at the closest sample location, coupled with low calculated energy gradients (table 6). The resulting Q–Qs relations served as a basis for calculating annual sediment transport fluxes and their spatial and temporal variation. Annual transport volumes were calculated for each cross section by applying the discharge record of October 1, 1969–September 30, 2008 from the USGS streamflow-gaging station at FPkm 15.3. Typically, annual transport volumes are calculated using mean daily values (for example, Collins and Dunne, 1989), but because of the combination of the highly nonlinear transport rates and the rapid flow changes on the Chetco River during transport events, annual bed-material transport volumes determined from mean daily values are likely to underestimate true values. Therefore, annual bed-material transport volumes were based on the higher resolution unit discharge values. For the Chetco River, unit flow values for the study period were recorded every 15 minutes after 2006 and every 30 minutes before 2006, but are only electronically archived for the post-1988 period. For the 1988 through 2008 water years, transport rates were calculated for each cross section using the 15-minute and 30-minute unit flow data, summing total transport for each day. To extend the record back through water year 1970 and to fill more recent periods when unit flow data were not available (unit flow data are not available for all of 1993 and parts of several other years), relations for each cross section were developed between daily transport volumes calculated from the unit flow measurements and mean daily flow for all days of predicted transport. For the cross-section at the USGS streamflow-gaging station (FPkm 15.3), the relations for both the Parker (1990a,b) and Wilcock-Crowe (2003) equations revealed negligible daily transport when daily mean flow was less than 85 m3/s, (which falls within the range of low-flow thresholds at nearby cross-sections determined from the Q-Qs relations based solely on unit value data; table 6). The regressions had regression correlation coefficients ranging from 0.968 to 0.998 , and were applied to all days to permit calculations for the entire record of record of October 1, 1969–September 30, 2008. For the USGS streamflow-gaging station, daily transport 1970–2008 was calculated by:
where Qs,d P is the daily bed-material transport (in kg) at the USGS Chetco River streamflow-gaging station (FPkm 15.3), determined from regression between daily mean flows and daily transport calculated from the Parker (1990a,b) transport formula applied to unit flow values. Qs,d WC is the daily bed-material transport (in kg) at the USGS Chetco River streamflow-gaging station (FPkm 15.3), determined from regression between daily mean flows and daily transport calculated from the Wilcock-Crowe (2003) transport formula applied to unit flow values. Qdmf is the daily mean flow (in m3/s) for the USGS Chetco River gaging station (FPkm 15.3). Annual transport volumes were calculated by summing daily transport and applying a bulk density of 2.1 metric tons per cubic meter.
where m is mass in kilograms. v is volume in cubic meters. n is in-situ porosity of bed-material sediment. An in-situ porosity of 0.21 was applied based on a range of porosity data collected by Milhous (2001) as presented in Bunte and Abt (2001). ρ is particle density. A standard particle density of 2,650 kg/m3 was applied. Results and Discussion of Bed-Material Transport Equation CalculationsApplication of the Parker (1990a, b) and Wilcock and Crowe (2003) bed-material transport equations for seven cross sections over 39 years indicates considerable spatial and temporal variability in predicted annual transport volumes (figs. 31 and 32). On the basis of the overall consistency in predicted transport capacity for the cross sections in the Upper and Emily Creek reaches (fig. 31) and the agreement between measured and predicted transport rates (fig. 30), the results for the cross section at FPkm 15.3 were determined to be representative of the volume of bed-material entering the study reach. For this “reference” cross section (fig. 30C), predictions of bed-material influx into the reach range from less than 3,000 m3/yr for some dry years such as 1977 and 2001, to more than 150,000 m3/yr for the wet years of 1982 and 1997 (fig. 32). The mean annual volume for the 1970–2008 period for this cross section is 51,100 m3/yr as calculated by the Parker (1990a, b) relation, and 73,900 m3/yr based on the Wilcock and Crowe (2003) equation (table 6). These values are closely bracketed by a 43,600 to 103,200 m3/yr range encompassed by the predictions of mean annual transport for all four of the analyzed cross sections in the Upper and Emily Creek reaches. For each of the seven analyzed cross sections, the calculated range of annual bed-material transport averaged over the 39-year analysis period ranged from 3,900 m3/yr at FPkm 2.6 to 103,200 m3/yr at FPkm 14.9 for the Parker (1990a, b) equation, and 4,100 m3/yr at FPkm 8.5 to 91,100 m3/yr at FPkm 11.5 for the Wilcock and Crowe (2003) equation (fig. 31). The section-to-section spatial variability of mean annual transport rates along the channel probably is not indicative of actual conditions because of (1) differences in the suitability of particular cross sections for bed-material transport calculations because of factors such as flow obstructions and along cross section variations in shear stress, (2) poor characterization of local surface particle-size distributions, particularly because some analyzed cross sections were as much as 850 m away from the nearest sediment sampling location, and (3) differences in the accuracy of the hydraulic modeling for each cross section, particularly in regards to calculated values of Sf , which is a critical flow parameter controlling transport rates (Wilcock and others, 2009). Nevertheless, the general trends evident in figure 31—transport capacities of 40,000 to 100,000 m3/yr in the Upper and Emily Creek Reaches, diminishing downstream to less than 10,000 m3/yr in the Mill Creek Reach—probably closely indicate overall transport conditions. This pattern is also consistent with geomorphic evidence of historical sedimentation in the lower Mill Creek and North Fork reaches. The annual variability in predicted bed-material transport capacity is also high (fig. 32), but this is attributable to the nonlinear relation between bed-material transport and flow coupled with the high year-to-year flow variability. For the reference cross section at FPkm 15.3, the annual calculated bed-material volumes range from 1,067 m3/yr in the particularly dry year of 2001, as calculated by the Parker (1990a, b) relation to 160,500 m3/yr in 1997, as calculated by the Wilcock and Crowe (2003) equation. The distribution of predicted annual transport volumes is negatively skewed, meaning that most years—about 60 percent—have transport rates less than the mean value. The 2002 water year record highlights the temporal variability within a single year; for this year the total bed-material transport predicted by the Parker (1990a, b) equation is 28,600 m3/s, but one-half of this volume was predicted to have been transported in a 6-day period encompassing less than 2 percent of the year (fig. 33). The Parker (1990a, b) and Wilcock and Crowe (2003) relations generally produce total annual volume estimates that agree to within a factor of 2 for most analyzed cross sections. Differences in predicted transport capacities between the two equations chiefly are because of the sand content of the surface bed material, with the Wilcock and Crowe (2003) relation predicting higher transport rates at cross sections where the sand content is higher, such as for the downstream-most site at FPkm 2.6. For cross sections where the surface samples had little sand, such as cross sections at FPkm 11.5, 8.5, and 5.3, the equations agree to within 10 percent (table 6). Quantitative assessment of the uncertainty of the transport values derived from application of these bed-material capacity equations is challenging, especially for situations of few actual measurements (Pitlick and others, 2009). The two direct bedload discharge measurements support selection of the Wilcock and Crowe (2003) and Parker (1990a, b) equations for calculating transport capacity, and the underlying assumption that bed-material transport is indeed a function of streamflow rather than supply. Measurements are lacking, however, to test these equations and assumptions for other areas in the study reach. Because of the semiempirical nature of the equations, uncertainty and errors arise from channel geometry, flow, and sediment texture characterizations. However, a range of these parameters is part of the calculated transport rates for each of the cross sections, and the resulting range of mean annual transport volumes of 51,120–103,200 m3/yr (as calculated by the Parker equation [1990 a, b]) for the four cross sections in the Upper and Emily Creek reaches transport relation provides an indication of the effects of such uncertainty as a result of characterization of local conditions. Systematic analysis of the effects of surface bed-material size on calculated transport rates for the reference cross section at FPkm 15.3 shows that a plus or minus 10 percent variation in the surface grain-size distribution results in 20–35 percent difference in predicted transport rates, indicating that transport capacity is highly sensitive to surface bed-sediment texture. One independent check of the overall reasonableness of these predicted values is consideration of the predicted transport volumes relative to bar area. For water year 2005, the Parker (1990 a, b) and Wilcock and Crowe (2003) equations applied to the reference cross section predict 31,500 and 39,500 m3 entering the study area, respectively, volumes that translate to seemingly reasonable values of 15–20 cm of deposition on all the bare bars (which generally correspond to the low elevation bar surfaces) as mapped in the study reach from aerial photographs taken in summer 2005. The primary means by which uncertainty in the transport equations could be reduced is by more direct bedload measurements. Additional measurements would allow further checking of the equations used in this analysis or enabling use of the calibrated transport equations of Bakke and others (1999) and Wilcock (2001). If a sufficient number of measurements were available over a wide range of flows, a site-specific empirical equation relating bed-material transport to flow could supplant the application of the equations and allow for more rigorous assessments of uncertainty. Estimation of Bed-Material Flux by Assessment of Channel ChangeAn independent approach to assessing the transport rates of bed material is to exploit the intrinsic relation between rates of channel change in alluvial rivers and rates of sediment transport. This type of “morphology-based” approach (Popov, 1962; Martin and Church, 1995) relates volumetric change within a reach to assumptions regarding storage, annual transport lengths, or independent boundary conditions to provide annual estimates of bed-material flux. Morphology based approaches to estimating sediment budgets have been applied to numerous gravel-bed rivers throughout the world, including many rivers in similar environments as the Chetco River (Collins and Dunne, 1989; Martin and Church, 1995; McLean and Church, 1999; Ham and Church, 2000; Gaeuman and others, 2003; Martin and Ham, 2005; Surian and Cisotto, 2007). In proper settings, this approach has the advantage of (1) being based on actual measurements of observed channel change, (2) being potentially applied for multiple periods and in the absence of flow data, and (3) integrating multiple transport events in determining bed-material fluxes, thereby avoiding the uncertainties in predicting transport from applying strongly nonlinear transport relations to highly variable flows. Morphologic AnalysisEstimates of bed-material transport rates require volumetric estimates of changes in bed material for specific periods. For the Chetco River, most bed material is stored in the bars flanking the low-flow channel, so this analysis focused on estimating changes in bar volume. Estimates of volumetric change are best acquired from repeat high resolution topographic surveys (Martin and Church, 1995; McLean and Church, 1999), but in the absence of such surveys, they are commonly obtained by mapping planview changes between sequential sets of aerial photographs and estimating the thickness of bed material involved in the mapped changes (Collins and Dunne, 1989; Gaeuman and others, 2003). Short analysis periods are preferable to reduce the negative bias in calculated volumetric change introduced by possible repeated erosion and deposition at the same location by multiple events. Consequently, the ideal situation is to calculate volumetric changes after each transporting flow (Lindsay and Ashmore, 2002), but the more typical circumstance is to rely on aerial photograph sequences spanning periods of less than 5 years. A potentially favorable situation for future analyses, made possible recently, is the opportunity to accurately determine volumetric changes by repeat LIDAR topographic surveys using the survey in 2008 as a starting point. For the Chetco River study area, we applied this approach using sequences of aerial photographs and the LIDAR topographic survey of 2008, which together span five time intervals: 1939–43, 1962–65, 1995–2000, 2000–2005, and 2005–08. This analysis was based on the maps of the active channel areas described previously. For each period, we overlaid the maps of active channel features to create three polygon classes (fig. 34): erosion, deposition or no–volumetric-change. Erosion polygons were assigned to areas where a bar or flood-plain feature mapped on the first photograph set became a water feature on the second photograph set of the analysis pair. Likewise, deposition polygons were those areas that changed from water to bar (in cases water became flood plain). Areas that did not change between land and water were classified as no-volumetric-change. Because this approach relies on the accurate mapping of depositional and erosional areas, several steps were taken to reduce mapping errors and georeferencing and rectification uncertainties. These steps included reclassifying some features on the active-channel maps to avert erroneous designations and transitions, such as classifying small disconnected water bodies as deposition because they were water filled on one photograph but dry on the next. We also eliminated all small areas (mostly less than 10 m2, but as large as 200 m2) that possibly resulted from imprecise registration or digitization of features that seemingly had not changed. These areas, however, cumulatively represent only a small percentage of the total depositional and erosional areas; for example, for the period between 1939 and 1943, the total area excluded by these uncertain polygons was less than 2 percent of total area of change. Each of the polygons remaining after this process was inspected at 1:3,000 to verify assigned classifications. As for the assessment of temporal trends in bar area, different discharges (and stages) between photograph sets in analysis pairs were accounted for by adjusting the net area of erosion or deposition by the estimated difference in bar area as a result of the difference in discharge (fig. 7). For certain year pairs, such as 2005 and 2008, for which the difference in discharge is small, this adjustment is very small. But for analysis periods such as 1939–43 and 1995–2000, this adjustment is large relative to the area of net erosion or deposition (fig. 35, table 7). More difficult to infer from the aerial photograph pairs is the thickness of bed material involved in areas of erosion and deposition, a critical parameter for estimating volumes. The approach was to designate characteristic bar thicknesses for each reach and then multiply by erosional and depositional areas to obtain corresponding volumes. An upper limit for characteristic bar thickness was determined from measurements of average bar elevation above the channel thalweg, measured by GIS analysis of the channel and LIDAR topographic measurements for 543 orthogonals spaced at 30-m intervals along the channel centerline and stratified by reach (fig. 36). Calculated in this manner, average bar height in 2008 ranged from 2.4 m in the North Fork Reach to 3.7 m for the Emily Creek Reach. To determine a lower bound, and one that probably reflects deposit thickness for newly formed bars, we used the same analysis but evaluated elevations only from bars created between 2005 and 2008 (fig. 36), resulting in estimates of “new bar” average thicknesses between 1.5 and 2.3 m (relative to thalweg) depending on reach. Implicit in using these new-bar values for earlier analysis periods is that the relation between channel thalweg elevation and bar height is similar for all periods. As shown from the channel change analysis, however, this assumption probably is not valid for certain periods, and the channel lowering after the late 1970s (without substantial coincident bar lowering) may result in volume overestimates for earlier periods, especially for 1939–43 and 1962–65, which predate channel incision. Also difficult to infer from aerial photographs is the thickness of deposition or scour on surfaces not changing status during an observation period, including gravel bars and areas within the low-flow channel. These volumes are not considered by our analysis, but could be evaluated in future analyses with additional LIDAR topography or high resolution topographic surveys. Assessment of Sediment Volumes from Morphologic AnalysisOn the basis of three depositional and erosional thickness scenarios, we calculated areas and volumes of erosion and deposition for each of the five periods and for each of the five reaches (fig. 35, table 7). The three scenarios involved multiplying the areas of erosion and deposition by (1) reach-average values for average bar thickness, (2) reach average values for average new-bar thickness, and (3) what we determined as the most realistic scenario of calculating erosional volumes by multiplying the area of erosion by the average thickness of all bars but using the average thickness of the new bars for calculating depositional volumes. This latter scenario is certainly most appropriate for the 2005–08 period, because the value for the average thickness of new bars was obtained specifically for this period. The analysis shows that for all scenarios, measured deposition and erosion areas and volumes as determined from changes in bar area are larger in the downstream reaches (fig. 35, table 7). The analysis for this period also indicates that for most periods and reaches, this measurement approach shows more deposition than erosion. The periods of greatest positive net change, after accounting for differences in flow, were 1962–65 and 2005–08, both of which spanned major floods. The relatively dry 2000–2005 period is the only period for which every reach apparently lost bed-material volume, even after accounting for the higher flow on the 2005 aerial photographs. Estimating actual transport rates requires additional assumptions. The simplest situation and the one applied in this study is to assume no gravel transport from the river to the ocean, and to consider the net changes to represent bed-material influx rates for the entire lower Chetco River. This approach has been applied to several of the British Columbia studies, in which bed-material fines downstream and the channels transition from gravel to sand bed (Martin and Church, 1995; McLean and Church, 1999; Ham and Church, 2000). This assumption may not apply perfectly to the Chetco River because of the historical presence of isolated gravel bars downstream to FPkm 1. Nevertheless, the few bars in the lower 3 km, the downstream reduction in bed-material grain size (fig. 22), and the 80- to 90-percent decrease in transport capacity (fig. 31) predicted by the transport equations for conditions in 2008 indicate that the flux of gravel-size bed material exiting the study reach is a small fraction of that entering the study reach. Accordingly, the net volume accumulated in the study reach is a minimum indication of bed-material flux at the upstream end of the study reach. A more complete assessment includes the volume removed by gravel extraction (Martin and Church, 1995), thereby implicitly assuming that the mining volumes have been replenished without substantially affecting bar and channel boundaries. This assumption is approximately correct for the Chetco River where recent gravel extraction has been by bar skimming at locations away from the low channel, and repeat surveys show substantial replenishment most years (Ted Freeman, Freeman Rock Inc. and Robert Elayer, Tidewater Contractors Inc., written commun., 2008). Therefore, for the summary calculation of lower Chetco River bed-material influx from the morphologic approach, we have added the reported volumes of mined gravel for 1995–2000, 2000–2005, and 2005–08 (table 7). Total volumetric changes and flux estimates are best assessed for the more recent periods for which thickness estimates are most valid and periods when the most reliable estimates of the volume of gravel extracted by mining are available. For the 2005–08, the total calculated net volume change ranges from 179,000 to 440,000 m3 for the three thickness scenarios (table 7). The low end of this range is from our preferred scenario of using average thickness of all bars to calculate erosional volumes but only the thickness of new bars to determine depositional volumes, and gives an annual net volume of 59,000 m3/yr. Adjusting this value for the difference in discharge in the source imagery for the 2005 and 2008 mapping lowers the average bed-material sediment balance to about 51,000 m3/yr. Accounting for the 62,000 m3/yr removed by gravel mining during 2005–07 (the LIDAR topography of 2008 was acquired before that year’s gravel mining) results in an estimated total gravel influx into the lower Chetco River of 113,000 m3/yr for the 2005–08 analysis period. This value is probably best considered a minimum value as a consequence of (1) the negative biases inherent in the method, especially for periods spanning multiple transport events (Martin and Church, 1995), (2) the assumption that little bed-material leaves the river, and (3) our selection of a thickness scenario that minimizes positive volumes; although incomplete replenishment of mined areas would bias this value positively. Similar calculations for the other two analysis periods with gravel extraction data indicate annual bed-material influxes ranging from 3,000 m3/yr during 1995–2000 up to the 45,000 m3/yr measured for 2000–05. For the earlier periods for which no reliable gravel extraction information is available, annual influx rates, considering only the changes in bar area, are small for 1939–43 (12,000 to 14,000 m3/yr) and possibly large for 1962–65 (27,000 to 111,000 m3/yr), but the wide range resulting from the various thickness scenarios and the undetermined volume of removed gravel makes these values highly uncertain. The high influx values for 2005–08 compared to the lower values calculated for 2000–05 correspond with overall high and low flow for those periods (fig. 2). Additionally, the values of annual influx, considering the range of thickness scenarios, correspond within a factor of 3 to those values predicted by the bedload transport equations for these two periods. For 1995–2000, however, the morphologic method predicts substantially smaller influxes than the transport equations. The spatial variations in areas of erosion and deposition are consistent with the overall geomorphology (fig. 35). The Upper Reach has had only small net changes in sediment accumulation volumes, and this narrow section apparently has little dynamic storage. We infer that the gravel bars within this reach have morphologies in approximate equilibrium between deposition and erosion, with entrainment approximately balanced by deposition during each transporting flow. More dynamic storage has been accommodated by the wider and lower gradient reaches downstream, particularly the Mill Creek, North Fork, and Estuary reaches. For the Estuary Reach in particular, there has been bar growth during the analysis periods, though this observation is counter to the overall trend for this reach during the entire historical period (figs. 9 and 10). Although the morphologic analysis as applied here shows the main areas of deposition and offers broad constraints on deposition and erosional volumes which can in turn provide estimates of total bed-material influxes, the multiple assumptions and uncertainties reduce precision and accuracy. The main factors hindering robust estimates are (1) the multiple year periods between photograph sets, (2) the usage of planview change as a means of estimating volumetric changes and the resulting uncertainty due to poor knowledge of the thickness of eroded and deposited areas, and (3) the substantial effects of flow stage in determining areas of erosion and deposition. For the Chetco River, these issues could be overcome by a sustained program of repeated high-resolution topographic and bathymetric surveys. More accurate morphometric estimates of sediment accumulation and erosion could be made from such surveys, for which the LIDAR topography of 2008 could serve as high-quality starting point. Bed-Material Sediment Budget for the Lower Chetco RiverConsideration of all these bed-material analyses allows for an approximate sediment budget broadly consistent with many of the study observations (fig. 37). As calculated from the transport capacity equations, the average bed material influx into the upstream end of the study reach for the 39-year period of 1970–2008 was probably in the range of 40,000 to 100,000 m3/yr. Approximately 5–30 percent of this influx is probably lost to particle attrition and breakdown, and is carried to the Pacific Ocean or overbank areas by suspended load transport. The volume lost to bed-material attrition is approximately balanced by bed material supplied by tributaries to the lower Chetco River. The transport capacity calculations, channel mapping, and morphologic analyses indicate that most of the bed-material influx has been accumulating in depositional areas within the Mill Creek, North Fork, and Estuary reaches, with perhaps little bed material sediment exiting the lower river. Net deposition in these reaches approximately matches or slightly exceeds the 59,000 m3/yr extracted for aggregate during 2000–2008, but was almost certainly exceeded by the 1976–80 rate of 140,000 m3/yr (Marquess and Associates, 1980). The substantial downstream fining and transport capacity equations indicate that most bed-material is likely retained in the lower Chetco River, with little transport, especially of gravel, to the Pacific Ocean. Comparison with Sediment Yield from Regional Drainage BasinsAlthough there has been little previous work on Chetco River sediment transport, geologic analyses and studies of other drainage basins allow for comparisons and evaluation of the reasonableness of the results obtained in this study. The key focus of this study was bed-material influx into the study reach because this is a central issue to understanding overall sediment conditions. From a wide range of considerations, including geologic uplift rates, hillslope sediment production, and actual bed-material measurement programs, estimates for bed-material production were determined to range from 26 to 610 (m3/km2)/yr for several northern California and southern Oregon coastal drainage basins, with most values being between 40 and 180 m3/km2/yr (table 8). This range translates to 28,000–126,000 m3/yr for the 702 km2 contributing area at the upstream end of the Chetco River study reach, encompassing the 40,000–100,000 m3/yr predicted by the transport capacity equations and many of the period influx rates indicated by the morphologic analyses (table 7). Summary of Bed-Material Observations and AnalysesThese analyses of bed material, transport measurements and calculations, and deposition and erosion patterns support the following observations and conclusions regarding sediment in the Chetco River. The geologic and geomorphic environment of the lower Chetco River is of long-term bed-material accumulation in response to Holocene sea level rise. The present locus of sedimentation (and consequent channel dynamism) is in the area of the North Fork confluence. Recent and ongoing uplift in conjunction with active hillslope erosion processes supply abundant coarse detritus to the channel from much of the drainage basin. The alluvial valley bottom, bed-sediment textures, armoring ratios, and close agreement between transport relations for bed-material transport indicate a balance between sediment supply and transport capacity at the upstream end of the study reach. Hence, Chetco River bed-material transport into the lower Chetco River is probably limited by transport capacity, rather than sediment supply. Applying established transport equations for multiple cross sections at the upstream end of the reach gives likely mean annual bed-material transport rates into the lower Chetco River of approximately 40,000–100,000 m3/yr for water years 1970–2008, with the reference cross section at the upstream end of the study reach giving a narrower range of 51,100 to 73,900 m3/yr (fig. 31). On a per unit area, the influx values for the Chetco River are similar to those values from nearby coastal drainage basins (table 8). Because of year-to-year flow variability, predicted influx of bed-material ranges from less than 3,000 m3 in dry years to greater than 150,000 m3 for wet years with large floods such as 1982 and 1997 (fig. 32). Transport capacity, as predicted by the transport equations, diminishes substantially downstream, from values approaching the influx rates in the Upper and Emily Creek reaches to less than 10,000 m3/yr for the North Fork and Estuary reaches (fig. 31). The decreased transport capacity of these downstream reaches is consistent with these reaches being long-term areas of sedimentation as indicated by active channel migration and bar deposition (figs. 12 and 13). The morphologic approach to estimating bed-material influx into the study reach gives a much wider range of results, with annual reach-scale net volume changes reaching as much as 200,000 m3/yr for the 2005–08 period. For this period, this rate of bed-sediment influx is about twice that predicted by the transport relation equations. For the other two periods when the methods can be compared (1995–2000 and 2000–05), the morphologic approach gives influx rates equivalent, or less than, that predicted by the bed-material transport relations (table 7). The assumptions and uncertainties intrinsic to the morphologic approach when based on historical aerial photographs reduce the utility of the morphologic analyses as applied for the Chetco River. But this approach could be valuable and much more accurate if based on annually collected high-resolution topographic data. Analysis of downstream fining and particle attrition shows that approximately 5–30 percent of the bed-material volume is worn down and transported out of the reach through particle breakage and attrition. The volume lost through attrition is approximately balanced by bed-material input from tributaries entering the study area. The predicted downstream decrease in transport capacity, the small bed-sediment particle sizes in the downstream bars, and the rough congruence between the net volume changes determined from the morphologic method with the predicted sediment influx into the reach indicate that, in the absence of gravel extraction, most bed-material sediment entering into the lower Chetco River remains in the study area, with most probably stored in the Mill Creek, North Fork, and Estuary reaches. Comprehensive measurements of particle size at bars along the study area shows armoring ratios and surface particle size increase, between the Upper and North Fork reaches (fig. 22). This downstream increase in surface coarsening may indicate that sediment supply in the North Fork and Estuary reaches is less than flow capacity. The best estimates of mean annual bed-material influx from this study—40,000–100,000 m3/yr—are of similar magnitude or slightly exceed the volume of gravel mined for the 1993–2008 period (fig. 6). For low flow years such as 2001, gravel extraction almost certainly exceeded supply. For high-flow years such as 2006, bed-material influx likely exceeded the volume mined. The voluminous gravel mining in the late 1970s (Marquess and Associates, 1980) probably exceeded replenishment rates by at least a factor of 3. |
First posted May 26, 2010 For additional information contact: Part or all of this report is presented in Portable Document Format (PDF); the latest version of Adobe Reader or similar software is required to view it. Download the latest version of Adobe Reader, free of charge. |

![]() U.S. Department of the Interior | U.S. Geological Survey
U.S. Department of the Interior | U.S. Geological Survey
URL: http://
pubsdata.usgs.gov
/pubs/sir/2010/5065/section5.html
Page Contact Information: Contact USGS
Page Last Modified:
Thursday, 10-Jan-2013 19:10:29 EST

 (1)
(1) , (2)
, (2)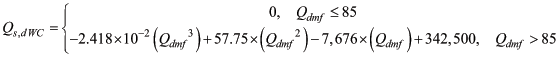 , (3)
, (3) (4)
(4)