Scientific Investigations Report 2011–5041
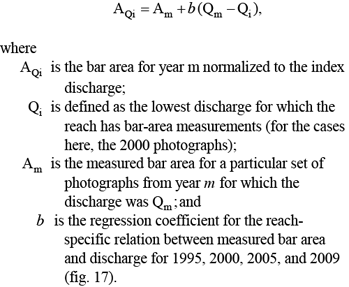
Valley Bottom Mapping and Analysis of Historical Channel ChangeA primary goal of this study was to characterize channel conditions throughout the study area and evaluate spatial and temporal patterns in gravel storage, as this forms a basis for determining historical variation in bed-material flux. Because the fluvial reaches of the Umpqua River study area above the head of tide at FPKM 40 share similar overall morphology and management issues, these reaches were assessed separately from the Tidal reach, although a similar overall approach was used for both areas. For the fluvial reaches, analysis of multiple sets of aerial photographs dating to 1939 were used to evaluate planimetric changes in channel morphology and gravel storage, supplemented by historical surveys and photographs from the mid-19th century and early 20th century. Historical variation in bed elevations were assessed using the record of channel geometry at four USGS streamflow-gaging stations and repeat longitudinal profile surveys from 1914 to 2009. Annual topographic surveys from mined sites on the South Umpqua River from between 2001 and 2009 enabled assessment of deposition rates and bar evolution following gravel extraction and various magnitude flood events. For the Tidal reach, repeat channel mapping from aerial photographs and General Land Office (GLO) surveys was used, but with a slightly different mapping protocol. Additionally, bathymetric changes and channel deepening in the Tidal reach were assessed through comparison of historical navigational surveys from 1886 to 1971 and by reviewing previous reports (Lidstone and Associates, written commun., 2008; CH2M Hill, 1971). We first describe the analysis of planimetric and vertical changes for the fluvial reaches, and then discuss the repeat mapping and bathymetric analyses for the Tidal reach. Historical Changes in Channel Planform and Vegetation Density above the Head of TideHistorical changes to channel planform and vegetation density along the fluvial reaches were evaluated primarily through repeat mapping of the active channel from aerial photographs from 1939 to 2009. GLO surveys dating to the 1850s and reoccupation of land-based photographs dating to the early 1900s extend our characterization of channel conditions into the 19th century and supplement findings from the detailed mapping. Because a major objective of the overall study is to characterize patterns of gravel storage and rates of bed-material flux, we focused our mapping activities, as well as analysis of historical GLO surveys and oblique photographs, on changes to channel character and abundance of gravel bars. In most instances, current information on channel planform and vegetation was based on the 0.5 m orthoimagery for 2005 developed from summer 2005 aerial photographs as part of the U.S. Department of Agriculture National Agriculture Imagery Program (NAIP). Acquisition and Rectification of Historical Aerial PhotographsAerial photographs from different periods provide a basis for systematic mapping of channel features and their changes. Historical aerial photographs from 1939 and 1967 were available only as scanned images, and these were georeferenced, rectified, and mosaicked to form a seamless layer for digital mapping. Recent aerial photographs from 1995, 2000, 2005, and 2009 were available as digital orthophotographs and did not require additional processing prior to mapping (table 5). All photographs were acquired during late spring to summer, when discharge was relatively low, although the discharge varies between periods (table 6). A complete description of the process by which the aerial photographs from 1939 and 1967 were scanned, georeferenced, rectified, and mosaicked is provided in the metadata for these layers (available at http://www.geodata.gov), and summarized here. Aerial photographs from 1939 were obtained from the U.S. Army Corps of Engineers and scanned by USGS staff. Scanned copies of the U.S. Department of Agriculture 1967 photographs were obtained from the University of Oregon Map and Aerial Photography Library (table 5). The photographs were spatially registered in ArcGIS 9.3, using NAIP 0.5-m resolution digital orthophotographs acquired in 2005 as a base layer to which ground control points were matched. Ground control points generally consisted of building corners or bedrock outcrops located within or near the channel and flood plain. Most georeferencing of photographs was done using a second order polynomial transformation; photographs with fewer than six control points were rectified using a first order polynomial transformation. Each of the georeferenced photographs was rectified by resampling to a cell size of 0.5 m using bilinear interpolation within the Georeferencing Toolbar in ArcGIS 9.3 and then clipped to include areas near the channel where the control points had been concentrated. Seamless mosaics, composed of 184 aerial photographs from 1939 and 79 photographs from 1967 were then created from the clipped, rectified images from each period. Lastly, a polygon layer was created to catalog attributes for each of the photographs underlaying the mosaics, including flight date, number of ground control points to spatially register the original photograph, root mean square error associated with the georeferencing, and approximate discharge at the time of the photograph. Mapping Channel Features, Vegetation Density, and Geomorphic Flood PlainAerial photographs from 1939, 1967, and 2005 were used to map geomorphic features within the active channel of each study reach. In the Days Creek, Roseburg, and Garden Valley reaches, geomorphic mapping also was conducted for three additional periods during 1995, 2000, and 2009 to allow further analysis of recent channel change along these more gravel-rich reaches. The resultant digital channel maps form a basis for evaluating systematic changes to channel and bar planform and support the analysis of depositional and erosional volumes. Vegetation density also was mapped within the active channel in order to evaluate changes that may be attributable to channel processes. Mapping of geomorphic features was primarily confined to the active channel, defined as the area typically inundated during annual high flows as determined by the presence of water and flow-modified surfaces (Church, 1988). Features within the active channel were divided into five broad mapping units: (1) the primary, low-flow channel, (2) tributary channels, (3) bars, (4) secondary channel features, and (5) bedrock outcrops. For each period, all features larger than about 300 m2 were digitized at a scale of 1:3,000. To ensure consistency between mapped reaches and periods, an iterative review protocol was developed so that all line work was reviewed and finalized, and then verified by multiple members of the project team. The primary channel of the Umpqua River, as well as the North and South Umpqua Rivers, was mapped by digitizing the wetted perimeter of the channel as depicted in the aerial photographs. For larger tributaries whose mouths were wider than 20 m, the wetted perimeter of the tributary was mapped for a distance of 500 m upstream of its confluence with the Umpqua River. Secondary channel features generally were associated with alluvial features, such as gravel bars and included side channels, backwater sloughs, and disconnected water bodies adjacent to alluvial features. In many locations, water ponded in potholes and fractures within bedrock outcrops, forming shallow, but sometimes large (greater than 300 m2 in area) water bodies that were disconnected from the main channel (fig. 15). In most cases, they were not mapped separately from the surrounding bedrock outcrop. For this study, gravel bars were defined as features greater than 300 m2 in area containing exposed bed-material sediment. This definition encompassed a range of features from thin patches of gravel overlying bedrock to large point bars and lateral bars (fig. 15). Gravel bars were divided into two categories: attached bars (sharing a margin with the flood plain) and medial bars (surrounded by water) following the classification scheme of Church and Jones (1982). No specific identification of sediment size was made during the aerial photograph mapping, although field measurements and observations indicate that in the fluvial reaches, most bars were composed of gravel, but for the Tidal reach, mapped bars were composed primarily of sand and mud. Mapped bars locally included small areas (less than 300 m2) of open water and bedrock outcrops that were not differentiated from the main bar outline. Exposed bedrock is common within the Umpqua River active channel, forming islands and channel-adjacent outcrops, and most of the rapids (figs. 2 and 16). Distinguishing bedrock from sediment in the aerial photographs was difficult in some locations, but the task was aided by bedding and jointing apparent in some outcrops and by their jagged, irregular outline near the water’s edge. When the photograph resolution was insufficient to make a determination of bedrock versus sediment, photographs from other periods were used to assist in interpretation. Many of the bedrock outcrops are partly covered by small (less than 300 m2) patches of sediment or water. Vegetation density was mapped for all alluvial surfaces within the active channel and all bar features were divided according to three broad categories. Surfaces with less than 10 percent vegetative cover were considered “Bare” and typically occurred on lower elevation bar surfaces. Areas with “Moderate” vegetation density had 10–50 percent vegetative cover, whereas surfaces with “Dense” vegetation had greater than 50 percent cover and typically were mapped on high elevation surfaces near the flood plain. We made no distinction or identification of species as part of this mapping. The geomorphic flood plain was mapped to provide a static reference frame from which to consider temporal variation to the active channel. For this study, the geomorphic flood plain was defined as the active channel (as described above) and the flanking geomorphic surfaces formed of recent river deposits. These were mapped at a scale of 1:10,000 on the basis of topography and the extent of flood-plain soils as depicted in the Soil Survey Geographic Database (Natural Resources Conservation Service, no date). Areas within the geomorphic flood plain are considered to be formed during the recent (Holocene epoch) climatic regime and include most Quaternary deposits mapped in Wells and others (2001) and Ma and others (2009). The flood-plain kilometer reference system used to denote locations in this study was developed by digitizing a centerline through the geomorphic flood plain. To evaluate spatial and temporal trends in channel morphology, measurements from the repeat channel mapping were used to calculate several metrics of channel change. Temporal variation in channel length was determined by digitizing centerlines through the main, wetted channel for each period. These lengths allowed computation of sinuosity (calculated by dividing reach-segregated centerline length by the corresponding flood-plain length for that reach). Spatial and temporal patterns in wetted channel width were determined for each period by measuring the main wetted channel orthogonal to the channel centerline at 0.5-km intervals. Reach-aggregated patterns of sediment storage were evaluated by normalizing the cumulative gravel bar areas for each reach, and for each period, by the corresponding 2005 centerline length for that reach. This measure, which we term “specific bar area,” represents the area of gravel bar per unit length of channel and enables comparisons between reaches and periods. Longitudinal trends in gravel storage were assessed by overlaying the gravel bar polygons for each period with the flood-plain transect system and then tracking spatially discrete changes in bar area over time. Uncertainties and Limitations to Planimetric MappingUncertainty and error in this interpretative mapping falls into two main categories: (1) errors related to photograph registration and rectification or (2) errors related to mapping of land-surface features, which are mostly due to the challenges imposed by varying light conditions, river discharge, and photograph sharpness and contrast (Gurnell, 1997; Mount and Louis, 2005; Hughes and others, 2006, Walter and Tullos, 2009). In this study, imprecise registration and rectification of historical aerial photographs from 1939 and 1967 stem from the few high-quality control points that are common to both older photograph sets as well as orthophotographs from 2005. The total root mean square error (RMSE) values of the rectified photographs indicate that horizontal position uncertainties range from 0.5 to 13.2 m, but average 4.5 m for the 1939 photographs and 2.2 m for the 1967 photographs. Because the control points were concentrated near the channel, the error associated with mapped features along channel corridor should be lower than the total RMSE values for the entire photograph. Mapping of channel features was affected by the quality and resolution of the available photographs. Although some photographs had greater amounts of glare, shadows, or other characteristics that locally obscured channel features, the photographs generally were of adequate quality for precise mapping. The main mapping challenge was to discern patches of alluvium from adjacent bedrock, which was particularly difficult for some of the black and white aerial photographs from 1939, 1967, and 1995. Error was also introduced by imprecise line placement, which may conservatively result in horizontal inaccuracies of up to 9 m. However, to minimize errors and increase the overall precision of the interpretive mapping, all line work was verified regularly and repeatedly by other members of the project team. Another consideration in comparing channel maps from different periods is differences in discharge between sets of aerial photographs. Although all photography was acquired during low-flow periods (table 6), small changes in discharge influence the delineation of channel, bar, and bedrock areas, particularly where the channel is wide and relatively shallow. In general, we expect that mapping from aerial photographs with relatively low discharges (such as those from 2000, when discharge ranged from 6 to 16 percent of the mean annual discharge) will produce results biased toward lower water area and greater bar and bedrock areas. By contrast, photographs made during high discharges, such as 1967 when discharge was about similar to the mean annual discharge, will be biased towards greater water area and smaller bar area. The least amount of discharge variability is among the orthophotographs from 1995, 2000, 2005, and 2009 (table 6) when streamflows for most photographs were less than 20 percent of the mean annual discharge, so comparing channel maps from these time periods should minimize uncertainty due to differences in discharge. To partially account for the effects of the different discharges associated with the aerial photographs and the effects of these differences on mapped bar area, we normalized the mapped bar areas for some of the reaches to a common minimum discharge according to:
These relations were developed for the Days Creek, Roseburg, and Garden Valley reaches and had correlation coefficients (r) ranging from 0.55 for the Garden Valley reach to 0.95 for the Days Creek reach (fig. 17). Reach-specific linear regressions were not developed for the Coast Range and North Umpqua reaches because of too few measurements, so the Garden Valley reach regression was applied to the Coast Range reach, whereas the bar areas on the North Umpqua Reach were not normalized. The discharges for 1939 and 1967 photograph sets (“photograph discharges”) are higher than discharges for the 1995–2009 photographs from which the regressions are derived, so measurements from 1939 and 1967 cannot be reliably adjusted. Mapped bar areas for those years, however, would certainly have been larger if the photograph discharges were similar to those of 1995–2009. The normalized values for the Coast Range and Garden Valley reaches are tentative since they are based on the nonsignificant Garden Valley regression (although the regression coefficient is small, so the normalized values are not too different from the measured values). Results of Channel Mapping for Fluvial Reaches of Study AreaComparison of channel maps from 1939 to 2009 for the fluvial reaches of the Umpqua, South Umpqua, and North Umpqua Rivers shows that the main channel along these reaches is predominantly single-thread and that its overall planform has remained stable over the 70-year analysis timeframe. Despite the overall channel stability, the proportion of bedrock and gravel flanking the main channel has varied between reaches and over time, with gravel bars historically being most abundant along the Days Creek and Roseburg reaches and bedrock outcrop predominating along the main stem Umpqua River (figs. 18, 19, and 20). Altogether, the Roseburg and Days Creek reaches had more than twice the area of mapped gravel per unit length of channel (13.6 and 17.6 m2/m, respectively) than the Garden Valley and Coast Range reaches in 2005, where specific bar area was 5 and 5.1 m2/m, respectively (fig. 18). Much of the gravel mapped throughout the study area is stored in large (> 20,000 m2) point bars, whose positions are fixed by valley geometry (for example, Maupin Bar at FPKM 94.5, fig. 7). Bed-material sediment is also stored in medial bars and numerous small (< 2,000 m2) bars (such as those shown in figure 16), but these features formed less than 30 and 6 percent, respectively, of the total bar area in 2005. Like other rivers, reach-average wetted channel width (as measured from channel maps from 2005) increases systematically downstream, from 32 m on the Days Creek reach to 104 m on the Coast Range reach (fig. 18). Near its upstream boundary, the South Umpqua River along the Days Creek reach is a mountain stream with a channel width of about 28 m, but along its length, the channel and flood plain widen, and gravel bars increase in size and frequency (fig. 10). Prominent zones of gravel storage along the Days Creek reach include FPKM 250–257, where several large bars, including Days Creek Bar (FPKM 250.1), are located in the apices of sharp bends as the South Umpqua River winds through the resistant rocks of the Klamath Mountains (figs. 10B, 10C, and 18). Farther downstream, near the boundary of the Days Creek and Roseburg reaches at the confluence of Cow Creek, a series of large bars, including Gazley Bar (FPKM 232, fig. 10) and Lawson Bar (FPKM 230.1, figs. 2G and 9D), have historically been major zones of gravel storage. Other gravel-rich areas of the Roseburg reach are the Myrtle Creek confluence area (FPKM 220–222, encompassing Western Bar and Myrtle Creek Bridge Bar, shown in fig. 16F) and Elk Island (FPKM 180), formed by an overflow channel at a large-amplitude bend (fig. 16D). Although gravel patches less than 2,000 m2 were abundant throughout the Days Creek and Roseburg reaches (accounting for nearly 50 percent of the total number of bars on these reaches), the cumulative area of these features comprised less than 6 percent of the total bar area. These small deposits of gravel typically were mapped in association with bedrock rapids and in narrow strips flanking straight reaches of the channel (for example, Willis Creek Bar, fig. 16E). In contrast, the Coast Range reach is predominantly a bedrock channel; the reach had more than 4 times the area of exposed bedrock than the Roseburg reach in 2005 (26.7 m2/m compared to 6.4 m2/m) and nearly 10 times the amount of bedrock compared to the Days Creek reach, where the specific bedrock area was 3.1 m2/m (fig. 18 and 19). The main area of gravel storage in the Coast Range reach lies along a series of incised meander bends between FPKM 90 and 122 (fig. 20), and includes Maupin Bar (FPKM 94.5), the largest bar in the study area above the head of tide (152,270 m2, fig. 7) as well as Mary’s Island (FPKM 122), and the densely forested Myrtle Island (FPKM 125, fig. 7C). Elsewhere, bedrock rapids, locally mantled with a thin veneer of gravel, such as those at Elkton Elementary School and Hutchison Wayside (figs. 16A, 16B, and 19) are common. Many reaches have little or no mappable gravel, including several 5- to 10-km-long sections of the Coast Range reach (fig. 20). Bunch Bar at FPKM 62.5 is the last prominent gravel bar before reaching the expansive fine-grained bars of the lower Tidal reach downstream of FPKM 15. The Garden Valley reach spans the short distance between the confluence of the North Umpqua and South Umpqua Rivers and the Coast Range reach. This reach had only 5 m2/m of gravel along the channel forming 12 mappable gravel bars in 2005 (figs. 18 and 20), the largest of which was Cleveland Rapids Bar (19,900 m2) at FPKM 164.7. Along the Garden Valley reach, the primary low-flow channel occupies most of the active channel area, although bedrock outcrops are common (fig. 19). In 2005, the active channel of the North Umpqua reach resembled the Coast Range reach, both in terms of bar area (6.7 m2/m) and bedrock area (25.8 m2/m), although the wetted channel is much narrower on the North Umpqua reach (reach average width was 72 m) (figs. 11 and 18). Like the Coast Range reach, there are only a few large, gravel bars in the North Umpqua reach, such as those at Whistlers Bend (NUFPKM 33.5, fig. 11B). Similar to the Umpqua River downstream of the confluence, the North Umpqua River channel primarily consists of a series of bedrock rapids, locally mantled with small gravel patches. The most evident temporal changes in active channel conditions for all five fluvial reaches between 1939 and 2005 are the large net reduction in bar area. Between 1939 and 2005, the total bar area decreased 29 percent from 4.22 to 2.87 km2 (figs. 18 and 20). However, the temporal trend of decreasing bar size has not been monotonic; total bar area above the head of tide increased 11 percent between 1939 and 1967, and aerial photographs from 1967 show substantial deposition along nearly all bars in the study area. This increase in bar area, however, was more than compensated by a 39-percent decrease in bar area between 1967 and 2005 (fig. 18). These changes in bar area resulted from various transformations within the flood plain and channel system (fig. 21). Areas of new bars resulted primarily from scouring and covering pre-existing flood-plain surfaces with fresh gravel deposits and the growth and formation of gravel bars into areas formerly covered by water (fig. 21). Only small areas of bedrock were subsequently covered by gravel to form new areas of bars (fig. 21). Areas of lost gravel bars chiefly became water, especially during the 1939–67 period, but many bar areas were evidently scoured to bare bedrock outcrops, especially in the 1967–2005 period (fig. 21). Other overall findings for the five fluvial reaches are that (1) centerline length along most reaches has remained very stable, with little temporal variation in sinuosity, and (2) channel width has varied only slightly, with no apparent systematic trends except that wetted width for all reaches was greatest in 1967 (when the flow at the time of the aerial photographs was significantly greater) (fig. 18). Inspection of individual photograph sets shows that despite similar overall trajectories, each of the reaches has displayed a unique set of transformations during the 70-year analysis interval. Historical changes to bar and channel morphology have been greatest along the gravel-rich sections of the Roseburg and Days Creek reaches, where large and closely spaced gravel bars provide more opportunities for adjustments to channel and bar morphology than the primarily bedrock‑flanked reaches of the main stem Umpqua River. On these upper reaches, many gravel bars in 1939 had overflow channels and scoured patches of bare gravel flanked by areas with mature shrubs (such as Umpqua Sand and Gravel Bar, FPKM 171.4, fig. 22B). Aerial photographs from 1967 show that many of these partially vegetated 1939 bars, along with their adjacent flood-plain surfaces, had been substantially scoured and stripped of vegetation (fig. 22B). New bars also formed along the channel between 1939 and 1967; approximately 15 percent of new bars in the Roseburg and Days Creek reaches had been previously mapped as water in the 1939 photographs. In total, between 1939 and 1967, scour and fresh deposition along upper bar surfaces combined with bar growth into former low-flow channel areas (such as that shown at FPKM 251–255, fig. 22C) increased total bar area on the Days Creek reach by 55 percent, from 19.3 to 31.8 m2/m. Despite bar growth in some areas, the Roseburg reach was the only reach in the study reach to show a net decrease in mapped gravel between 1939 and 1967. Many bars present in the 1939 photographs are wholly absent or substantially eroded in the 1967 photographs (such as Umpqua Sand and Gravel Bar, fig. 22B), reducing the specific bar area from 23 to 17.6 m2/m. Between 1967 and 1995, the bar area decreased 28 and 48 percent, respectively, on the Roseburg and Days Creek reaches, primarily as a result of vegetation colonization and consequent mapping as “flood plain” for the 1995 photographs of the high-elevation, freshly scoured surfaces apparent in the 1967 photographs. Also evident was the erosion of many of the bare, low-elevation bars present in the 1967 photographs, transforming those areas to both “water” and “bedrock” (figs. 21 and 22). Between 1995 and 2000, a period spanning the floods of November 1996–January 1997, the area of mapped gravel increased by approximately 30 percent on the Days Creek and Roseburg reaches (figs. 18 and 20) as low-elevation bars were created and enlarged (figs. 23E and F). In most places, the high-elevation surfaces that previously appeared bare and floodswept in the 1967 photographs, but were colonized with vegetation by 1995, did not show obvious signs of erosion during the period 1995–2000, except where high flows had scoured overflow channels (such as those at Days Creek Bar, FPKM 250, fig. 22C). During the low-flow period of 2000–2005 (Bumbaco and Mote, 2010), bar area decreased from 12 and 19 percent, respectively, on Days Creek and Roseburg reaches (figs. 18 and 20). This decrease was mainly by erosion of low-elevation bars present in the 2000 photographs, but absent (replaced by water) in the 2005 photographs. Comparison of the 2005 and 2009 photographs shows little net change in bar area, and channel maps from both times depict similar channel conditions (fig. 18). Channel change on the Coast Range, Garden Valley, and North Umpqua reaches followed similar trends as the Days Creek and Roseburg reaches, but with several distinctions. Despite local areas where bars were stripped to bedrock (such as Mary’s Island at FPKM 121.3, fig. 22A), bar area on the Coast Range reach remained similar between 1939 and 1967, whereas bar area increased 51 percent in the North Umpqua reach during the same period (fig. 18). Many of these newly formed 1967 bars were replaced by areas of bedrock by 2005, causing an 11-fold increase in near-channel bedrock between 1967 and 2005 along the North Umpqua reach. Similarly, bedrock area within the Coast Range reach increased 124 percent (figs. 18 and 21). During the same period, bar area decreased 59 percent from 16.5 to 6.7 m2/m on the North Umpqua reach, and 32 percent from 7.6 to 5.1 m2/m on the Coast Range reach (fig. 18). Trends in bar area on the Garden Valley reach most closely follow that of the Days Creek reach, but the overall magnitude of change during each time period is less than for the more gravel-rich South Umpqua reaches (fig. 18). Like other reaches, bar area on the Garden Valley reach was greatest in 1967, increasing 58 percent between 1939 and 1967, but then decreasing 40 percent between 1967 and 1995, primarily as newly formed bars were eroded to bedrock (figs. 18 and 21). Bar area on the Garden Valley reach remained about stable from 1995 to 2000, then decreased another 40 percent from 2000 to 2005 and showed little change from 2005 to 2009 (figs. 18 and 21). Temporal and spatial patterns of historical channel change along the Umpqua River study area probably result from channel response to varying magnitude floods and possibly dam construction, although differences in discharge at the time of the photographs also affect the map patterns. For all fluvial study reaches except the Roseburg reach, mapped gravel bar area was greatest in 1967 (fig. 18) despite the higher flows in the 1967 photographs, which would be expected to cover many low bars. The large area of 1967 bars is likely the result of erosion and redeposition associated with the large flood of December 1964, which had a recurrence interval of approximately 100 years in most places in the study area (fig. 5). Similarly, bar area probably increased in the Roseburg reach between 1939 and 1967, but it was not evident because of the much higher flow in this reach at the time of the 1967 photographs (fig. 18; table 6). Throughout the study area, decreasing gravel-bar area between 1967 and 1995 probably was due to a combination of (1) vegetation colonization and fine sediment accumulation along floodswept areas from the December 1964 flood and (2) erosion of low-elevation bars (fig. 21). Minor increases in bar area from 1995 to 2000 on the Roseburg, Days Creek, and Garden Valley reaches probably are attributable to (1) the floods of 1996–97 and (2) the low range of discharges depicted in the aerial photographs from 2000, which biases the channel maps from 2000 toward high bar areas (fig. 18, table 6). When adjusted for flow, the increase in bar area within the Days Creek and Roseburg reaches is only 2–7 percent (fig. 18). Because peak discharges of the 1996–97 floods on the South Umpqua River were 23–39 percent smaller than the December 1964 event (fig. 5, table 1), the 1996–97 floods mainly modified and created low-elevation bars and did not cause widespread erosion like that associated with the December 1964 flood (figs. 23E and 23F). Decreases in bar area during the low-flow period of 2000–2005 are likely also due in part to the low discharge of the 2000 photos, but also to erosion because the adjusted values of bar area are also lower in 2005 for all study reaches (fig. 18; table 6). Although a December 2005 flood had a similar peak discharge as that of December 1996, bar areas did not change substantially during this period. Evidence for the December 2005 flood is mostly from bare gravel bars present in both the 2005 and 2009 photographs, where the 2009 photographs show recently scoured surfaces and overflow channels (fig. 23). One possible explanation for the difference in channel response between the 1995–2000 and 2005–2009 periods is that although the 1996 and December 2005 floods had similar peak discharge, water year (WY) 1996 had three flows exceeding the 2-year flood discharge of 1,293 m3/s (as measured at the Brockway USGS streamflow gage), whereas the December 31, 2005, flood was the only one to exceed this value during WY 2006. Like other reaches, the North Umpqua River had a substantial net loss of bar area during 1939–2005, especially between 1967 and 2005, when mapped gravel deposits diminished by nearly 60 percent (fig. 18). This decrease, as well as the associated 115 percent increase in exposed bedrock observed on the North Umpqua reach between 1967 and 2005, probably was at least partly because of construction of hydropower dams in 1952–55, which trap bed-material sediment from 32 percent of the North Umpqua River basin. Although the difference in discharge at the time of the two sets of photographs may account for some of the difference in bar and bedrock area, inspection of individual bar polygons from 1967 and 2005 shows that 49 percent of the bar area from 1967 for the North Umpqua reach was scoured to bedrock by 2005. Similar transformation of gravel bars to bedrock areas during this period downstream of the confluence of the North Umpqua and South Umpqua Rivers in the Garden Valley and Coast Range reaches may indicate that diminished sediment supply for the North Umpqua River has decreased bar area in these downstream reaches as well. Historical patterns of bar evolution also indicate that small and thin patches of gravel deposited along bedrock rapids were often transient zones of bed-material storage, whereas larger bars, which generally formed at large bends in the valley bottom, provide longer term storage for bed‑material sediment. Unlike the smaller gravel patches, the locations and approximate areas of larger bars have persisted for the length of the photographic record (fig. 20), even though the upper bar surfaces were scoured and subsequently revegetated following the flood of December 1964, and low‑elevation bar margins increased and contracted in response to the 1996–97 floods and intervening low-flow periods. Results of Vegetation Density Mapping for Fluvial ReachesRepeat mapping of vegetation density on gravel bars reveals patterns of disturbance and recovery that primarily were caused by large floods, in particular the large flood of December 1964. Vegetation density maps created for the Days Creek, Roseburg, and Garden Valley reaches from 1995, 2000, 2005, and 2009 show that floods in 1996–97 and 2005 also influenced vegetation density on gravel bars, although these smaller floods had less effect than the December 1964 flood (fig. 24). In 1939, about 75 percent of the total bar area along the fluvial reaches of the Umpqua, South Umpqua, and North Umpqua Rivers was covered in moderate to dense vegetation. Aerial photographs from this period show that the dominant vegetation in this time period were grasses, with woody shrubs scattered over entire bar surfaces but becoming increasingly dense and accompanied by mature trees along the upper bar surfaces (for example, Days Creek Bar, FPKM 250, fig. 22C). By 1967, the area of bare gravel had increased 53–234 percent following the December 1964 flood, which scoured vegetated surfaces and created new bars (figs. 24 and 25). The 1964 flood also apparently carved overflow channels through relic floodplain-swales, causing remnant patches of floodswept, vegetated flood plain to be incorporated into the active channel. These bare surfaces were later colonized by vegetation or eroded, causing the area of bare gravel to decrease by 40–70 percent from 1967 to 2005 (figs. 24 and 25), as exemplified by Days Creek Bar (fig. 22C). Between 1967 and 1995, the area of bare gravel decreased as (1) vegetation colonized the floodplain and upper bar surfaces scoured by the 1964 flood, and (2) fluvial erosion trimmed the bare, low-elevation bars. The floods of November 1996 to January 1997 increased the area of bare and moderately vegetated bars, as some densely vegetated areas were scoured and new bars were created. The Roseburg, Days Creek, and Garden Valley reaches show substantial (>70 percent) increases in the area of bare gravel from 1995 to 2000 in conjunction with decreases of about 20–30 percent in the densely vegetated bars. Between 2000 and 2009, total bar area on the Days Creek and Garden Valley reaches remained similar, but the area of bare and moderately vegetated bars fluctuated as vegetation colonized surfaces flooded during winter of 1996–97, and was later scoured (presumably) by the flood of December 2005. Although the bare bars on the Roseburg reach experienced a similar overall disturbance and recovery pattern from 2000 to 2009, the magnitude of fluctuation on this reach was much less than for other reaches, with the area of bare gravel remaining relatively high, even during the relatively dry period of 2000–2005 (fig. 24). Oblique Photograph MatchingRepeat long-term ground-based photography is useful for qualitatively evaluating historical changes to landscapes and vegetation because it provides a direct comparison of ground conditions, commonly extending back several decades prior to earliest aerial photography (for example, Skovlin and others, 2001; Webb and others, 2007). Here, we matched six historical photographs of the Umpqua River from the early 20th century for the dual objectives of (1) identifying areas of obvious change in channel conditions, particularly changes in bed-material storage and (2) evaluating changes in riparian vegetation. Scanned historical photographs of the South Umpqua and North Umpqua Rivers were acquired from the Douglas County Museum. The locations from which these photographs were taken were determined from notes that accompanied the photographs, along with modern aerial photography and topographic maps (appendix A). During summer 2009, the historical photographs were approximately matched, and the resultant oblique images were cropped and resized to approximate the field of view of the historical photographs. In some instances, the original photograph site could not be reoccupied precisely because of vegetation growth, structure, or landform changes, but the approximate match still qualitatively indicates changes to channel and vegetation conditions. Repeat land-based photographs of the South Umpqua and North Umpqua Rivers show little variation in channel planform or bar characteristics over the past 70+ years at the three sites (fig. 26A). At Myrtle Creek Bridge (FPKM 219.9), the bar along the left bank appears very similar in 1925 and 2009, as both photographs show a thin mantle of gravel overlying bedrock, but with perhaps slightly more gravel evident in the 2009 photograph (fig. 26B). The confluence of the North Umpqua and South Umpqua Rivers near Singleton Park (FPKM 168.4) also changed little between 1925 and 2009, as the bar along the right bank of the main stem Umpqua River has similar size, shape, and texture in both photographs (fig. 26). Likewise, the photographs from 1925 and 2009 at Booth Bridge on the North Umpqua River show negligible change in bed-material characteristics, as both photographs show thin patches of gravel overlying channel-adjacent bedrock (fig. 26C). More noticeable is the overall increase in riparian vegetation (fig. 27). Changes in riparian vegetation were most apparent along the South Umpqua River, where vegetation encroachment was evident at all photograph matching sites. At the Winston site, the vegetation in the photograph from 1929 primarily consists of low grass and sparse woody shrubs, but in 2009, the site was densely vegetated, such that trees and shrubs obscured the field of view from the historical photograph location (fig. 27A). At the Rice Creek covered bridge site, the density and character of the bank and flood-plain vegetation remained similar from 1929 to 2009, but herbaceous vegetation had established along the low-elevation bedrock outcrop within the active channel (fig. 27B). Repeat photographs of Whistler’s Bend (NUFPKM 33.1) on the North Umpqua River show that trees along the stream corridor had matured and become denser during the 20th century (fig. 27C). These widespread increases in vegetation density in part reflect decreasing flood magnitude (fig. 5), and possibly less direct disturbance of riparian zones during the last few decades. Comparison of 20th Century Channel Maps with 1854 General Land Office SurveysThe earliest comprehensive maps of the Umpqua River system were produced by the General Land Office (GLO) in the 1850s as the GLO surveyed public lands in Oregon (as summarized by Atwood, 2008). Although the primary purpose of this mapping was to establish the Township, Range, and Section lines of the Public Land Survey System (PLSS), some of the maps include detailed surveys of the bank lines of larger rivers (a surveying process called meandering [Atwood, 2008]). Although gravel bars and other river features were not systematically mapped as part of the basic PLSS or meander surveys, some GLO maps include prominent gravel bars, rapids, or other local features that can be compared against modern channel maps. Additionally, the survey notes accompanying the maps include descriptions of channel features that are useful for determining changes to channel character over time. Because differences in map quality and detail preclude systematic comparison of the GLO maps with 20th century maps, the GLO maps and survey notes were used to assess general changes in channel conditions. Scanned, digital GLO surveys and notes were acquired from the Bureau of Land Management (2009) (table 7). Each map was georeferenced by matching section lines depicted on the maps with those from a recent PLSS coverage (Bureau of Land Management and U.S. Forest Service, 2009). Using meander surveys available for the Tidal, Coast Range, Garden Valley, North Umpqua reaches, as well as a part of the Roseburg reach, meandered bank lines were digitized to assess changes in planform. All bars depicted in the meandered and nonmeandered surveys were digitized to evaluate potential changes in bar size and position. Additionally, for each survey used in this study, the accompanying notes were reviewed, and key descriptions of channel characteristics were cataloged for comparison against more recent observations. Comparison of the 1850s era GLO maps with the 1939 channel map reveals little detectable change in channel position along the meandered reaches. Although the 1850s channel commonly is depicted as wider than the 1939 channel, this is the likely consequence of the GLO mapping being conducted during high-flow winter months (Bureau of Land Management, 2009). Additionally, few gravel bars are depicted in the GLO maps unless they are islands (medial gravel bars) within the channel. This in part reflects GLO mapping protocols focusing on surveying bank lines separating flood-plain surfaces from water and active channel features such as bars and bedrock outcrops. Consequently, the GLO maps, because of the high flows at the time of the survey and the mapping protocols, do not provide an ideal source for comparison of gravel-bar area with more recent aerial photographs. For example, although GLO channel maps from 1853 to 1855 for the North Umpqua reach show no bars attached to flood plains, it is unlikely that attached bars were absent, as 22 medial bars were mapped in 1853–1855, resulting in specific bar area of 3.8 m2/m (fig. 28). In comparison, the specific area of medial bars was 5.9 m2/m in 1939 when the total bar area for this reach was 10.9 m2/m (figs. 16 and 28). Nevertheless, along much of the North Umpqua reach, medial bars shown by the 1853–55 maps are at or near the same places as those in the 1939 aerial photographs, although their size and shape have changed (fig. 28). Meander survey notes accompanying the GLO maps describe bank height, bank composition, riparian vegetation, channel width, and bar characteristics along the channel. These historical observations generally match our channel mapping and field observations (appendix B). For example, on the North Umpqua reach, the banks were commonly described as “gravelly,” especially where channel maps from 1939 onward show flood-plain-attached bars. Very few bars were mapped in the Coast Range reach, with the notable exceptions of Myrtle Island (FPKM 126), a large, forested bar present in subsequent channel maps, and a large delta at the mouth of Elk Creek (FPKM 72), which was not present in later aerial photographs or maps. Although bars are not specifically mapped on the GLO maps of the Roseburg and Days Creek reaches, survey notes present at many of the major bars mapped from the 1939 aerial photographs indicate that these areas have been sites of gravel deposition since at least the mid-19th century. Near the location of Umpqua Sand and Gravel Bar (FPKM 171.4), the survey notes state that the bank is “12 ft high and brushy,” which together with the GLO meandered bank lines indicates that the large, semistable bar vegetated with grasses and shrubs present in the 1939 aerial photographs was probably also present in the 1850s (fig. 22B). Similarly, at Little Valley Bar (FPKM 189.8), the 1853 survey notes describe a “low and sandy” bank, closely matching the aerial photographs from 1939 onward showing this area as a bare, low-elevation, active gravel bar. In addition, two prominent secondary channels on the Days Creek reach that are adjacent to large, active gravel bars are depicted GLO maps as “Dry Bed of River” (FPKMs 250–252), indicating these areas have likely been zones of dynamic gravel deposition for more than a century. Vertical Changes in Channel Morphology along Fluvial ReachesAlthough aerial photographs and historical maps show that channel planform along much of the Umpqua River study area has remained stable for over a century, we also assessed vertical changes in the position of the channel bed. Several survey sources were used to assess vertical changes to the longitudinal profile of the Umpqua and South Umpqua Rivers: (1) USGS Plan and Profile surveys completed in 1914 for parts of the Coast Range, Garden Valley, and Days Creek reaches (Marshall 1915; table 7), (2) thalweg elevation surveys conducted by the USGS for a series of flood studies encompassing all study reaches except for the Days Creek reach upstream of FPKM 240 (table 7; Oster, 1972; 1973), and (3) Light Detection and Ranging (LIDAR) topography acquired in 2009, for the Coast Range reach between FPKM 83 and 155 (table 7; Watershed Sciences, 2009). Additional detailed information on local changes to the channel bed was derived from repeat surveys of instream gravel mining sites and streamflow measurements from USGS streamflow-gaging stations located at Elkton (FPKM 84.7), Brockway (FPKM 195.3), and Winchester (NUFPKM 2.4) (fig. 1). Repeat Longitudinal Profile SurveysSome of the earliest surveys that extend above the head of tide and have broad spatial coverage were conducted by the USGS in 1914 to identify areas for hydropower development, and by the Corps of Engineers in the late 19th century to improve navigation between Reedsport and Roseburg. Because of their availability and extensive coverage, the USGS Plan and Profile surveys were used to document the historical longitudinal profile of the main stem Umpqua River along the Coast Range reach. These early surveys depict the outlines of riverbanks, islands, and rapids and include contoured elevation data for the water surface and banks, in which the river-surface contour interval is 1.52 m (5 ft) and bank contour interval is 7.62 m (25 ft). The USGS maps were scanned and georeferenced to the Bureau of Land Management and U.S. Forest Service (2009) Public Land Survey coverage using section corners and rectified using a first order polynomial transformation that yielded RMSE values of 10–13 m. Water-surface elevations, referenced to mean sea level, were digitized directly from the maps and converted to meters (NAVD 88 datum) by assuming that the vertical datum in the 1914 maps was approximately similar to the NGVD 1929 datum used in subsequent Plan and Profile maps from 1929. Because there has been little change in the overall channel position between 1914 and 2005, the river kilometer system based on the 2005 channel centerline was used directly to determine the appropriate linear distance for each water-surface elevation. The most complete set of elevation data available for the study area was derived from channel surveys conducted by the USGS in support of flood studies in the early 1970s (Oster, 1972; 1973). These surveys extend from FPKM 0 to FPKM 240 and include channel thalweg elevations (NGVD 29 datum) at cross sections located approximately 300 m apart, referenced to an arbitrary linear system developed for the flood studies. The thalweg survey was aligned with the 2005 centerline reference frame by matching prominent landmarks and tributary junctions as noted in the 1970s surveys. Thalweg elevations were uniformly shifted by 2 m to approximate the adjustment to the NAVD 88 datum, which can range from 1.5 to 2 m for the western United States (Zilkoski and others, 1992). LIDAR topography acquired in 2009 (table 7), was available for a part of the Coast Range reach from FPKMs 83 to 155 and was used to extract water-surface elevations at 50-m increments along the 2005 centerline. Although the 1970s thalweg elevations extend as far upstream as FPKM 240, the 1914 Plan and Profile data extend only to FPKM 180 while the LIDAR data encompasses only FPKM 83–155. In total, the two profile surveys overlap for only the Coast Range, Garden Valley, and lowermost part of the Roseburg reaches, and all three datasets overlap for only the 72-km length of the LIDAR survey. Comparison of longitudinal profiles from 1914, the 1970s, and 2009 along the Coast Range and Garden Valley reaches shows little variation over time (fig. 29). The mean difference between the 1914 and 2009 water-surface profiles is –0.09 ± 0.34 m for 45 locations where 1914 water-surface contours can be directly compared with the 2009 water-surface elevation from the LIDAR survey. Considering the many sources of error and uncertainty that arise when comparing historical longitudinal profile surveys, including uncertainties associated with matching the vertical datums, registration errors, and likely errors in the surveys themselves (more completely described by Magirl and others, 2005), this mean difference is probably not meaningful. The greatest discrepancy between the water-surface profiles occurs at a bedrock rapid downstream of Bullock Bridge (FPKM 119.3), where the 1914 water surface was 1 m higher than the 2009 water surface (fig. 29), which could possibly reflect channel modification due to historical navigation improvements. Considering the close match between the historical and modern river profile data, the main conclusion from these comparisons is that there has been little systematic channel incision or aggradation, at least between FPKM 75 and FPKM 185 (encompassing the lower part of the Roseburg reach, and much of the Garden Valley and Coast Range reaches). This result is consistent with the extensive bedrock in the channel, which exerts overall control over the channel and water-surface profile. Specific Gage AnalysisFollowing the approach of Klingeman (1973) and Smelser and Schmidt (1998), we conducted a specific gage analysis for three USGS streamflow-gaging stations (fig. 30): the main stem Umpqua River at Elkton (14321000), the South Umpqua River near Brockway (14312000), and the North Umpqua River at Winchester (14319500). The specific gage analysis allows detection of changes in streambed elevation by assessing changes in water elevation (stage) through time for a set of discharge values. At USGS streamflow-gaging stations, discharge is related to stage by a stage–discharge rating curve, which is based on coupled stage and discharge measurements taken at a range of streamflows. If channel conditions change substantially (as shown by consistent offsets of newer measurements from established rating curves), or if a station is moved, a new rating curve will be developed. The specific gage analysis evaluates trends in downstream hydraulic control as indicated by the sequence of rating curves; hydraulic control is, in turn, correlated to bed elevation. For situations where channel width and roughness remain stable (which aerial photographs indicate is the case for the three Umpqua River sites), the sequence of stages for a given discharge directly relates to changes in bed elevation. Although the Umpqua River specific gage analysis is relatively straightforward due to the stability imposed by the bedrock channel, the gaging stations at each of the three analysis sites were moved at least once, requiring multiple datum shifts. Because the purpose of this task was to detect potentially small changes in bed elevation, we assessed changes in flow stage for low to moderate flows (14–283 m3/s), which are more sensitive to minor adjustments in bed elevation and are less likely to be influenced by temporal changes in bank vegetation or changes in bank shape. The specific gage analysis (fig. 30) shows that all three stations have had little change in stage associated with low flows over the period for which flow data are available. At the Umpqua River station near Elkton (fig. 30A), the gage location has changed four times over the period 1906–2008, with stages changing very little while at each location. For 1906–57, stage for each discharge varied by less than 0.12 m, whereas during 1957–72, stage at 14 m3/s decreased by approximately 0.2 m. For 1972–2008, stage for all discharges changed less than 0.15 m, indicating negligible change in bed elevation. The gage analysis for the North Umpqua River at Winchester spans 1924–30 and 1955–2008 (fig. 30C). For all discharges, and across both periods, measured stage changes are small, with the largest and most systematic being the decrease of 0.1 to 0.15 m associated with the 28 and 57 m3/s flow rating curves for 1955–2008. The South Umpqua River gaging station near Brockway provides data for 1906–12, 1924–28, and 1942–2008 (fig. 30B). For all three periods, the Brockway gage also shows only small changes in stage for the discharges used in this analysis. For 1942–2008, stage has lowered between 0.05 and 0.1 m for all discharges used in the analysis. Bar Evolution and Rates of Deposition at Mined Sites from Repeat SurveysSurvey data for 2001–09 for six instream gravel-mining sites in the Roseburg and Days Creek reaches were used to calculate recruitment rates and to examine the evolution of individual bars as they responded to gravel extraction and various magnitude flood events. Although the South Umpqua River mining surveys reviewed in this study (table 8) do not account for all mining sites with either current or expired permits in the basin, these six sites are the ones with the most comprehensive survey records. All surveys used in this study were provided by the gravel operators and were conducted as a condition of permitted aggregate removal. During years of mining, the gravel bars generally were surveyed once in the midsummer prior to extraction to determine erosion or deposition during the previous winter, and then subsequent to mining (typically late summer or early fall) to document extraction volumes. From these surveys, the surveyors report “cut” and “fill” volumes in cubic yards. “Cut” volumes account for both erosion and extraction, although the survey notes and conditions generally provide interpretation of whether these volumes reflect deposit mining or erosion (IE Engineering, written commun., 2008; Joy Smith, Umpqua Sand and Gravel, written commun., 2010; Mike Flewelling, Knife River Inc., written commun., 2010). Volumes were converted to mass by assuming a bulk density of 2.1 metric tons/m3 on the basis of data collected by Milhous (2001) as presented in Bunte and Abt (2001). Pairs of surveys at three sites conducted from 2001 to 2004 report cut and fill volumes that include mining, erosion, and deposition, as well as the net change in bar volume. Annual surveys at the other three sites during 2001–04, and all sites during 2005–09, when there was no mining, provide only the net annual volumetric change. Because the surveys were conducted during the low-flow season, volumetric changes detected at each bar are assumed to have occurred during the previous high-flow season. For example, survey data from the summer of 2008 is used to judge bar growth occurring during WY 2008. Survey information for the six sites of historical gravel bar mining on the South Umpqua River show that mined volumes in 2001–04 for three actively mined sites (Umpqua Sand and Gravel Bar, Weigle Bar, and Days Creek Bar) ranged from 610 to 21,500 metric tons. The three other sites (Shady Bar, Little Valley Bar, and Gazley East Bar) had no mining during this period. These records and communication with individual operators indicate that none of the analyzed bars were mined after 2004. Since then, each of the six bars has accumulated gravel, with four of the six bars now showing positive balances relative to first available surveys (fig. 31). Volumetric changes to the mined sites are most easily assessed for 2004–09, during which there was no mining and all topographic changes to the bars resulted from fluvial erosion and deposition. For this period, the deposition at individual bars ranged from 80 metric tons at Days Creek Bar during the low-flow year of 2004–05 to 30,600 metric tons at Shady Bar during the relatively high flows of 2005–06 (table 8). Losses due to erosion have ranged from 10,960 metric tons at the Umpqua Sand and Gravel Bar during the low-flow period of 2000–01 to 350 metric tons of erosion at Weigle Bar during 2003–04 (table 8). There can also be considerable variation between sites during a single year. For example, during the winter of 2004–05, Gazley East Bar (FPKM 232) lost 9,240 metric tons of gravel to erosion, while Little Valley Bar (FPKM 189.7) and Weigle Bar (FPKM 211) gained 2,610 and 2,450 metric tons of bed material, respectively (fig. 31; table 8). Nearly all surveyed bars had volumes that substantially increased (aggrading as much as 0.5 m) during the winter of 2005–06 in conjunction with high flows, including the December 31, 2005, peak of 2,164 m3/s, the highest peak flow on the South Umpqua River since December 1996 (fig. 31). Deposition volumes for individual bars for the winter of 2005–06 ranged from 8,370 metric tons at Weigle Bar to 30,600 metric tons at Shady Bar. During more typical water years such as 2007 (which had a peak flow of 1,302 m3/s on December 26, 2006, similar to the 2-year flood recurrence interval discharge at the nearby USGS streamflow-gaging station at Brockway), net changes ranged from 2,800 metric tons of erosion at Days Creek Bar (FPKM 249.9) to 9,750 metric tons of deposition at Shady Bar. The only bars that clearly have not regained the volume of sediment documented in the first survey are Days Creek Bar at FPKM 250 and Weigle Bar at FPKM 211, both of which had large amounts of gravel removed in 2004 (table 8). The deposition volumes recorded by these surveys give a minimum indication of local bed-material flux rates for flow approaching the bar since the accumulated volume must have been transported from upstream. These volumes are minimum values because some bed material in transport undoubtedly bypassed each site and because the net changes detected by surveys do not completely distinguish the volume eroded from the bar surface from the total deposition volume. Nevertheless, these minimum flux values provide secure evidence of bed‑material transport rates. For example, the surveys at Shady Bar at FPKM 186.2 indicate minimum annual bed-material flux rates of 2,810–30,600 metric tons during WY 2002–08. Additionally, these bar surveys show that the bars primarily increase in size during high-flow years, and that low-flow years, such as 2005, result in either erosion or very little deposition. Although these repeat surveys provide constraints on site-specific bed-material flux rates and spatial and temporal patterns of bar erosion and deposition, the depositional volumes documented by surveys of mined bars cannot be extrapolated to estimate reach-scale depositional volumes for all bars because bar mining almost certainly creates depositional space, which enhances future deposition in comparison to unmodified bars. Planform and Bathymetric Changes in the Tidal ReachChannel and bar morphology in the Umpqua River estuary are substantially different from those in the fluvial reaches. Datasets unique to this reach provide the opportunity to track changes to channel planform and bathymetry over time, and enable assessment of the rate of bed-material replenishment relative to volumes dredged for aggregate as well as for navigation maintenance. Similar to the upstream fluvial reaches, changes to channel planform and bar area on the Tidal reach were evaluated using repeat mapping based on aerial photographs from 1939, 1967, and 2005, but the digitizing protocol and mapping scale were tailored specifically to the Tidal reach. Temporal variation in the bathymetry of the Umpqua River estuary was evaluated through comparison of repeat bathymetric surveys from 1886, 1920, and 1971. Additional information on channel morphology, processes, and sediment transport in the Tidal reach includes cross-section surveys and reports describing bathymetric changes in the area where commercial dredging historically occurred (FPKM 26–30.5) and GLO surveys dating to the 1850s. Mapping of Tidal Reach from Aerial Photographs and General Land Office SurveysThe overall process used to map channel and bar features in the Tidal reach from aerial photography is similar to that described previously for the fluvial reaches, with complete details on the aerial photograph acquisition, rectification, mosaicking, and digitizing methods provided with the geographic information system metadata (find at http://www.geodata.gov). The three main differences between the approach used to map channel features on the Tidal reach and that used on the upstream fluvial reaches were: (1) mapping was conducted at a scale of 1:10,000 instead of 1:3,000 because of the much larger dimensions of channels and bars, (2) for the Tidal reach, the mapping unit “bar” refers to the broad, fine-grained sand bars and mudflats, whereas bars on upstream reaches are primarily gravel, and (3) vegetation cover on Tidal reach bars included riparian shrubs and grasses similar to that observed on upstream bars, but some of the low-elevation bars also had substantial algal cover. Mapping in the Tidal reach also is influenced by the tide level at the time the aerial photographs were acquired. Tide levels in the Umpqua River estuary can vary by as much as 2.6 m, but the mean range is approximately 1.6 m (on the basis of data from the National Oceanic and Atmospheric Administration [2009a]. Although tide level for the 1939, 1967, and 2005 photographs is unknown, the presence of expansive mudflats, which typically are inundated at high tide, indicates that most were acquired at low tide levels. Lastly, the aerial photographs from 1967 exclude the mouth of the river between FPKM 0 and 7. Therefore, although channel maps from 1939 and 2005 encompass the entire Tidal reach, the analysis of bar area, centerline length, and other metrics only include features from FPKM 7 to 40, where all three periods have complete photograph coverage. Early maps and aerial photographs of the Tidal reach show that between Scottsburg (FPKM 40) and its confluence with Smith River (FPKM 15), the Umpqua River gradually widens from 143 to 500 m (as measured from 2005 aerial photographs) as the channel exits the Coast Range and approaches its mouth near Reedsport (FPKM 0) (fig. 6). Between Scottsburg and Brandy Bar (FPKM 27.5), there are only two small gravel bars, but between FPKM 15 and 27 there are 10 bars (fig. 6). These are predominantly forested islands with areas ranging between 30,000 and 50,000 m2. Near its confluence with the Smith River, the Umpqua River widens, creating a broad depositional complex of attached and medial bars including Bolon Island (FPKM 13) and Black’s Island (FPKM 14) (fig. 6). Channel mapping from 1939, 1967, and 2005 aerial photographs show that the overall character of the Tidal reach has remained similar, although individual bars have shifted. The role of navigation improvements also is apparent along the lower 5 km of the channel, where bank protection and jetties have imposed a stable channel planform. Between 1939 and 2005, there was a 21 percent net decrease in the area of mapped bars in the Tidal reach, but uncertainty due to differences in tide level and discharge in the underlying aerial photographs make it difficult to determine if differences in mapped bar areas reflect actual changes in sediment storage (fig. 32). For example, between 1939 and 1967, mapped bar area decreased 32 percent, but the discharge in the 1967 photographs was nearly 8 times greater than that in the 1939 photographs, and the high flows likely obscured many low-elevation bars and biased the channel maps towards small measured bar areas (table 6; fig. 32). Discharge in the 2005 photographs is similar to that in the 1939 photographs, exposing many bars, including the large mudflats downstream of Smith River (fig. 6B) and increasing the total area of mapped bars by 17 percent between 1967 and 2005 (fig. 32). Although the low discharge biases the 2005 channel maps towards increased bar areas, some bars upstream of the Smith River confluence decreased in size during 1939–2005 (such as the medial bars near FPKM 15.8 as depicted in fig. 6B), which could partially explain the 21 percent net decrease in bar area from 1939 to 2005. Comparison of the GLO maps from 1857 to 1858 with 20th century aerial photographs supports the general findings from the repeat channel mapping that channel planform along the Tidal reach has been substantially similar over the 148-year analysis period (fig. 33). However, comparison of the historical and modern maps also shows changes in bar vegetation attributable to development in the Umpqua River estuary. Notes accompanying the General Land Office surveys from 1858 describe Goose, Duck, and Black’s Islands (all situated near the mouth of Smith River) as “[composed of] sand, level marsh with heavy growth of grass” (appendix B), and although aerial photographs from 1939 depict possible grass and other herbaceous vegetation, the dominant vegetation in the 1967 and 2005 photographs is low, light-green vegetation that probably comprises mostly algae and rooted aquatic plants. Snelling’s Island (opposite the mouth of Smith River) had “scattered timber” and “heavy grass” according to the 1858 survey notes, but was developed into an industrial area by 1939. Similarly, the southern part of Bolon Island was “hilly” in 1858, forested in the 1939 photographs, and then developed by the time of the 1967 photographs. Bathymetric Data Used in StudyTo characterize bathymetric changes to the Tidal reach, we compared three historical hydrographic surveys completed by the U.S. Coast and Geodetic Survey in 1886, 1920, and 1971 (National Oceanic and Atmospheric Administration, 2009b). These maps all show soundings spaced at 15- to 50-m intervals extending from the mouth of the Umpqua River to its confluence with the Smith River (FPKM 15). The 1971 elevation data were available as scanned sheets and digital elevation points. The scanned sheets have latitude and longitude lines corresponding to the North American Datum of 1927 (NAD 27) that were used to georeference the maps. The 1920 maps were registered to the georeferenced 1971 survey using survey points common to both maps and NAD 27 coordinates annotated to each map in the 1930s. The 1886 map was registered by matching its latitude and longitude lines to those of the 1920 map. The registered maps were rectified using a first order transformation. Soundings, elevation contours, and bank lines were digitized from the rectified maps. For 1971, soundings were already in digital format and therefore were not digitized as part of this study. The elevation data in the original surveys were referenced to Mean Lower Low Water (MLLW), which we converted to NAVD 88 using VDatum (National Oceanic and Atmospheric Administration, 2009c). On the basis of National Oceanic and Atmospheric Administration (NOAA) charting procedures (Mark Frydrych, National Oceanic and Atmospheric Administration, written commun., December 2009), we assumed that changes in MLLW due to variation in tidal epochs were insignificant. The bank lines bounding the surveyed channel bed were assumed to have an elevation of 1.6 m, which was the Mean Higher High Water elevation used by National Oceanic and Atmospheric Administration (2006) to derive a continuous surface from the 1971 survey. The final network of elevation points and contour lines were used to develop Triangulated Irregular Network (TIN) surfaces of the bathymetry from each period, which were converted to raster format with the TIN to Raster tool in 3D Analyst Toolbox using linear interpolation (fig. 34). Cross sections were then extracted at key locations from the gridded three-dimensional surfaces to evaluate changes to channel geometry over time (fig. 35). Another set of survey data available for the Tidal reach includes cross sections from FPKM 26–30.5 near the site historically dredged by LTM, Inc. These data were obtained by LTM, Inc. and were provided by Lidstone and Associates (written commun., 2008). In addition, a report by CH2M Hill (1971) furnishes soundings of the commercially dredged areas from 1970. Uncertainty and Limitations with Repeat Survey DataThe total uncertainty regarding the bathymetric surfaces created from the survey data of 1886, 1920, and 1971 is a function of the original data and the processing involved with creating digital maps and interpolated surfaces of the bathymetries. Although the accuracy of the maps from 1886 and 1920 is unknown, the process by which the original maps were registered, rectified, and digitized may have introduced horizontal uncertainty on the order of ±15.5 m (based on distances between benchmarks digitized from the surveys versus the corresponding NOAA published benchmark location), but in most places the horizontal uncertainty is much lower, with average values ranging from 1.8 to 4.2 m. The 1971 bathymetric data published by NOAA are described as having horizontal accuracy of 3 m and vertical accuracy of 1 m for depths greater than 20 m and of 0.2 m for depths less than 20 m (National Oceanic and Atmospheric Administration, 2006). Results of Repeat SurveysInspection of the repeat bathymetric data indicates that the Tidal reach is dynamic, with areas of deepening and aggradation, but the overall trend for most time sequences is thalweg deepening. Repeat bathymetric surveys for the lower estuary (FPKM 0–15) shows that thalweg deepening is most prominent downstream of Winchester Bay (FPKM 1) where navigational dredging has resulted in more than 10 m of bed lowering. Substantial deepening is also evident upstream to FPKM 7, where the 1971 thalweg is more than 5 m deeper than the channel bed in 1886 (figs. 34 and 35), although other areas show little net change (figs. 35E and 35F). The large bar complexes, including Steamboat, Bolon, and Black’s Islands, have migrated and changed in extent between 1886 and 1971 (fig. 34) in conjunction with deepening of the thalweg adjacent to these bars (for example, cross section C in fig. 35). Examination of cross sections and reports documenting bathymetric change in the reach historically dredged for aggregate (FPKM 26–30.5) shows considerable variability between cross sections, with some areas becoming shallower over time, whereas other areas show up to 1.4 m of deepening. The overall trend evident in the repeat cross sections supplied by LTM Inc. was that dredged areas were not substantially replenished in subsequent surveys. The repeat bathymetric surveys for the 1971 CH2M Hill analysis showed that excavations in areas not mined for more than 5 years had not been refilled. Based on these limited data, we infer that the supply of bed material entering the Tidal reach is less than the 136,380 m3 average annual rate of commercial dredging (based on extraction volumes from 1949 to 2002 as presented in CH2M Hill [1971] and by Lidstone and Associates, written commun. [2009]). Summary of Channel Morphology and Historical Channel ChangeWithin the fluvial reaches, the North Umpqua, South Umpqua, and main stem Umpqua Rivers are a mixed alluvial and bedrock river system with an active channel composed of bedrock and gravel alluvium. Most of the mapped gravel within these reaches is stored in large bars (greater than 20,000 m2) deposited within large amplitude river and valley bends. Although widely spaced, these large bars account for nearly 60 percent of the total gravel area within the study area (as mapped from aerial photographs from 2005). More numerous gravel “patches” typically are small (less than 2,000 m2) and thin veneers of gravel overlaying and adjacent to bedrock outcrops, particularly at rapids and channel bends (fig. 16). Throughout the 70-year period of available aerial photographs, gravel has been most abundant along the Days Creek and Roseburg reaches where specific bar area was 17.6 and 13.6 m2/m in 2005 (respectively), but, locally, the channel in these reaches flows on bedrock. In contrast, the channels of Coast Range and North Umpqua reaches are dominated by bedrock outcrops and have much lower specific bar areas of 5.1 and 6.7 m2/m in 2005. The Garden Valley reach also has more exposed bedrock than gravel bars, as this short (20-km long) transitional reach between the Coast Range reach and the confluence of the North and South Umpqua Rivers had only 12 gravel bars in 2005 and a specific bar area of 5 m2/m. The relative abundance of gravel along the Roseburg and Days Creek reaches is consistent with relatively large contributions from the Klamath Mountains terrain. The abundant in-channel bedrock and generally close flanking valley walls of the fluvial reaches restrict channel movement, and there are no reaches of extensive lateral channel migration and consequent bar growth. The Roseburg reach has the greatest sinuosity and its planform is likely the most mobile of all fluvial study reaches, but historical channel change primarily has occurred during major floods when minor shifts in local channel position can be accommodated by corresponding changes in adjacent gravel bars (fig. 9C). The general stability and bedrock character of the fluvial reaches is consistent with historical maps and descriptions noting channel position and substrate character as far back as the 1820s. There is no evidence of substantial incision along the fluvial reaches, probably due to the widespread occurrence of bedrock in the channel. The specific gage analysis, however, indicates local channel lowering of approximately 0.1–0.2 m, which is probably reflective of bedrock incision. For most fluvial reaches, total bar area has decreased over the period of historical aerial photograph analysis, although this assessment is confounded by different discharges associated with the photographs and by bar growth evident for most reaches in the 1967 photographs, probably resulting from the 1964 flood. Overall, the total area of mapped gravel in the fluvial reaches decreased 29 percent between 1939 and 2005, but decreases in bar area and associated increase in active-channel bedrock is most evident for the Roseburg, Days Creek, and North Umpqua reaches. The 59-percent decrease in gravel bar area and 115-percent increase in bedrock area since 1967 on the North Umpqua reach is probably, at least in part, due to the 1952–55 construction of hydropower dams upstream of the study reach, which trap bed material from 32 percent of the North Umpqua basin. Long-term variation in climate probably also has contributed to decreases in bar area, as peak flows have declined since the 1950s on the lower North Umpqua River, South Umpqua River, and several tributaries (table 2), which may have contributed to vegetation encroachment on bars and decreased gravel transport. Historical increases in bar area resulted primarily from scouring and fresh deposition on flood-plain surfaces (especially in 1967) and by bar growth into areas formerly inundated by the low-flow channel. Bar erosion primarily has resulted from lateral channel shifting, which trims low-elevation margins of bars and is the main style of channel change during low-flow years. Nearly all study reaches had substantial increases in bar area between 1939 and 1967 resulting from the December 1964 flood, but smaller increases in bar area associated with a series of floods during the winter of 1996–97 are evident in photographs from 1995 to 2000. Overall patterns of bar growth and erosion detected from repeat mapping from aerial photographs are consistent with repeat bar surveys for sites of historical gravel mining in the Days Creek and Roseburg reaches. These surveys, dating from 2001 to 2009, indicate that bars increase in size during high‑flow years, and that local bed-material flux rates may exceed 30,000 metric tons/yr for some locations and years. The Umpqua River in the Tidal reach has a much lower gradient, resulting in large and expansive flanking bars composed primarily of sand and mud, in contrast to the smaller gravel-rich bars in the fluvial reaches. This reach is a drowned Holocene valley for which basinwide sediment delivery has not been sufficient to construct a graded profile to the Pacific Ocean. Historical changes to channel planform in the Tidal reach have predominantly been the shifting boundaries of the large bar complexes near the mouth of Smith River. Additionally, navigational improvements farther downstream and jetty construction at the entrance to the Umpqua River have stabilized the channel planform. Differences in tide level and discharge at the time the aerial photographs were acquired make it difficult to discern historical trends in bar area in the Tidal reach. Repeat bathymetric surveys from 1886, 1920, and 1971 indicate thalweg incision, probably resulting from dredging for aggregate as well as channel deepening for navigation. In some locations, the thalweg in the Tidal reach was more than 10 m deeper in 1971 than in 1886. |
First posted September 29, 2011 For additional information contact: Part or all of this report is presented in Portable Document Format (PDF); the latest version of Adobe Reader or similar software is required to view it. Download the latest version of Adobe Reader, free of charge. |

![]() U.S. Department of the Interior |
U.S. Geological Survey
U.S. Department of the Interior |
U.S. Geological Survey
URL: http://pubsdata.usgs.gov/pubs/sir/2011/5041/section4.html
Page Contact Information: GS Pubs Web Contact
Page Last Modified: Thursday, 10-Jan-2013 20:10:44 EST

 (1)
(1)