


The purpose of these interpretive discussions is to provide a perspective on regional- and national-scale variations in element and mineral distributions in soils and their likely causes. The significant spatial variations shown by most elements and minerals can commonly be attributed to geologic sources in underlying parent materials, but other spatial variations seem clearly related to additional factors such as climate, the age of soils, transported source material, and anthropogenic influences. We attempt to distinguish the influence of these various factors on a regional and national scale. Numerous more local features might similarly be related to these same factors, but these features also have some probability of being an artifact of a random sampling of variable compositions, so that there is some probability of samples with similar compositions occurring in clusters of two or more adjacent sites by chance. Distinguishing such random occurrences from true variability is beyond the scope of the data from which these maps are constructed. Some caution, therefore, is advisable in interpreting the significance of these more local features unless some unique sources or processes can clearly be related to them.
Arsenic (As) is a metalloid, meaning this element has properties between those of a typical metal and nonmetal. It is a well–known poison and its toxic properties have led to its use in pesticides and insecticides. It is also a known carcinogen. Arsenic's toxic properties have made its compounds useful in medicine for the treatment of syphilis, cancer, and psoriasis. Arsenic is also used in the manufacture of semiconductors and pyrotechnics (As sulfide produces a brilliant white light). Arsenic has not been determined to be required for any essential biochemical process in humans. More information about the toxicity of As (or other elements and substances) and its potential negative human health impacts can be found at the Agency for Toxic Substances and Disease Registry (ATSDR) website, or click to download a fact sheet about As.
Arsenic has a strong affinity for sulfur (S) and the most common As mineral is arsenopyrite (FeAsS). In silicate minerals, As can substitute for iron (Fe) and aluminum (Al) to some extent. As a result, As can occur in silicate minerals such as feldspar. Arsenic can also replace phosphorus (P) in phosphate minerals such as apatite (Ca5(PO4,CO3)3(F,OH,Cl)). In soils, As can sorb onto Fe oxides and hydroxides, clay minerals, and organic matter.
The distribution of mineral resource deposits with As as a commodity (major or minor) in the United States, extracted from the U.S. Geological Survey (USGS) Mineral Resource Data System (MRDS) website, can be seen by hovering the mouse here. Statistics and information on the worldwide supply of, demand for, and flow of As–containing materials are available through the USGS National Minerals Information Center (NMIC) website.
The average abundance of As in the upper continental crust is estimated to be about 5.7 milligrams per kilogram (mg/kg) (Hu and Gao, 2008). Among the common rock types, shale contains the highest As with concentrations averaging about 13 mg/kg. Other common sedimentary and igneous rocks have concentrations ranging from 0.5 to 3 mg/kg.
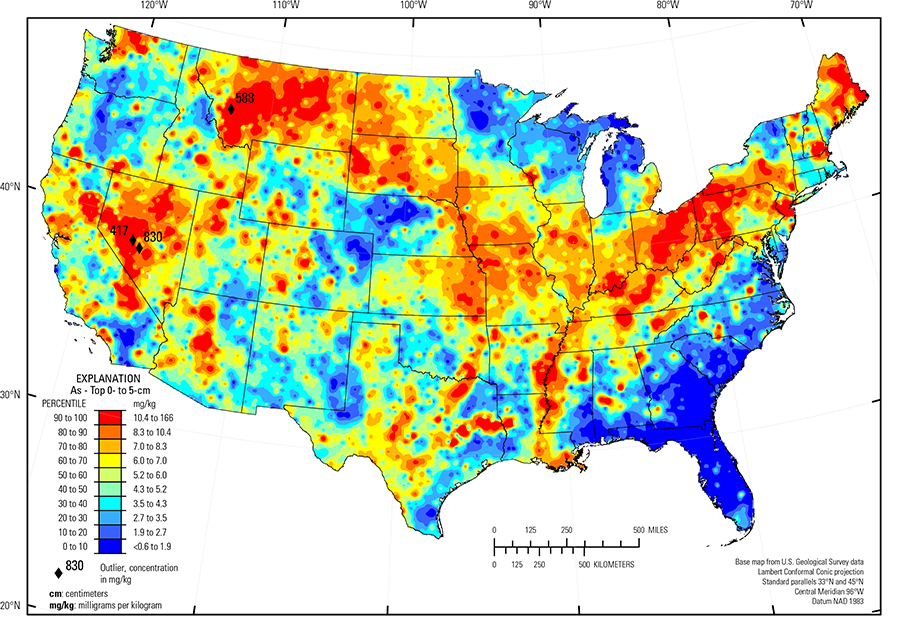
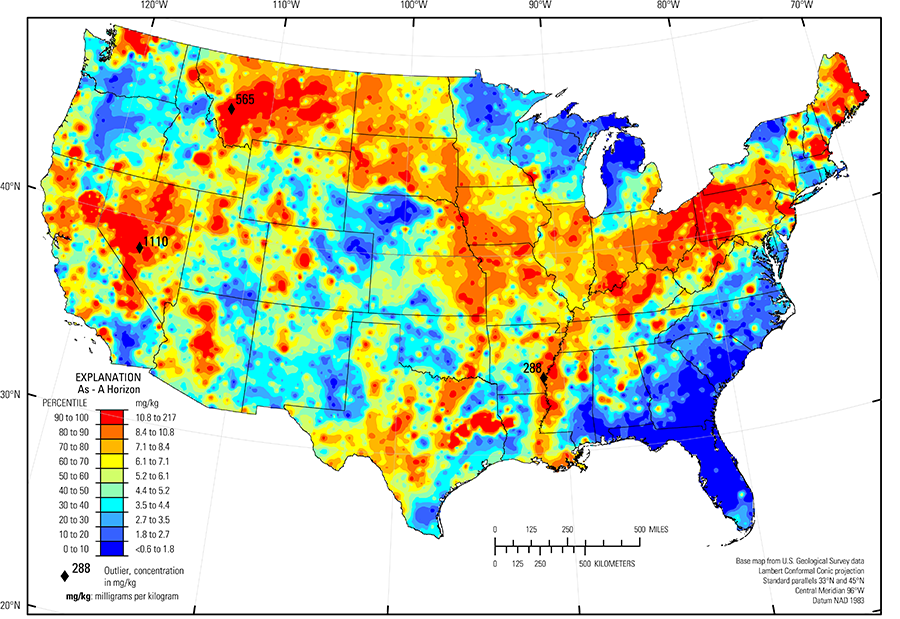
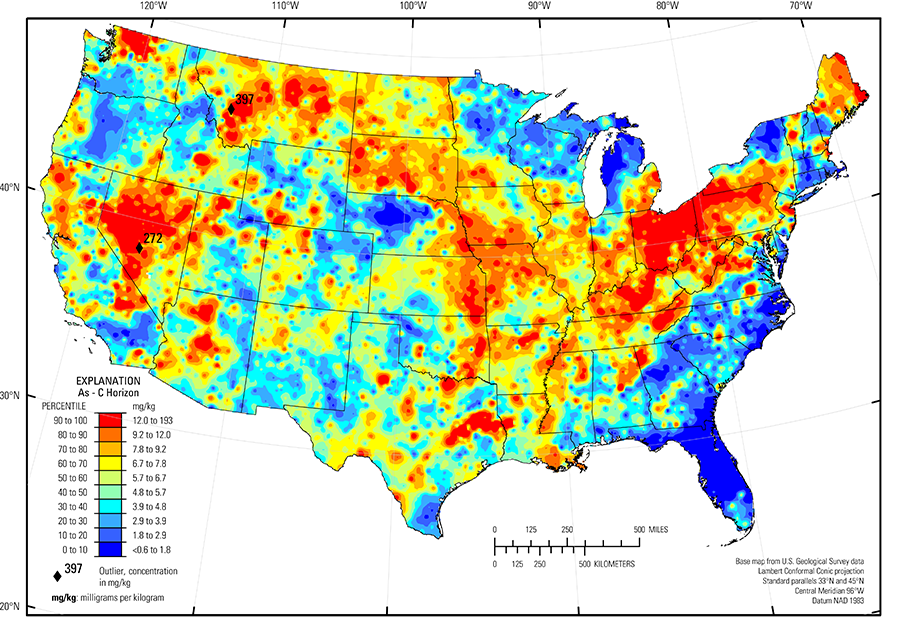
In our data, the median As concentration for the top 0- to 5-cm layer and for the soil A horizon is 5.2 mg/kg. Arsenic in the soil C horizon in only marginally higher with a median concentration of 5.7 mg/kg (see the summary statistics [open in new window]). In general, the geochemical maps for the three sample types are quite similar for As.
The distribution of As in soils of the conterminous United States is primarily controlled by the composition of underlying soil parent materials. Areas of elevated As concentrations include:
- Eastern Montana, North Dakota, South Dakota, eastern Nebraska, eastern Kansas, southern Iowa, northern Missouri, Illinois, Indiana, Ohio, Kentucky, and Pennsylvania where soil parent materials are dominantly marine shale, clayey till, or glacial deposits containing a significant amount of shale
- The Texas Blackland Prairie (USDA, 2006) of north–central Texas, where soil parent materials are chalk, clay, and marl with pyrite nodules common in places;
- Eastern Texas where soil developed on a bedrock unit called the Claiborne Group that consists of marine mudstone with accessory As–bearing pyrite; and
- Western Montana, Nevada, central and northern Arizona, and south–central Colorado where As is present as a constituent of sulfide minerals in areas of historical or current mining activities. Soils in these areas may be formed on mineralized bedrock containing elevated concentrations of As. In areas of extensive mining and mineral processing, it is also possible that there may be a component of As contamination from these activities superimposed on elevated background concentrations.
The Gulf and Atlantic Coastal Plain (Fenneman and Johnson, 1946) is bisected by the Southern Mississippi River Alluvium and the Southern Mississippi Valley Loess (USDA, 2006). Alluvial sediments have deposited in the Mississippi River valley as the river flooded in recent geologic time. When these sediments dried, winds picked up the fine material and deposited it in thick loess sheets, mainly along the east side of the river valley. The youngest loess sheets are about 10,000 years old. A pattern of higher As concentrations in soils developed on these young sediments reflects long–range transport of As–bearing material from the upper part of the Mississippi River drainage basin.
Areas of relatively low As concentrations include:
- Atlantic Coastal Plain (Fenneman and Johnson, 1946) where parent materials are dominantly quartz–rich sedimentary rocks and unconsolidated sediments;
- Nebraska Sand Hills (USDA, 2006) where soil parent materials are quartz– and plagioclase–rich sand dunes and sand sheets;
- Parts of the Southern High Plains (USDA, 2006) of Texas and New Mexico where soil parent materials consist of quartz–rich eolian sands and alluvial sediments;
- Adirondack highlands (Fenneman and Johnson, 1946), northern New York, where parent materials are igneous and metamorphic rocks; and
- Northern and western Michigan where parent materials are comprised of quartz–rich glacial deposits.
Statistics - 0 TO 5 CM
| Number of samples | 4,841 |
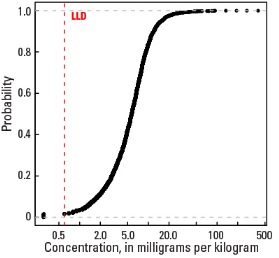
| LLD | 0.6 mg/kg |
| Number below LLD | 56 |
| Minimum | <0.6 mg/kg |
| 5 percentile | 1.4 mg/kg |
| 25 percentile | 3.1 mg/kg |
| 50 percentile | 5.2 mg/kg |
| 75 percentile | 7.6 mg/kg |
| 95 percentile | 13.1 mg/kg |
| Maximum | 830 mg/kg |
| MAD | 3.26 mg/kg |
| Robust CV | 62.7% |
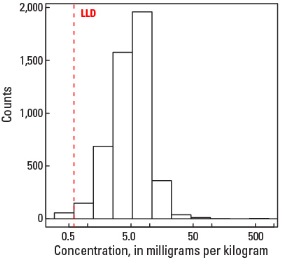
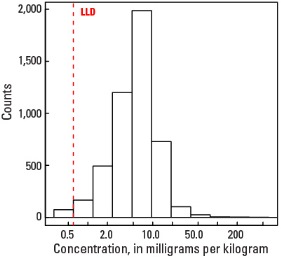
Histogram
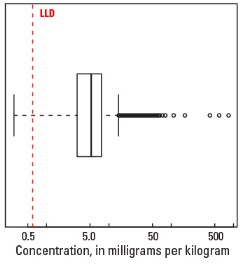
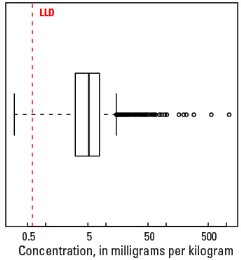
Boxplot
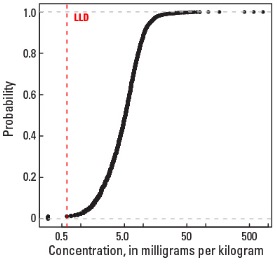
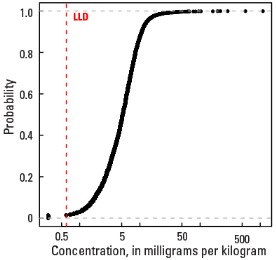
Empirical cumulative distribution function
Statistics - A Horizon
| Number of samples | 4,813 |
| LLD | 0.6 mg/kg |
| Number below LLD | 67 |
| Minimum | <0.6 mg/kg |
| 5 percentile | 1.3 mg/kg |
| 25 percentile | 3.1 mg/kg |
| 50 percentile | 5.2 mg/kg |
| 75 percentile | 7.8 mg/kg |
| 95 percentile | 13.1 mg/kg |
| Maximum | 1,110 mg/kg |
| MAD | 3.41 mg/kg |
| Robust CV | 65.6 % |
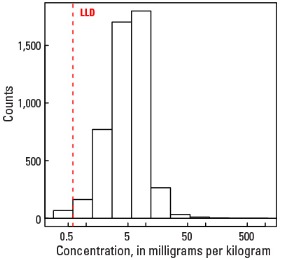
Histogram
Boxplot
Empirical cumulative distribution function
Statistics - C Horizon
| Number of samples | 4,780 |
| LLD | 0.6 mg/kg |
| Number below LLD | 73 |
| Minimum | <0.6 mg/kg |
| 5 percentile | 1.3 mg/kg |
| 25 percentile | 3.4 mg/kg |
| 50 percentile | 5.7 mg/kg |
| 75 percentile | 8.4 mg/kg |
| 95 percentile | 15.7 mg/kg |
| Maximum | 397 mg/kg |
| MAD | 3.56 mg/kg |
| Robust CV | 62.4 % |
Histogram
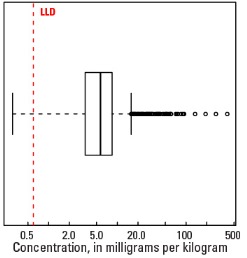
Boxplot