


The purpose of these interpretive discussions is to provide a perspective on regional- and national-scale variations in element and mineral distributions in soils and their likely causes. The significant spatial variations shown by most elements and minerals can commonly be attributed to geologic sources in underlying parent materials, but other spatial variations seem clearly related to additional factors such as climate, the age of soils, transported source material, and anthropogenic influences. We attempt to distinguish the influence of these various factors on a regional and national scale. Numerous more local features might similarly be related to these same factors, but these features also have some probability of being an artifact of a random sampling of variable compositions, so that there is some probability of samples with similar compositions occurring in clusters of two or more adjacent sites by chance. Distinguishing such random occurrences from true variability is beyond the scope of the data from which these maps are constructed. Some caution, therefore, is advisable in interpreting the significance of these more local features unless some unique sources or processes can clearly be related to them.
Bismuth (Bi) is a metallic trace element. Its alloys with tin (Sn) or cadmium (Cd) have low melting points and are used in solders, electric fuses, and fire detectors. Bismuth has no known biological role and is considered to be relatively nontoxic.
Bismuth can occur in nature as the native metal, but more commonly it forms sulfide or oxide minerals. It is often incorporated into common sulfide minerals such as sphalerite ((Zn, Fe)S), galena (PbS), and chalcopyrite (CuFeS2), and can replace calcium (Ca) in apatite (Ca5(PO4,CO3)3(OH,F,Cl)). In soils, it is often associated with iron (Fe) and manganese (Mn) oxides and hydroxides and binds strongly to organic matter.
The distribution of mineral resource deposits with Bi as a commodity (major or minor) in the United States, extracted from the U.S. Geological Survey (USGS) Mineral Resource Data System (MRDS) website, can be seen by hovering the mouse here. Statistics and information on the worldwide supply of, demand for, and flow of Bi–containing materials are available through the USGS National Minerals Information Center (NMIC) website.
The average abundance of Bi in the Earth's upper continental crust is estimated to be about 0.23 milligrams per kilogram (mg/kg) (Hu and Gao, 2008). Shale and granite have an average Bi concentration of about 0.20–0.25 mg/kg, whereas the other common rock types have lower concentrations. Bismuth concentrations average about 0.01 mg/kg in mafic rocks, about 0.05 mg/kg in sandstone, and about 0.1 mg/kg in limestone. Bismuth concentrations in coal are especially elevated (0.1–5 mg/kg).
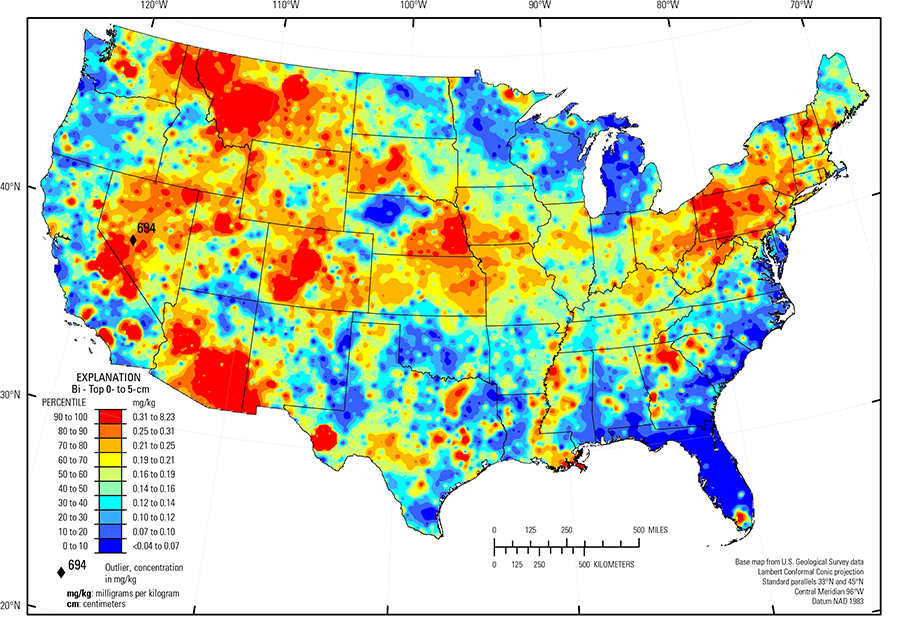
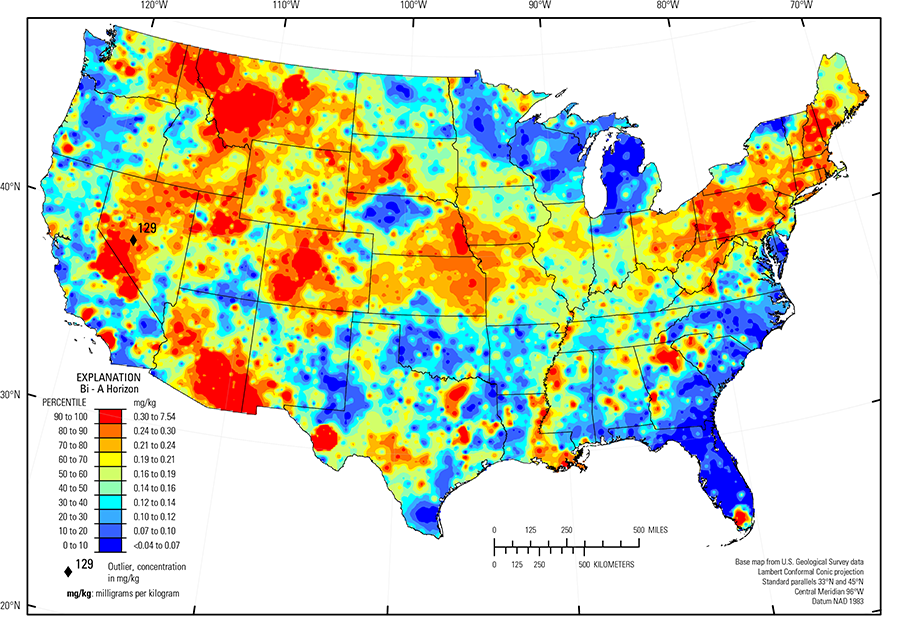
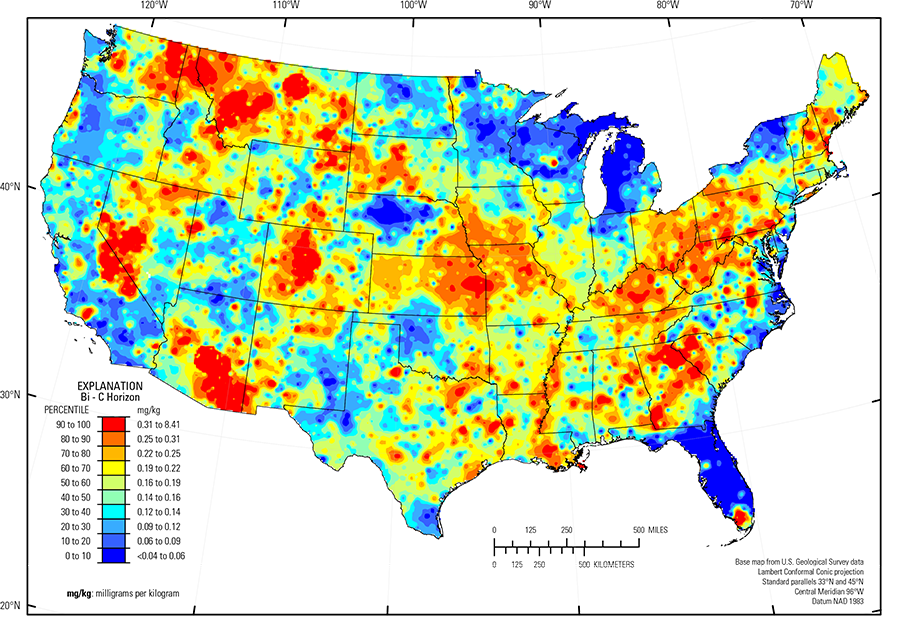
In our data, the median Bi concentration is the same (0.16 mg/kg) for each of the three sample types collected (top 0- to 5-cm layer, soil A horizon, and soil C horizon) (see the summary statistics [open in new window]). In general, the geochemical maps for the three sample types are quite similar.
The distribution of Bi in soils of the conterminous United States is primarily controlled by the composition of underlying soil parent materials. Areas of elevated Bi concentrations include:
- Northeastern Washington, northern Idaho, western Montana, central and southwestern Colorado, southeastern Arizona, northeastern Georgia, northeastern Nevada, and along the California–Nevada border where granitic rocks or sulfide–bearing mineral occurrences are present;
- Western South Dakota, eastern Nebraska, eastern Kansas, southeastern Iowa, northern Missouri, Ohio, and western Pennsylvania where soils formed on shale parent materials, clayey till, or glacial deposits containing shale fragments. In western Pennsylvania, it is possible that there is a contribution from coal;
- Kentucky Bluegrass area (USDA, 2006), where parent materials are apatite–bearing weathered limestone (best seen in the map for the soil C horizon);
- Everglades (USDA, 2006) in southern Florida where elevated Bi concentrations correlate with high organic carbon (COrg) in soils.
The Gulf and Atlantic Coastal Plain (Fenneman and Johnson, 1946) is bisected by the Southern Mississippi River Alluvium and the Southern Mississippi Valley Loess (USDA, 2006). Alluvial sediments have deposited in the Mississippi River valley as the river flooded in recent geologic time. When these sediments dried, winds picked up the fine material and deposited it in thick loess sheets, mainly along the east side of the river valley. The youngest loess sheets are about 10,000 years old. A pattern of higher Bi concentrations in soils developed on these young sediments reflects long–range transport of Bi–bearing material from the upper part of the Mississippi River drainage basin.
Areas of low Bi concentrations in soils include:
- Atlantic Coastal Plain (Fenneman and Johnson, 1946) where soil parent materials are dominantly quartz–rich sedimentary rocks and unconsolidated sediments;
- Nebraska Sand Hills (USDA, 2006), where parent materials are quartz– and plagioclase–rich, unconsolidated sand dunes and sand sheets;
- Colorado Plateau (USDA, 2006) of Arizona, Utah, and Colorado, where soils are derived from quartz–rich sandstone and eolian deposits; and
- Northern and western Michigan, where parent materials are comprised of quartz–rich glacial deposits.
Statistics - 0 TO 5 CM
| Number of samples | 4,841 |
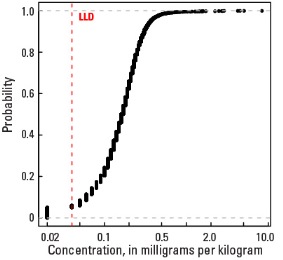
| LLD | 0.04 mg/kg |
| Number below LLD | 121 |
| Minimum | <0.04 mg/kg |
| 5 percentile | 0.05 mg/kg |
| 25 percentile | 0.11 mg/kg |
| 50 percentile | 0.16 mg/kg |
| 75 percentile | 0.23 mg/kg |
| 95 percentile | 0.38 mg/kg |
| Maximum | 694 mg/kg |
| MAD | 0.089 mg/kg |
| Robust CV | 55.6% |

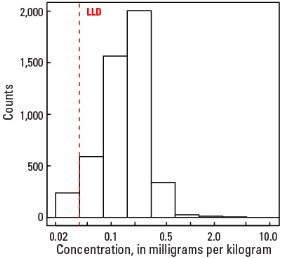
Histogram
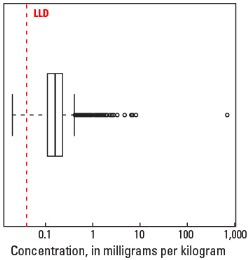
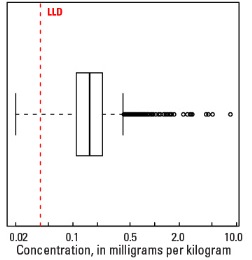
Boxplot
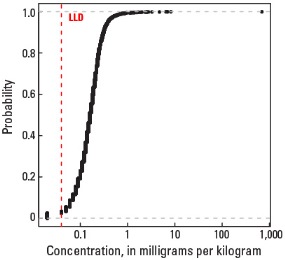
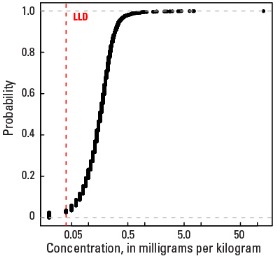
Empirical cumulative distribution function
Statistics - A Horizon
| Number of samples | 4,813 |
| LLD | 0.04 mg/kg |
| Number below LLD | 118 |
| Minimum | <0.04 mg/kg |
| 5 percentile | 0.05 mg/kg |
| 25 percentile | 0.11 mg/kg |
| 50 percentile | 0.16 mg/kg |
| 75 percentile | 0.23 mg/kg |
| 95 percentile | 0.35 mg/kg |
| Maximum | 129 mg/kg |
| MAD | 0.089 mg/kg |
| Robust CV | 55.6 % |
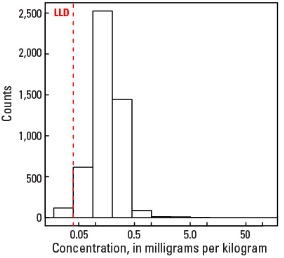
Histogram
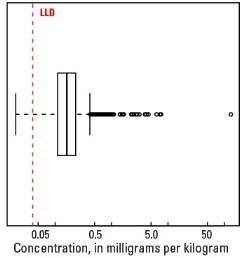
Boxplot
Empirical cumulative distribution function
Statistics - C Horizon
| Number of samples | 4,780 |
| LLD | 0.04 mg/kg |
| Number below LLD | 238 |
| Minimum | <0.04 mg/kg |
| 5 percentile | 0.04 mg/kg |
| 25 percentile | 0.11 mg/kg |
| 50 percentile | 0.16 mg/kg |
| 75 percentile | 0.23 mg/kg |
| 95 percentile | 0.37 mg/kg |
| Maximum | 8.41 mg/kg |
| MAD | 0.089 mg/kg |
| Robust CV | 55.6 % |
Histogram
Boxplot