Skip past header information
USGS - science for a changing world

Open-File Report 2011-1039


Continuous Resistivity Profiling and Seismic-Reflection Data Collected in April 2010 From Indian River Bay, Delaware


Skip past contents information

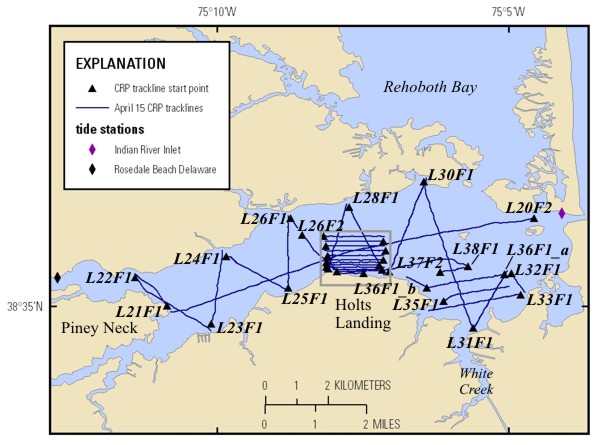
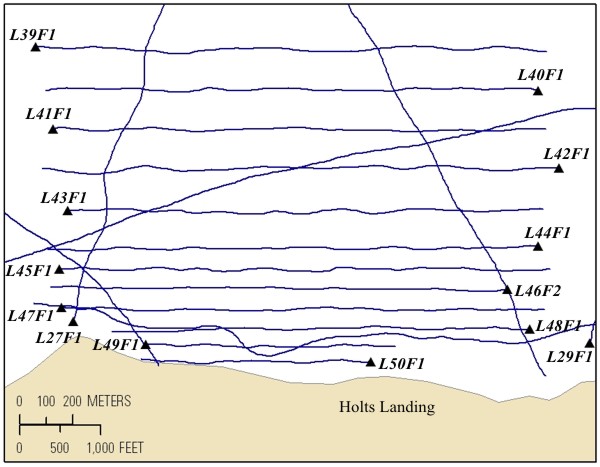
Continuous Resistivity Profile Previews - April 15

The table below contains previews of the CRP data processed using average measured water resistivity values. One line on this day was additionally processed using a water conductivity file (file extension CON) that provides continuous, varying water resistivity values along the length of the line. This line (L20F2) extends almost the whole length of the bay from the inlet (more saline water) to Piney Neck (fresher water). Both the EarthImager 2D JPEG image and the MATLAB JPEG image of each processed file are presented. In addition, the trackline map below is a “clickable” map. Due to the close spacing of the tracklines collected off Holts Landing, a second "clickable" map is provided containing those lines. By clicking on a line name in either figure, a new window will open with the processed images from that particular line segment. This new window will contain the MATLAB JPEG image as well as a reduced version of the EarthImager 2D JPEG image (short version). In the case of L20F2, the link is to the image of the profile processed with the water conductivity file. The beginning of each line is marked with a triangle on the map. The left side of the associated JPEG image represents the beginning of the line and corresponds to the triangle on the map. April 15, 2010, corresponds to Julian day 105.

Trackline map of processed CRP lines collected in Indian River Bay on April 15, 2010. The inset box links to a larger image of those processed lines. Line names provide hotlinks to the JPEG profiles.

Trackline map of the inset of processed CRP lines collected in Indian River Bay on April 15, 2010. These lines are the Holt's Landing tracklines. Line names provide hotlinks to the JPEG profiles.

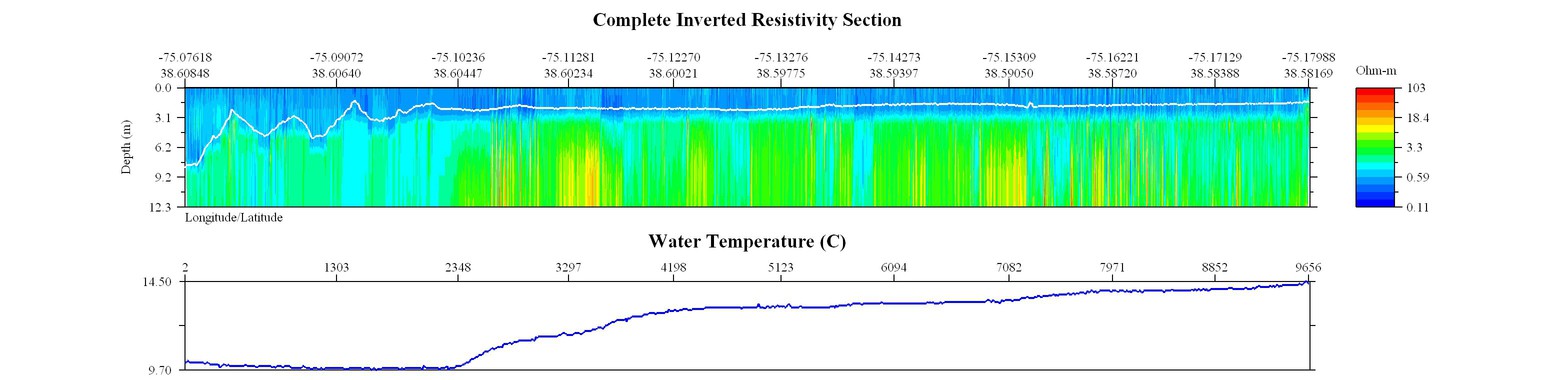
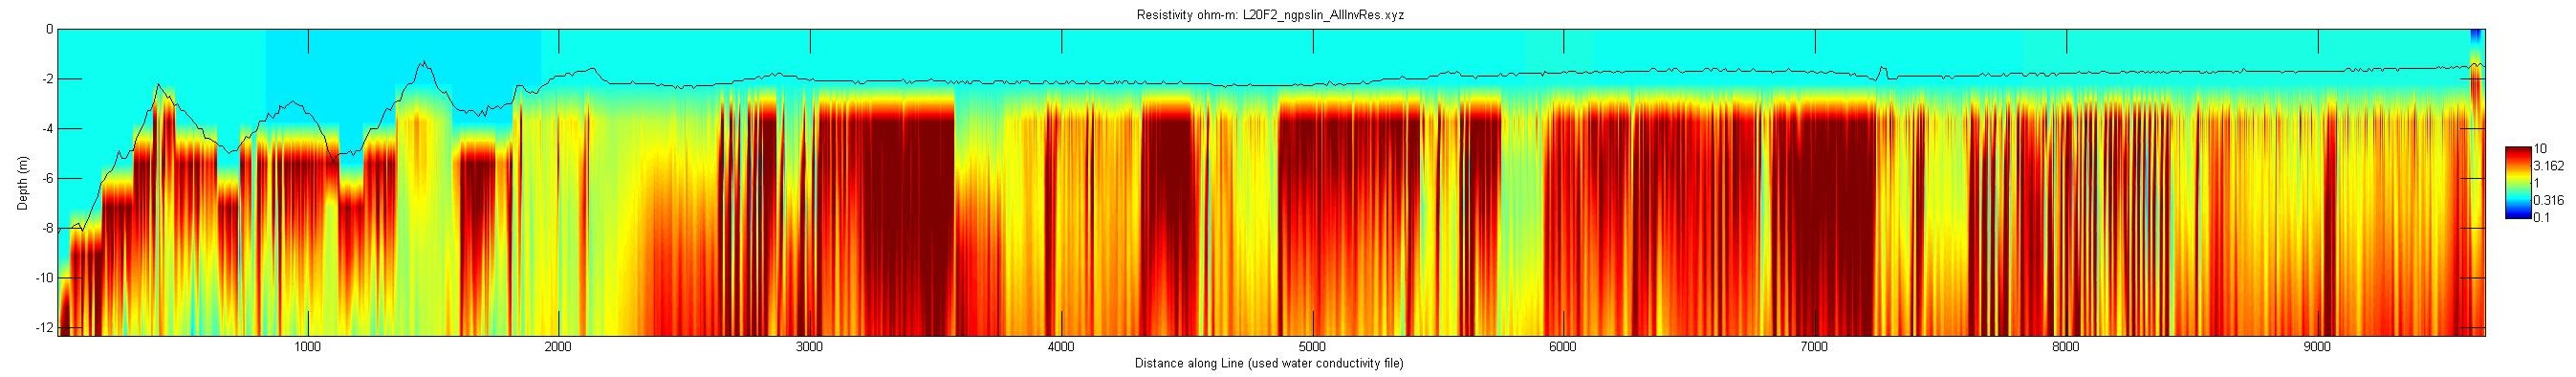
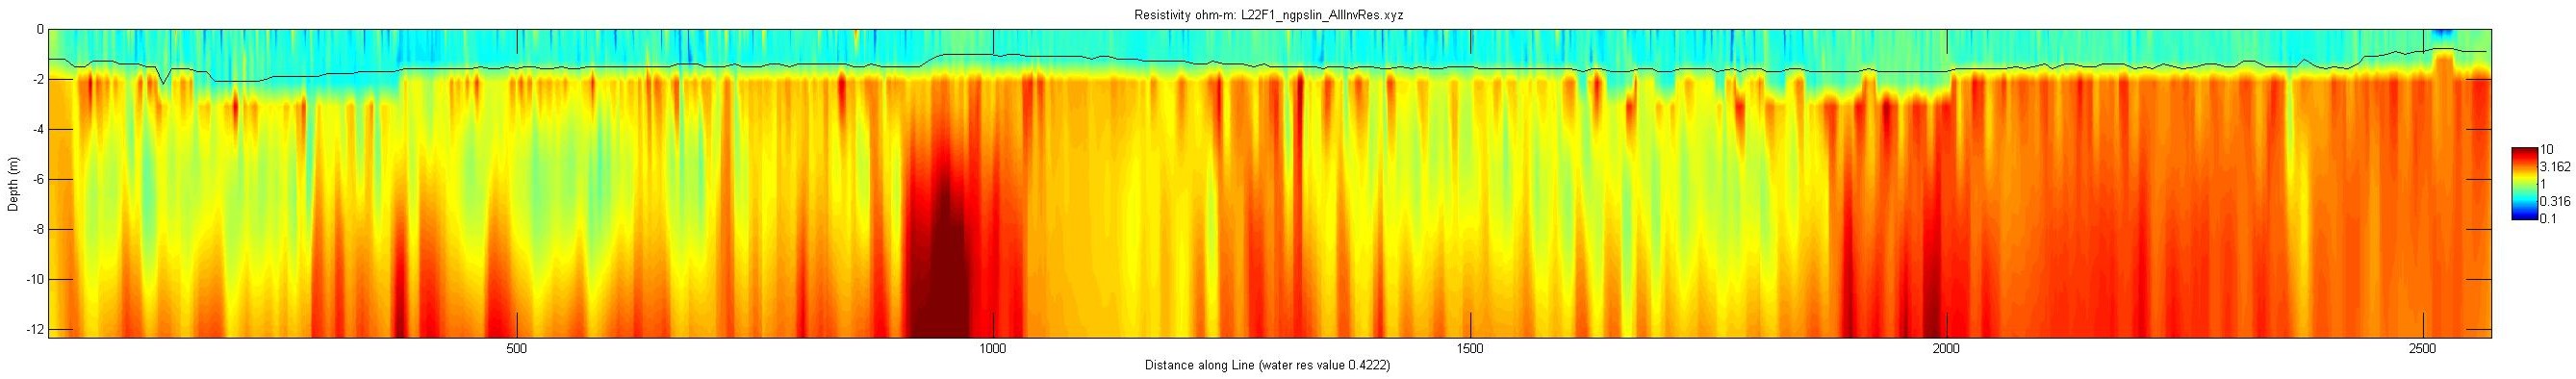
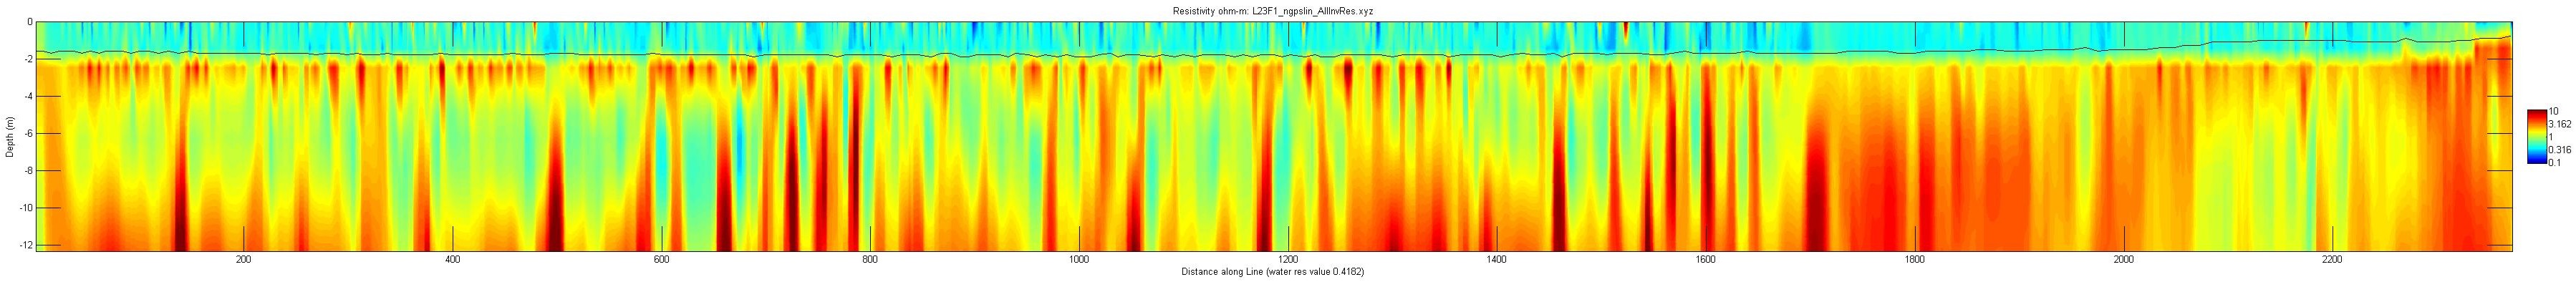
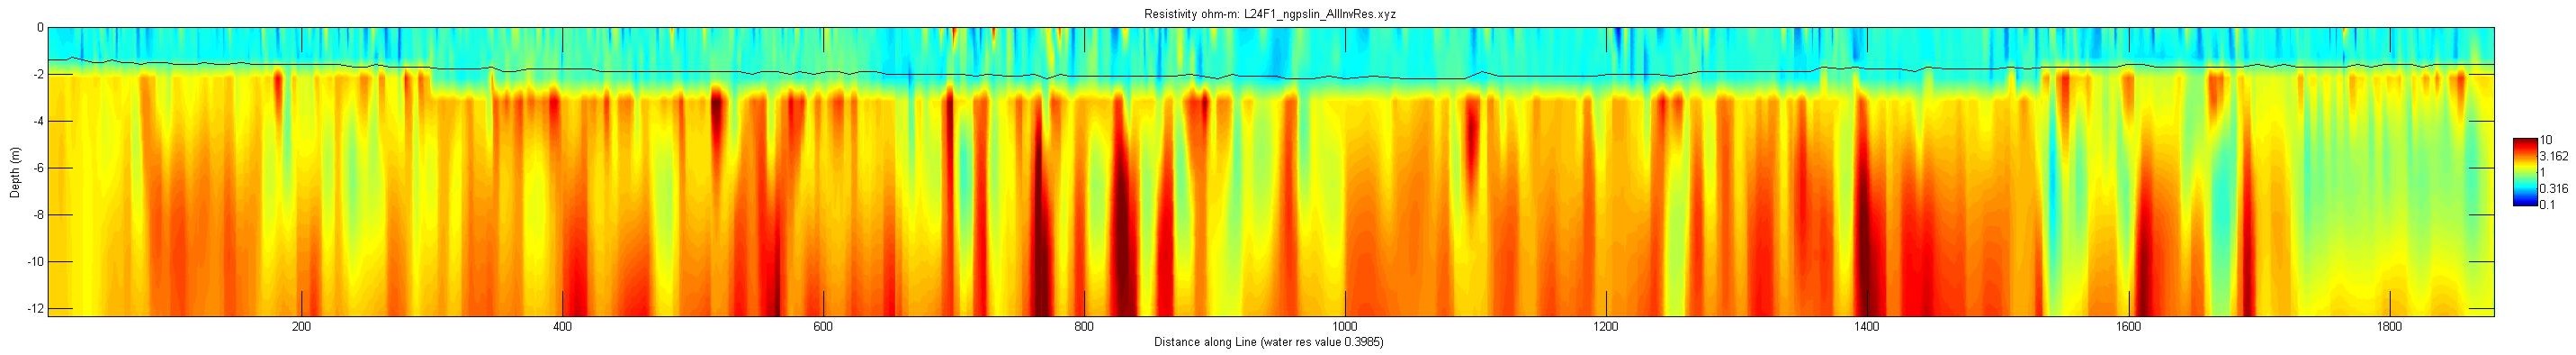
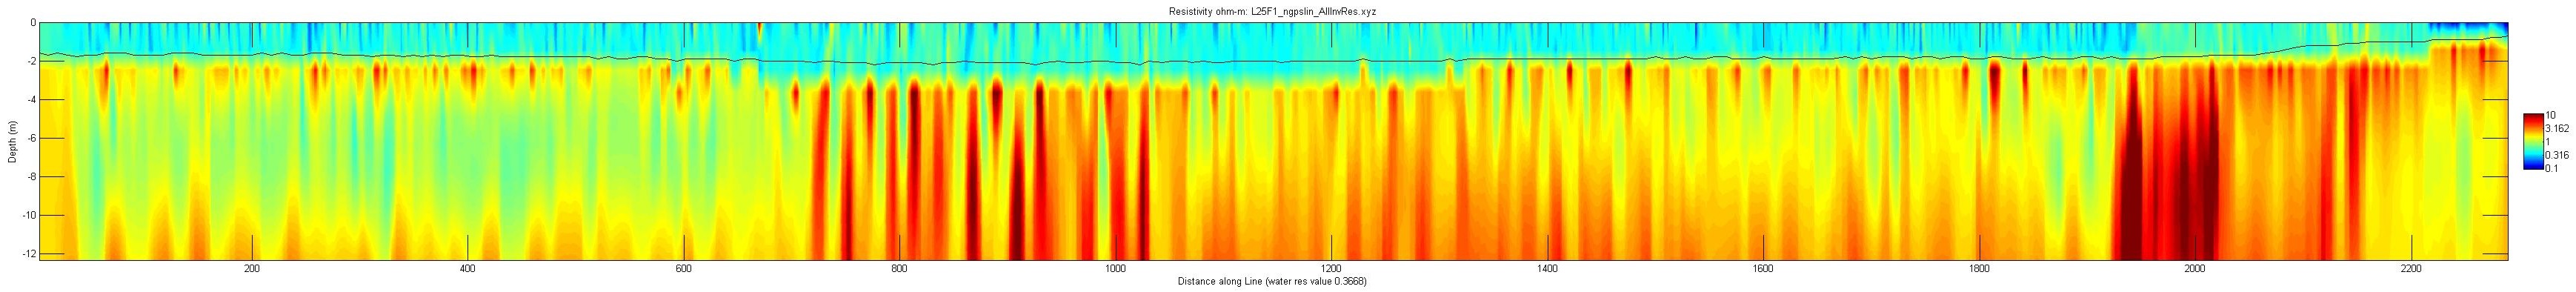
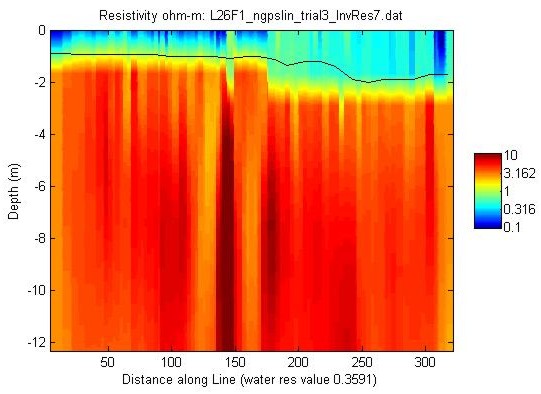
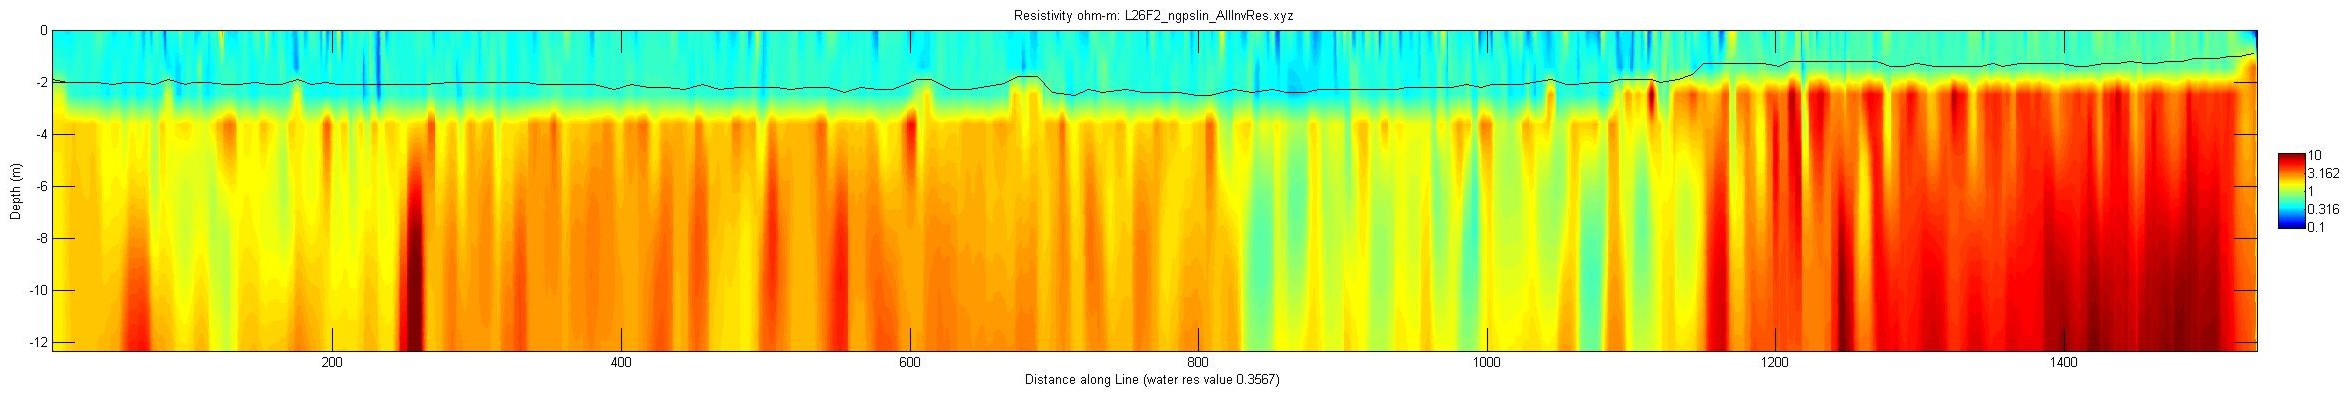
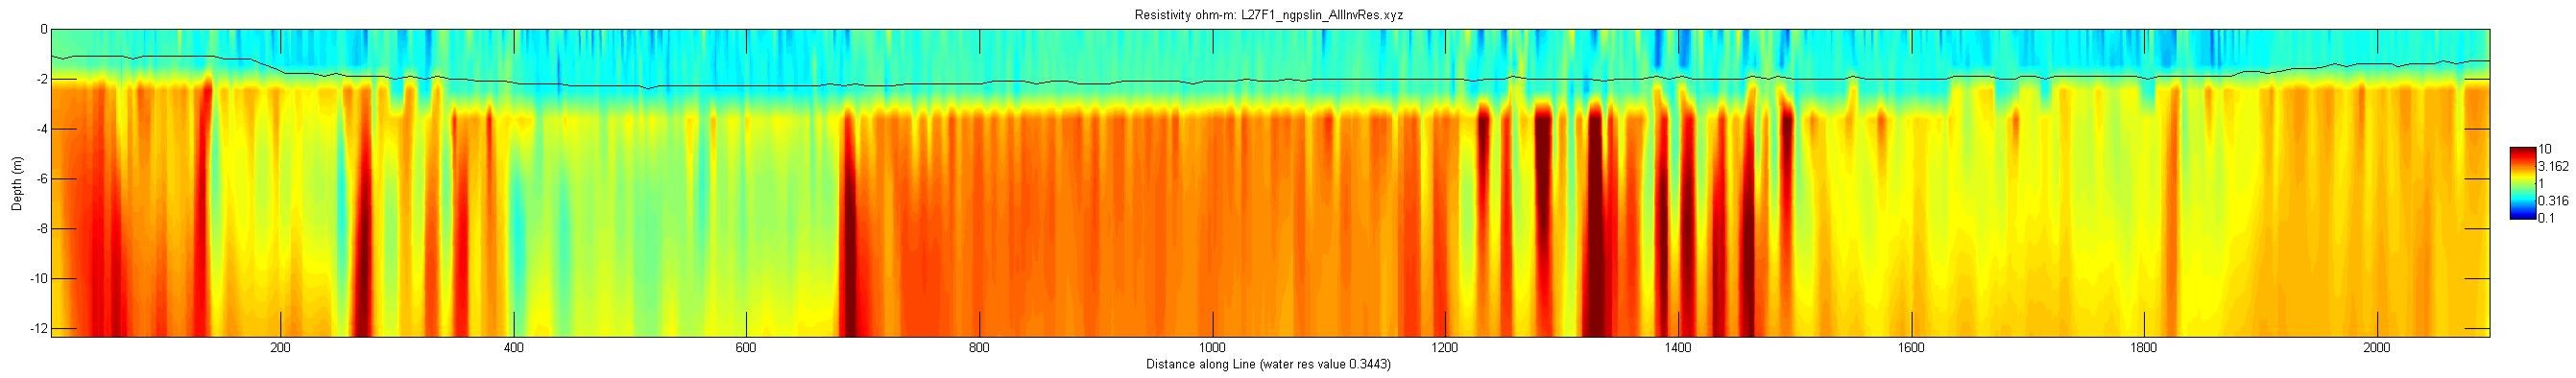
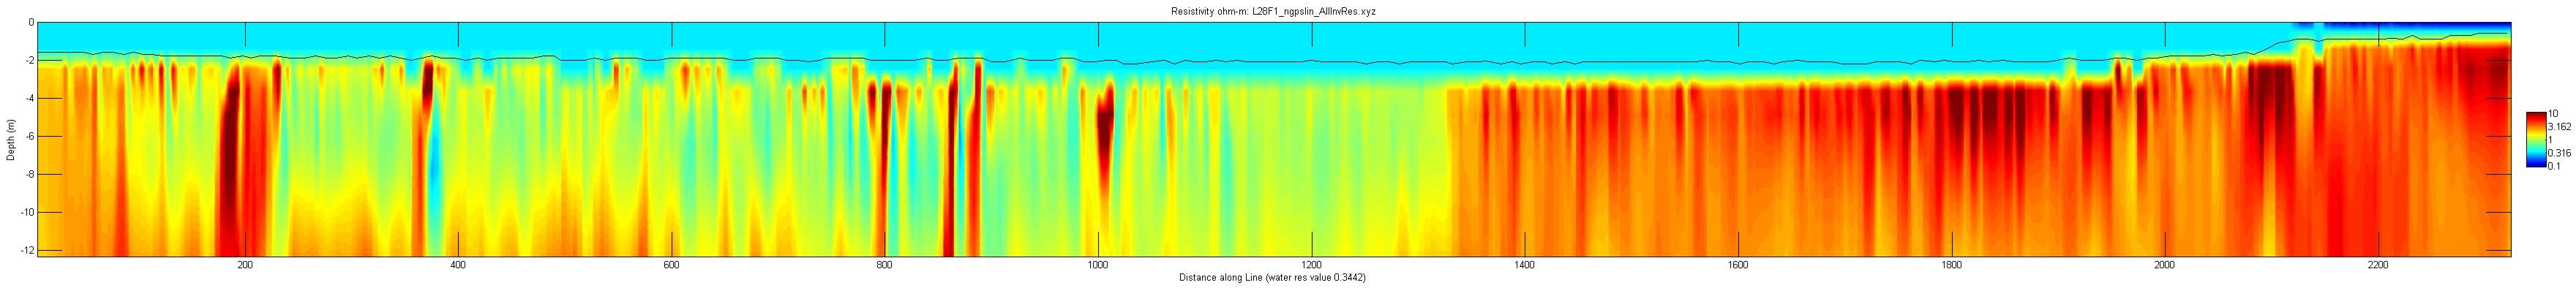
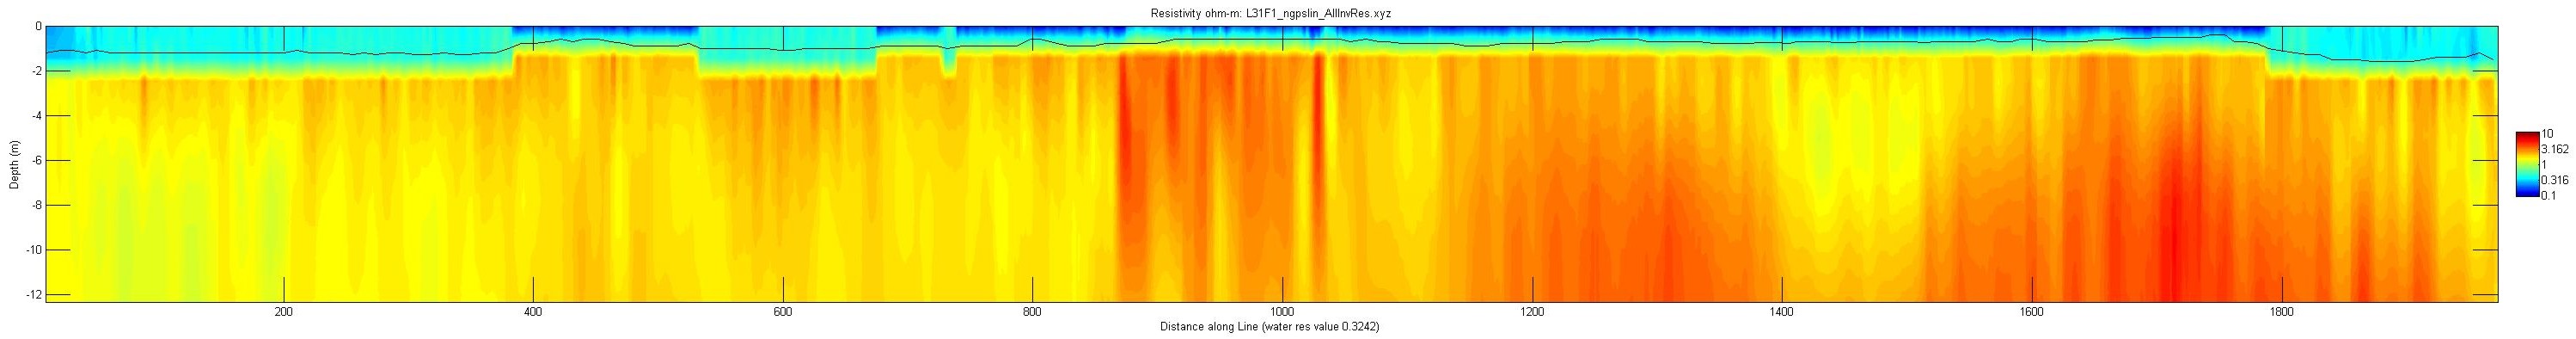
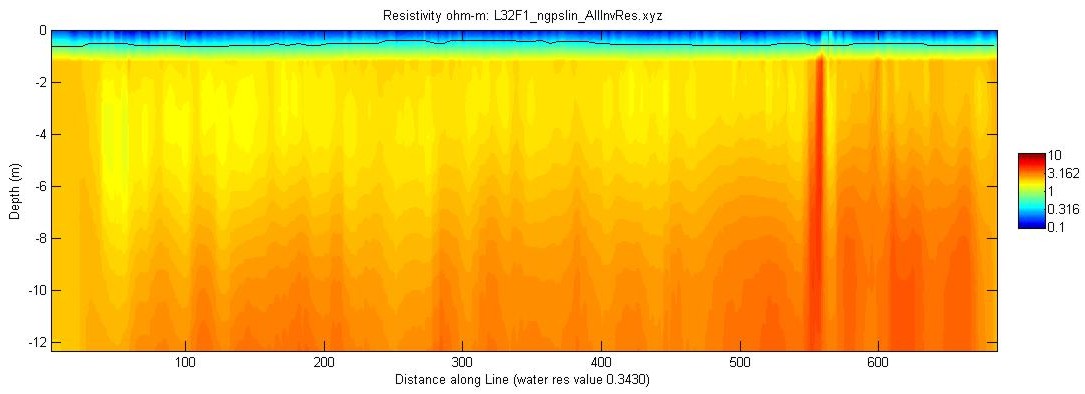
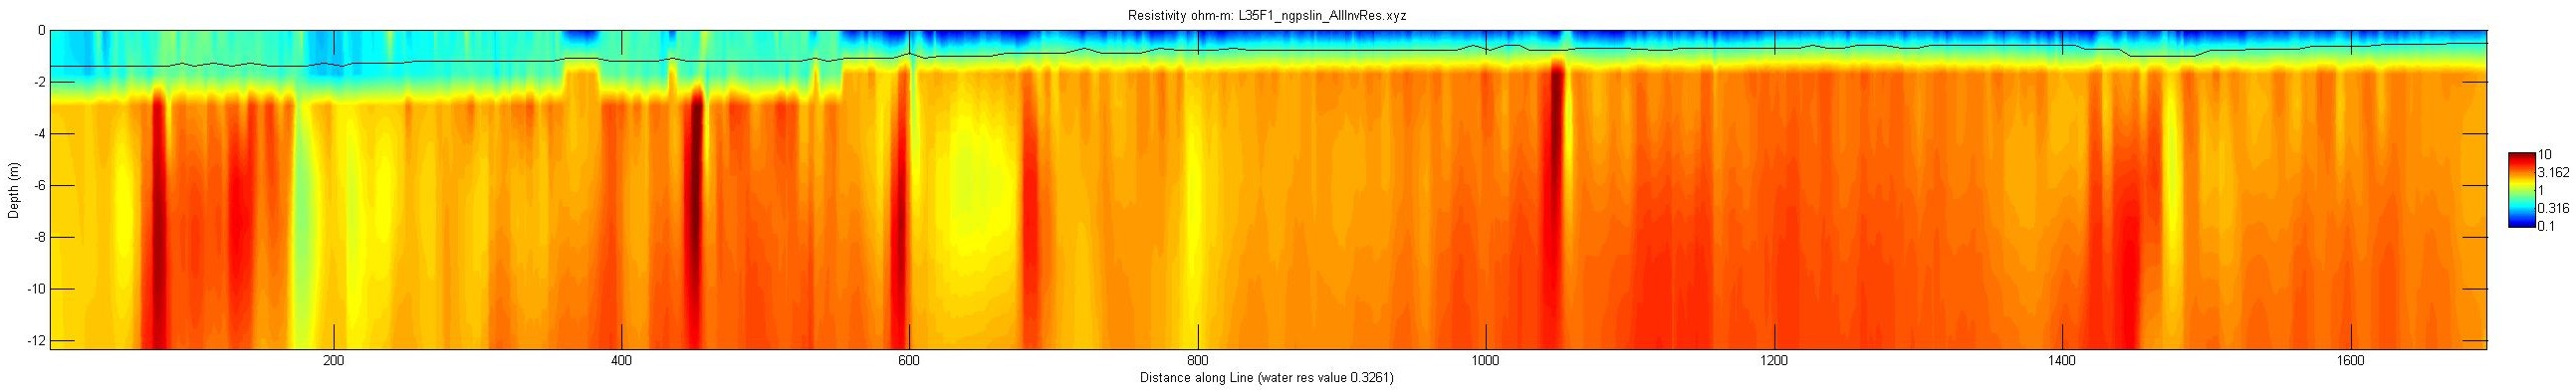
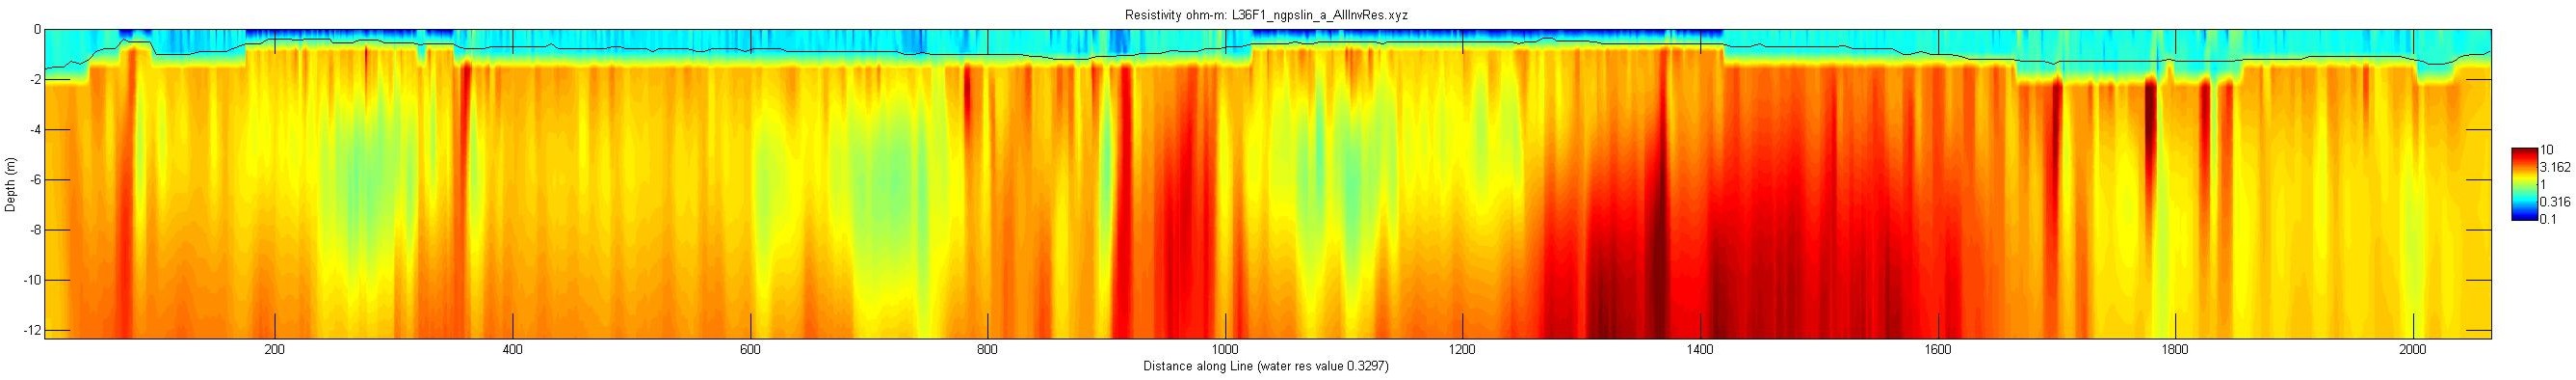
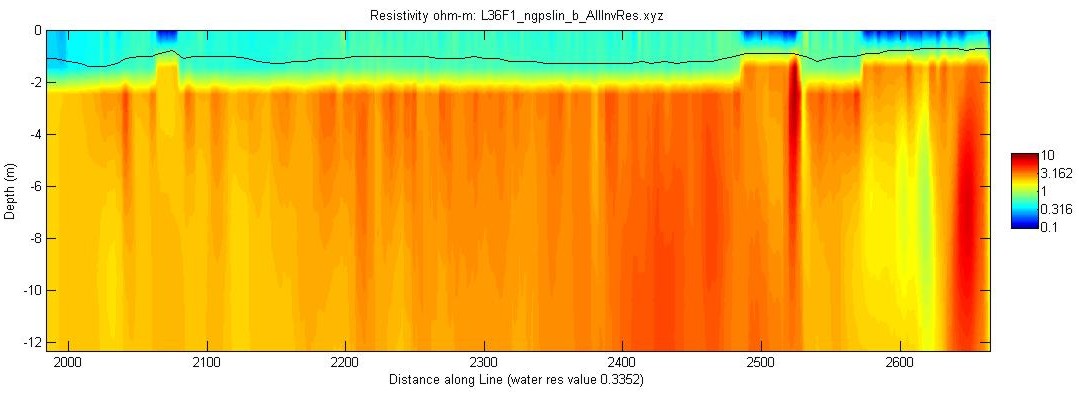
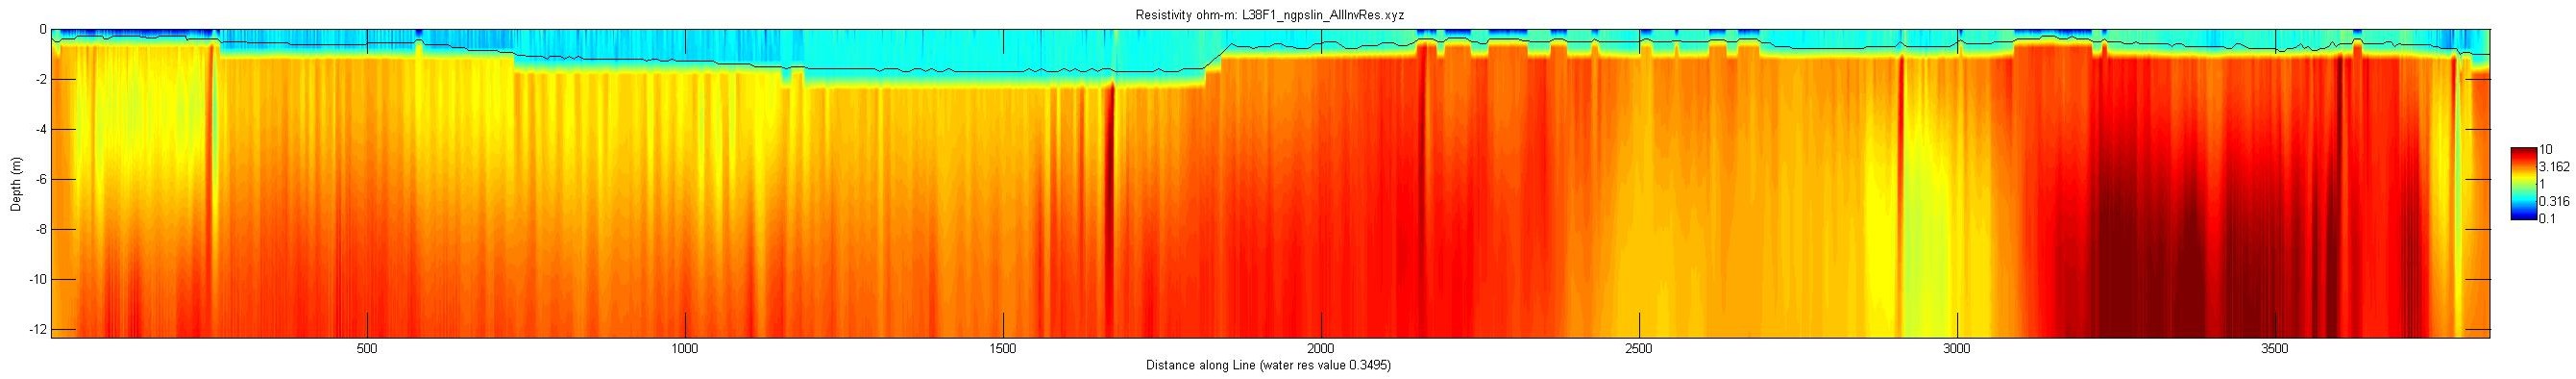
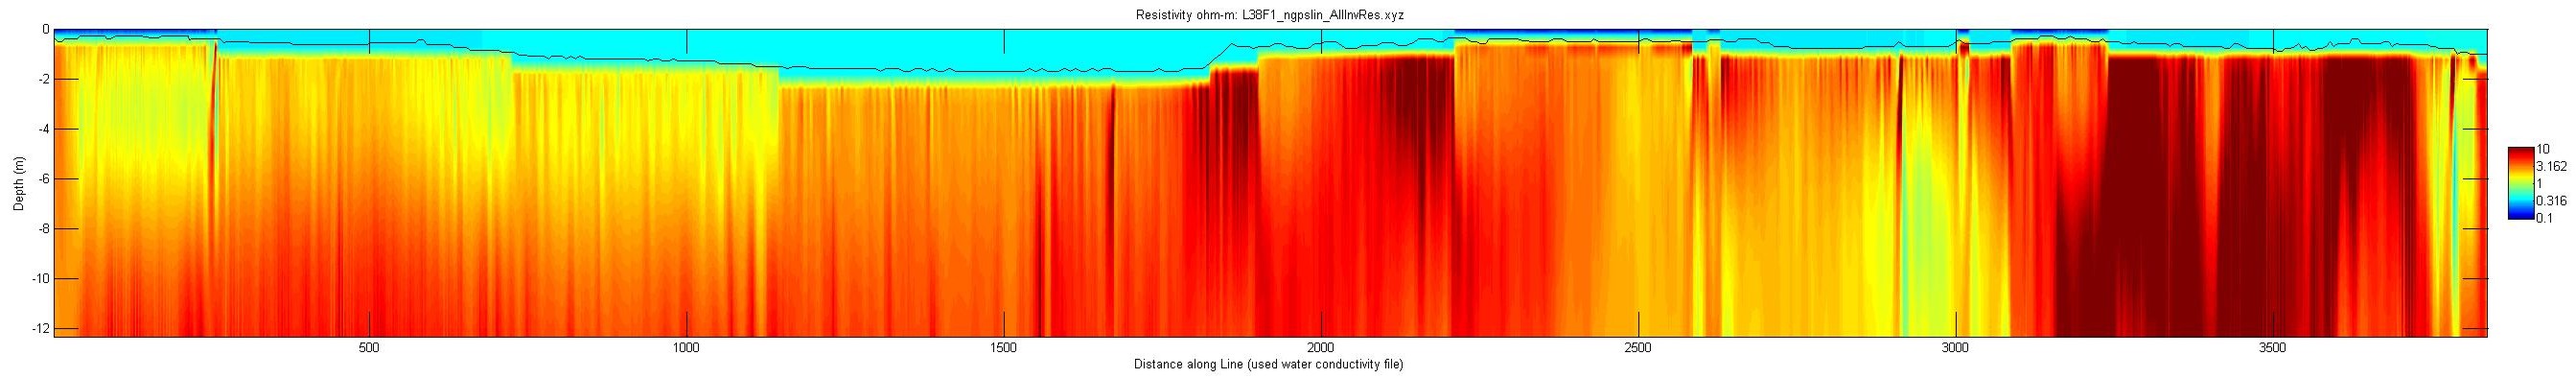
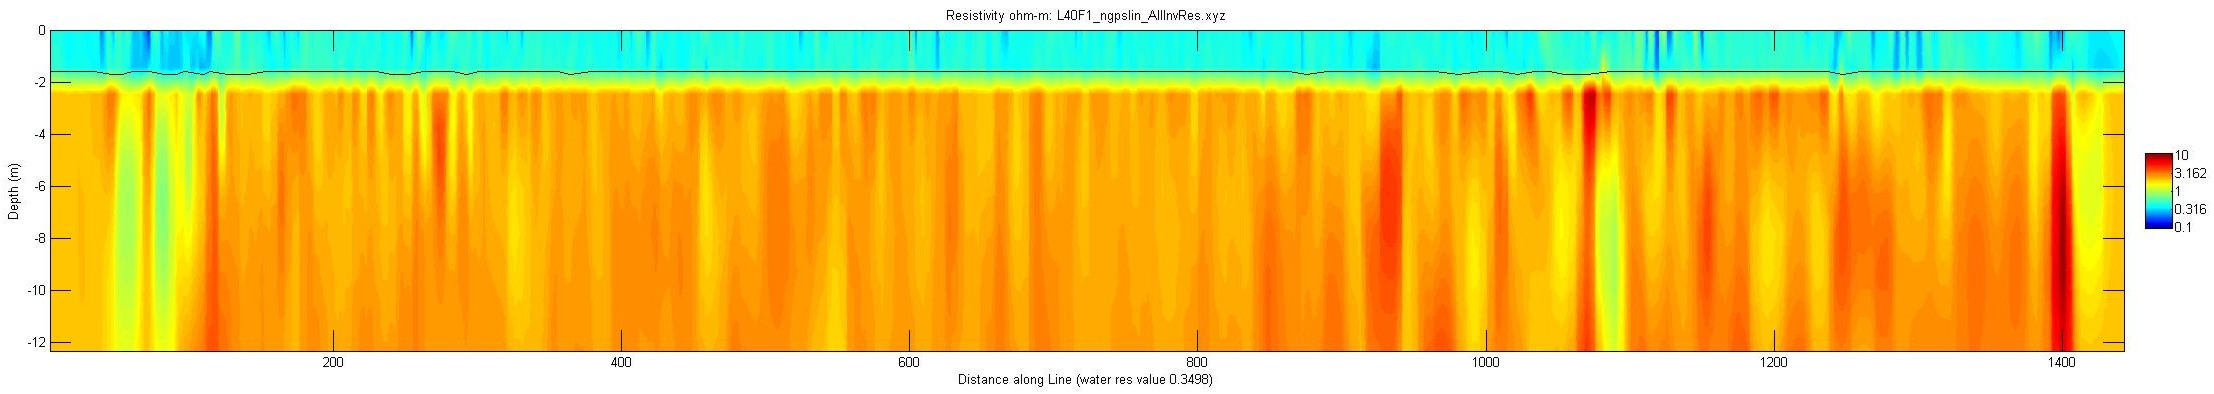
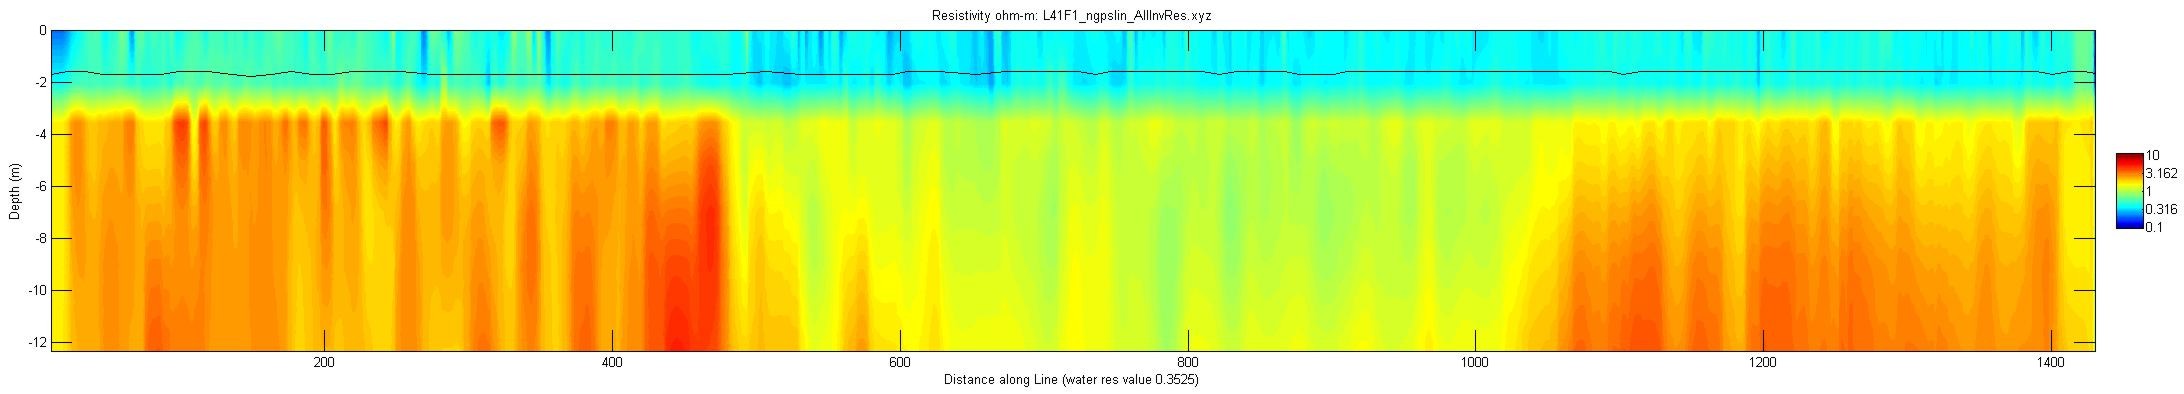
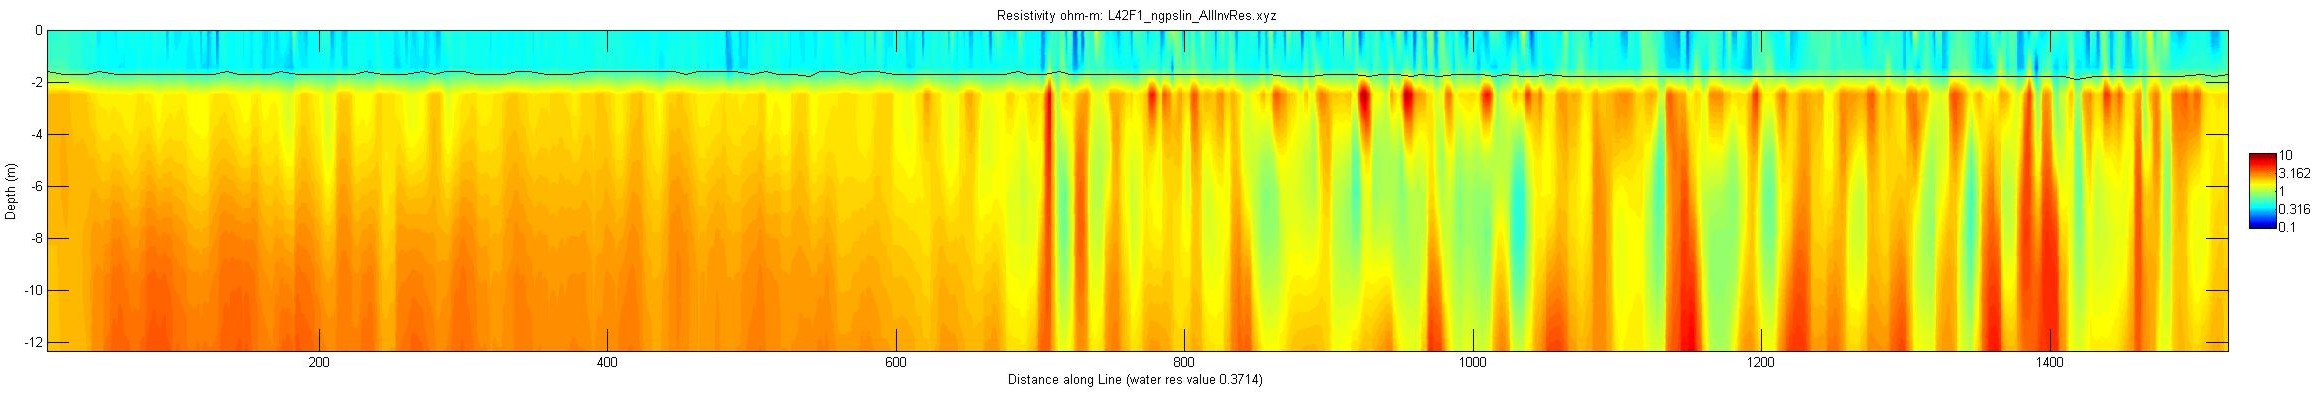
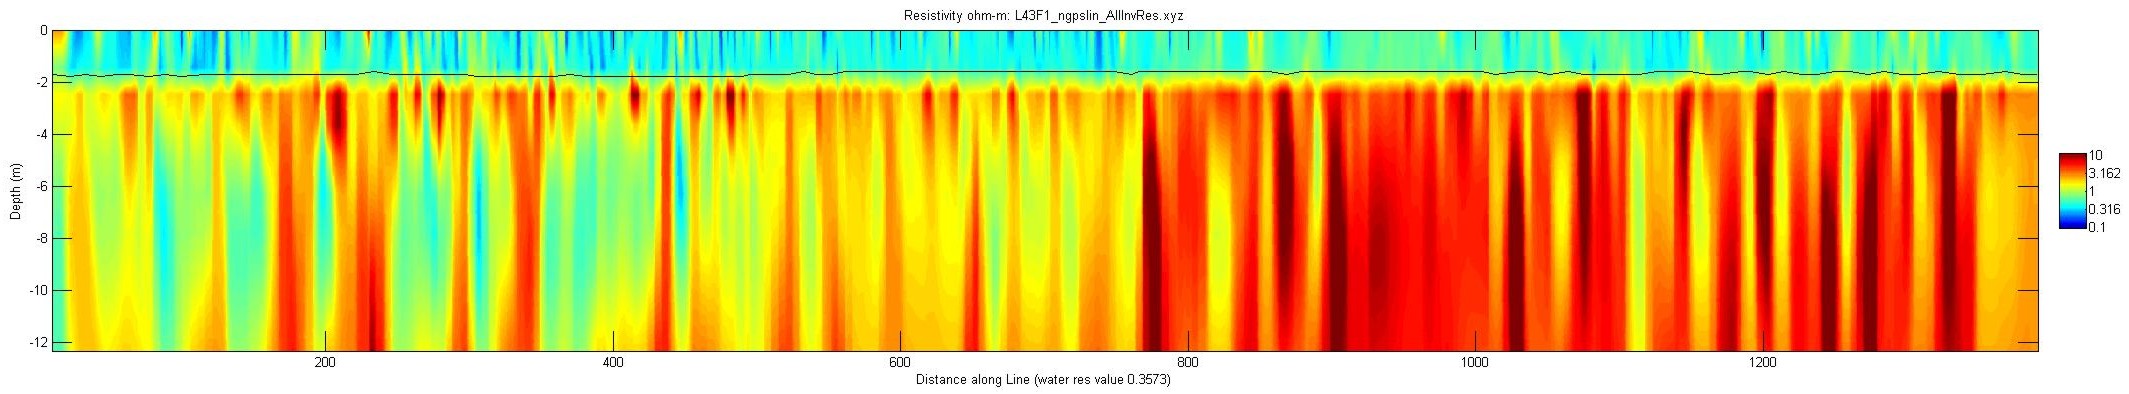
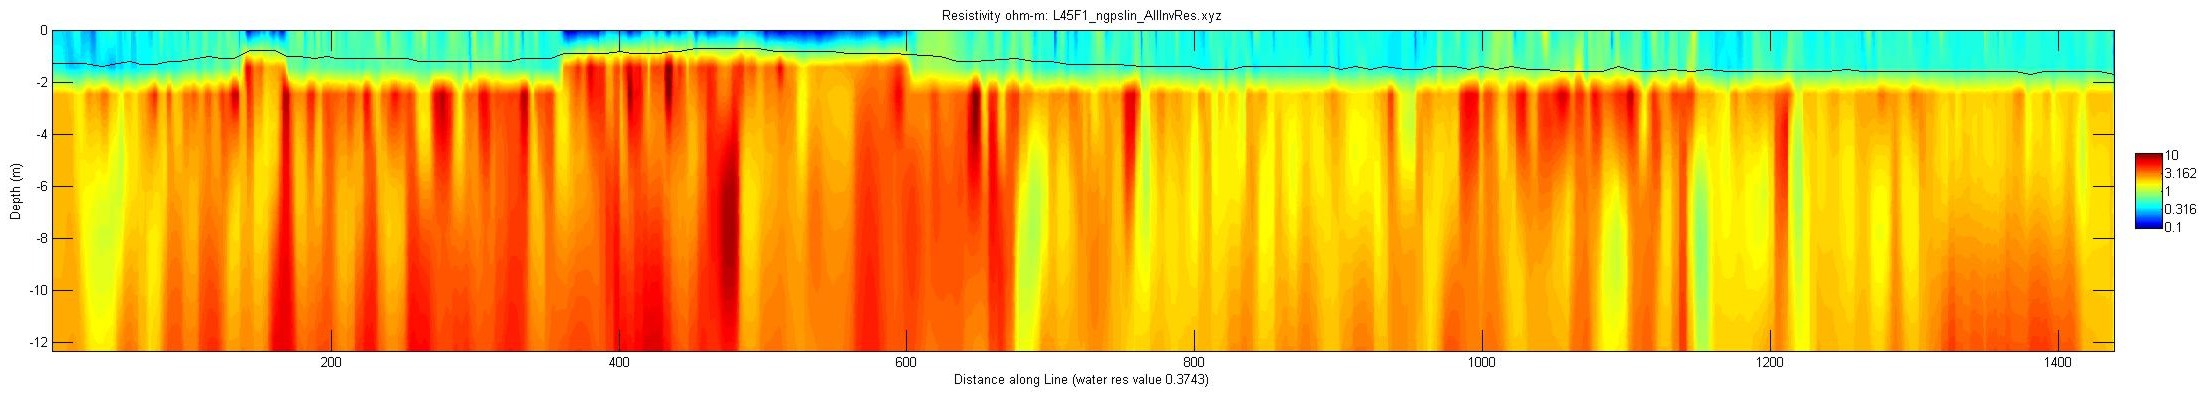
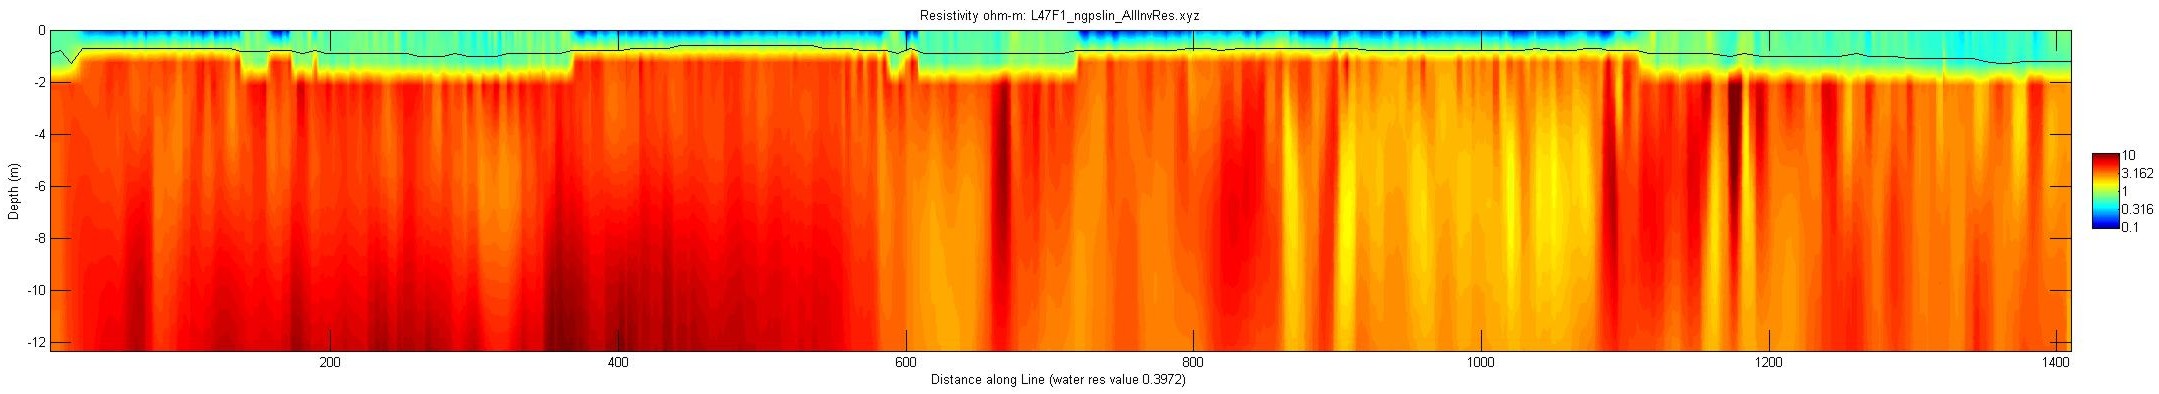
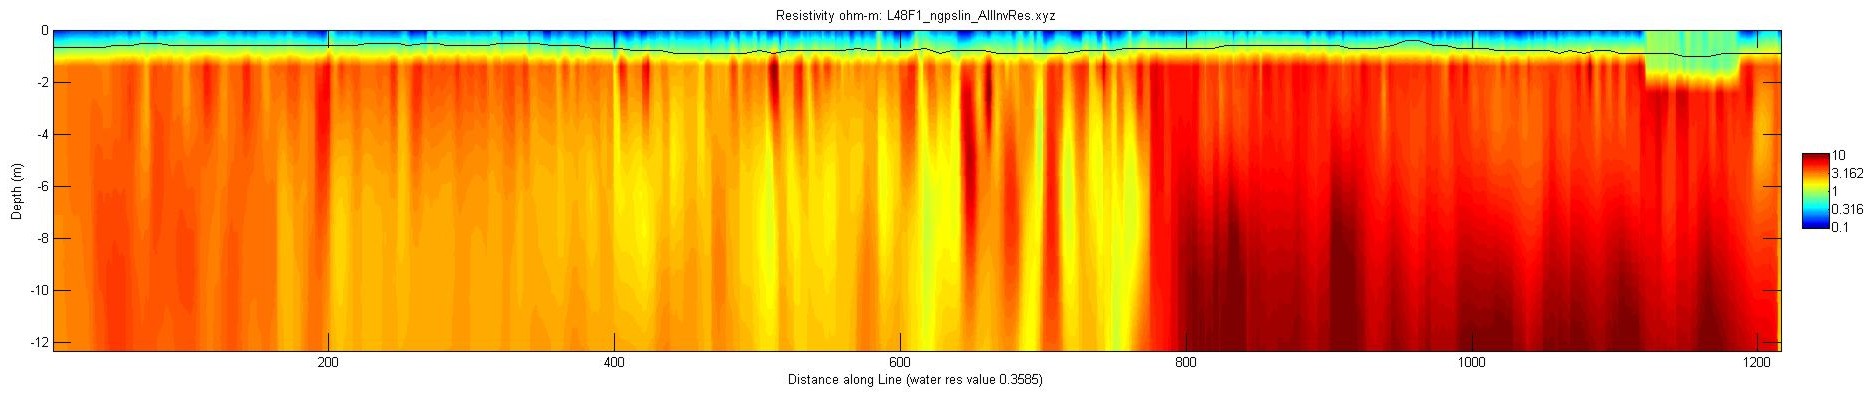
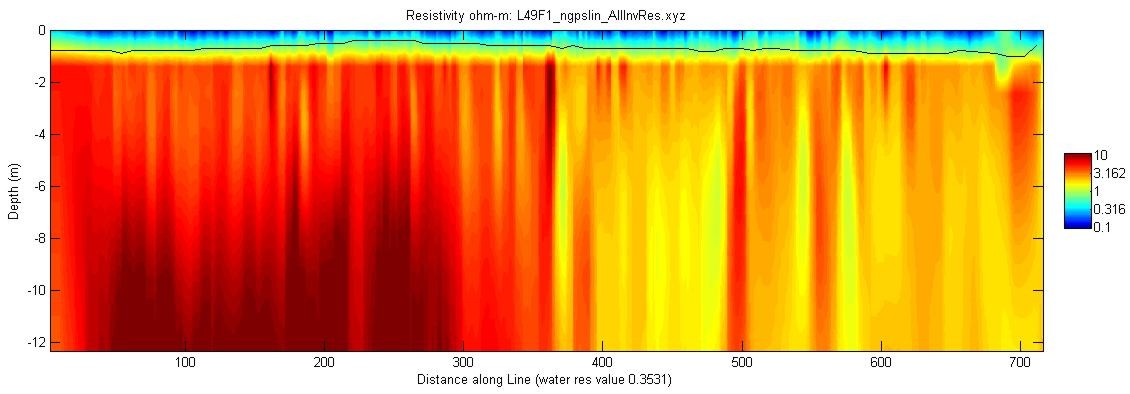
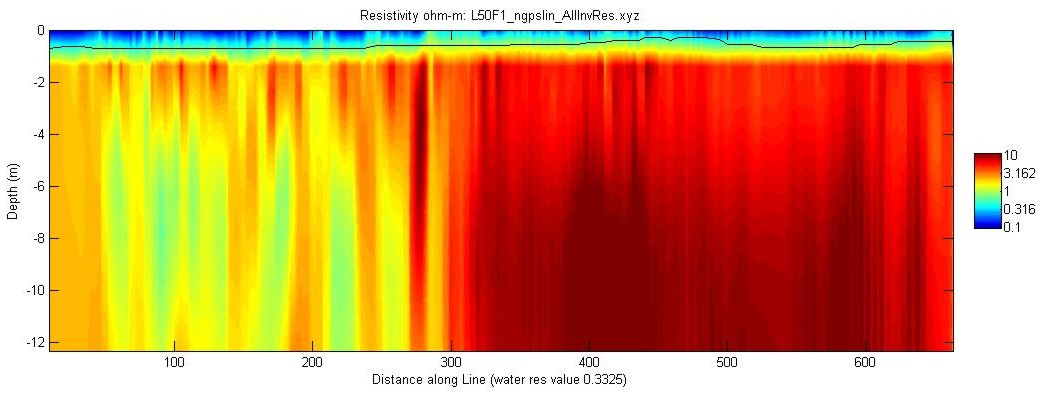
Preview of Profiles—Click individual images to see full-size JPEG images of the profile. For the EarthImager 2D versions, the long version of the profile is available. All of the profiles are available for download from the Data Catalog page.

In the EarthImager 2D version, the white line in the image represents the water depth as measured by the fathometer. In the MATLAB-generated JPEG images, the water depth is represented by a black line. The JPEG images resulting from the EarthImager 2D processing were saved with the default color scale generated by the software. This color scale ranges from blues to reds with reds representing the high resistivity values corresponding to fresher (less saline) groundwater. Each individual image has the scale maximized for the range of resistivity values in the dataset. The MATLAB versions of the JPEG images use a common color scale for all the files to facilitate profile comparison. For these images, the polarity of the color scheme is the same as that of the EarthImager 2D JPEGS in that the colors range from blue to red with reds indicating high resistivity values corresponding to fresher (less saline) groundwater. In the MATLAB version, the x axis represents distance along the line in meters. The EarthImager 2D version x-axis units are latitude and longitude (position) along the line. Measured water temperature information is included with the resistivity profile. One extremely short line (L26F1) did not require the roll-along processing. Consequently, the temperature plot for this line was not generated by the processing software.


EarthImager version MATLAB version

April 15, 2010: Line L20F2, WRES = 0.3798
EarthImager thumbnail JPEG image of line 20, file 2 resistivity and temperature profile.

Matlab thumbnail JPEG image of line 20, file 2 resistivity profile.
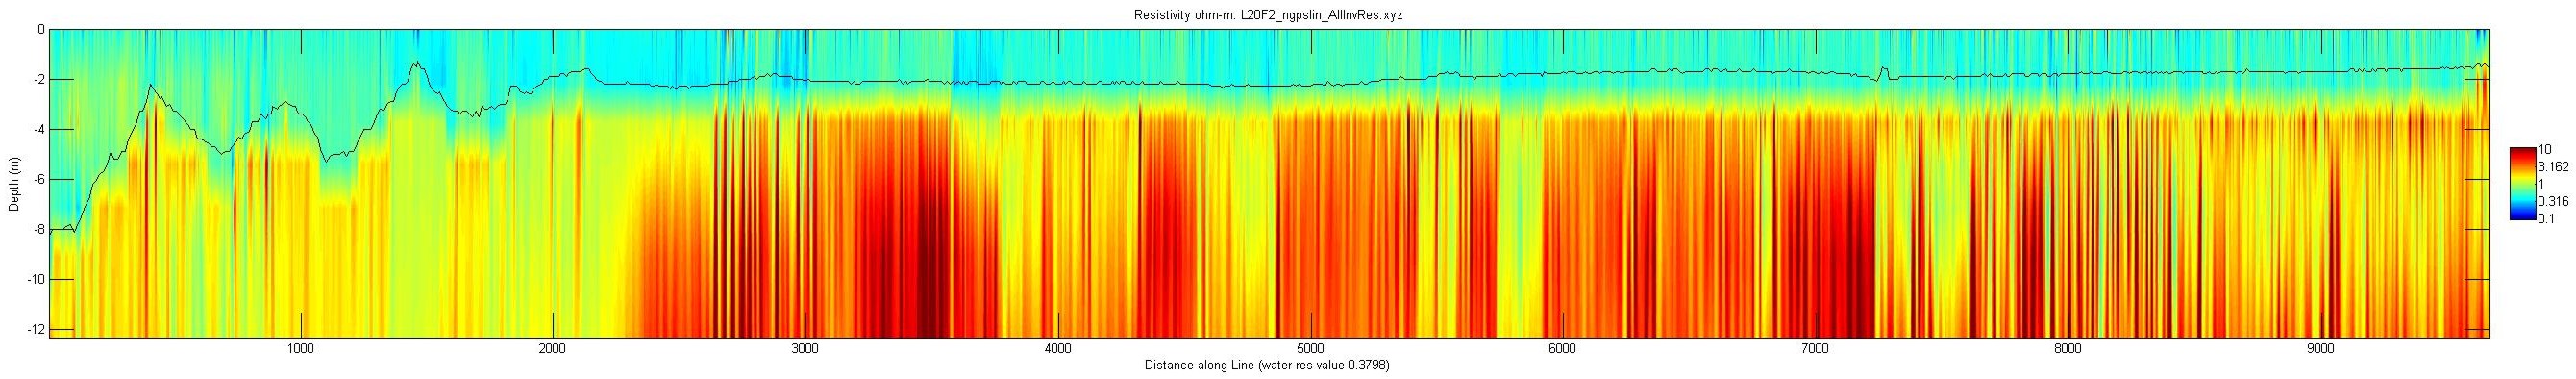
April 15, 2010: Line L20F2, water conductivity file
EarthImager thumbnail JPEG image of line 20, file 2 resistivity and temperature profile using continuous water conductivity file.
Matlab thumbnail JPEG image of line 20, file 2 resistivity profile using continuous water conductivity file.
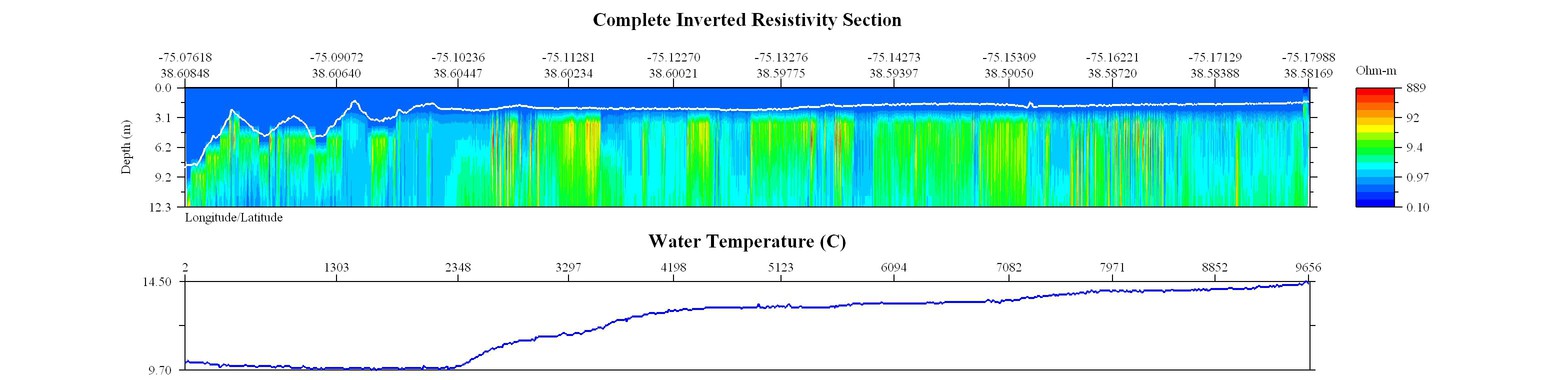
April 15, 2010: Line L21F1, WRES = 0.4153
EarthImager thumbnail JPEG image of line 21 resistivity and temperature profile.
Matlab thumbnail JPEG image of line 21 resistivity profile.
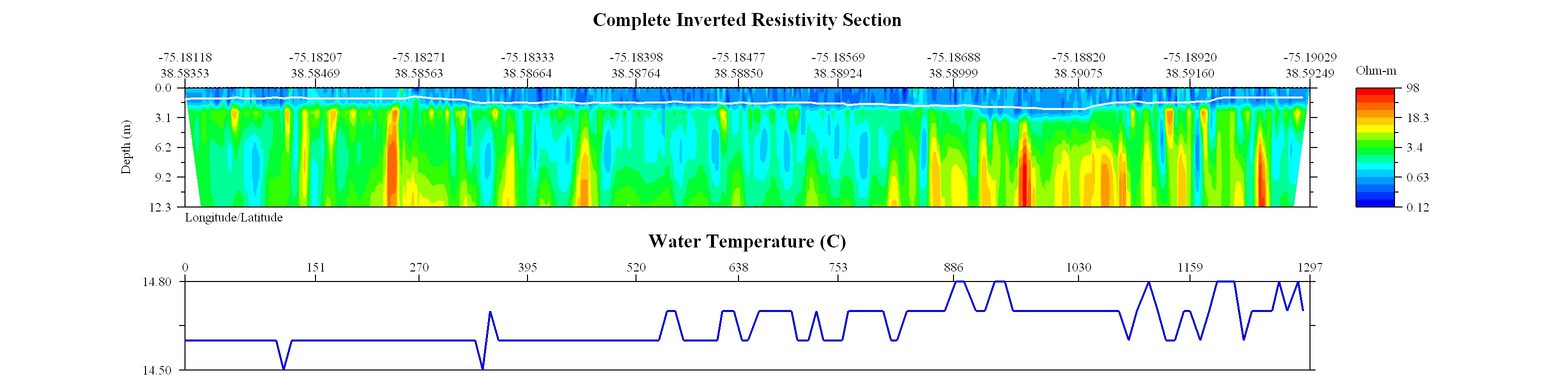
April 15, 2010: Line L22F1, WRES = 0.4222
EarthImager thumbnail JPEG image of line 22 resistivity and temperature profile.
Matlab thumbnail JPEG image of line 22 resistivity profile.
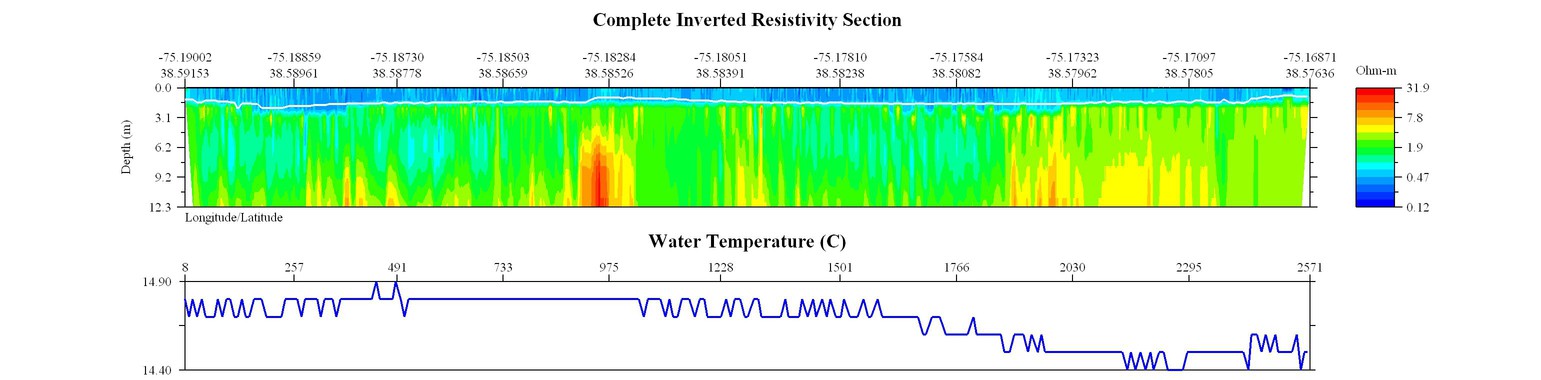
April 15, 2010: Line L23F1, WRES = 0.4182
EarthImager thumbnail JPEG image of line 23 resistivity and temperature profile.
Matlab thumbnail JPEG image of line 23 resistivity profile.
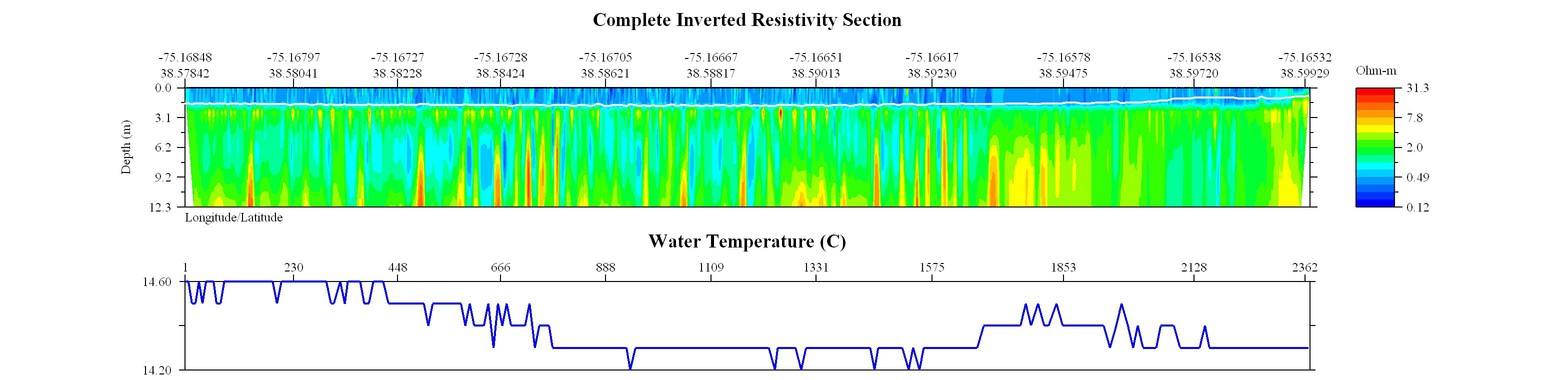
April 15, 2010: Line L24F1, WRES = 0.3985
EarthImager thumbnail JPEG image of line 24 resistivity and temperature profile.
Matlab thumbnail JPEG image of line 24 resistivity profile.
April 15, 2010: Line L25F1, WRES = 0.3668
EarthImager thumbnail JPEG image of line 25 resistivity profile.
Matlab thumbnail JPEG image of line 25 resistivity profile.
April 15, 2010: Line L26F1, WRES = 0.3591
EarthImager thumbnail JPEG image of line 26, file 1 resistivity profile.
Matlab thumbnail JPEG image of line 26, file 1 resistivity profile.
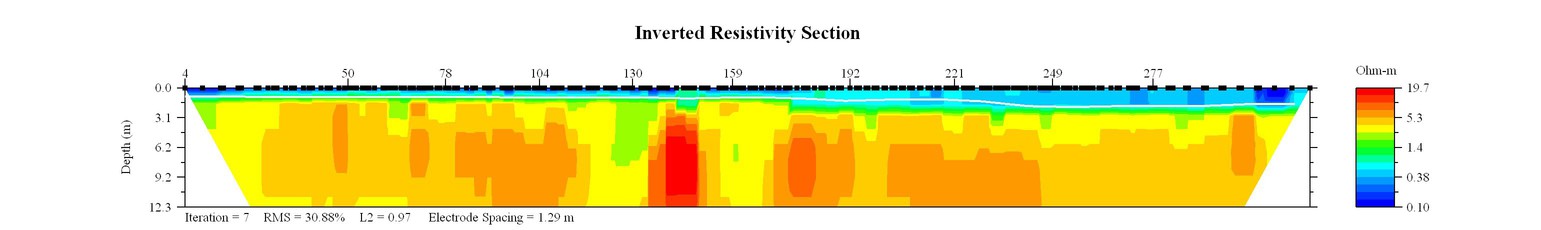
April 15, 2010: Line L26F2, WRES = 0.3567
EarthImager thumbnail JPEG image of line 26, file 2 resistivity and temperature profile.
Matlab thumbnail JPEG image of line 26, file 2 resistivity profile.
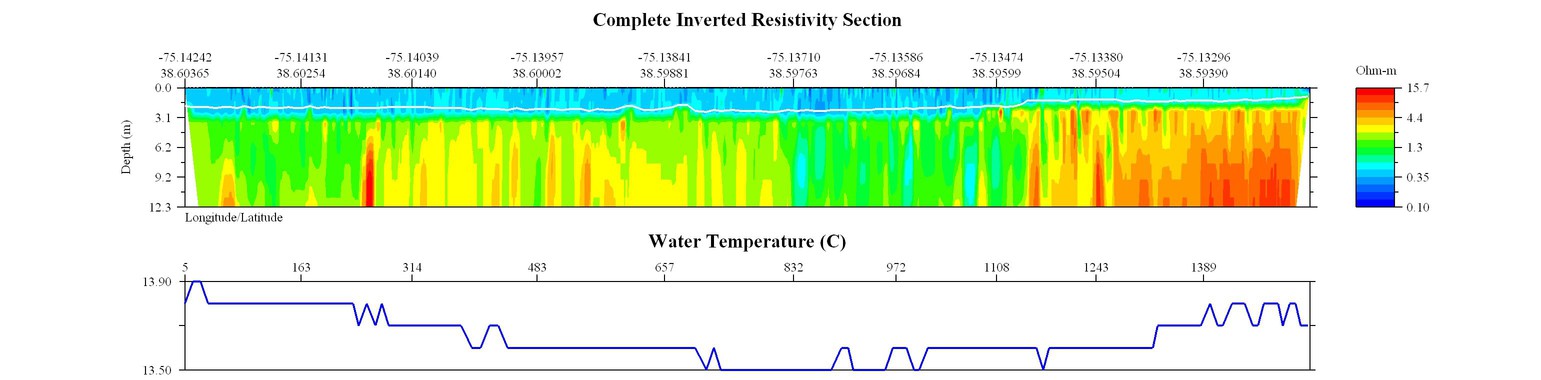
April 15, 2010: Line L27F1, WRES = 0.3443
EarthImager thumbnail JPEG image of line 27 resistivity and temperature profile.
Matlab thumbnail JPEG image of line 27 resistivity profile.
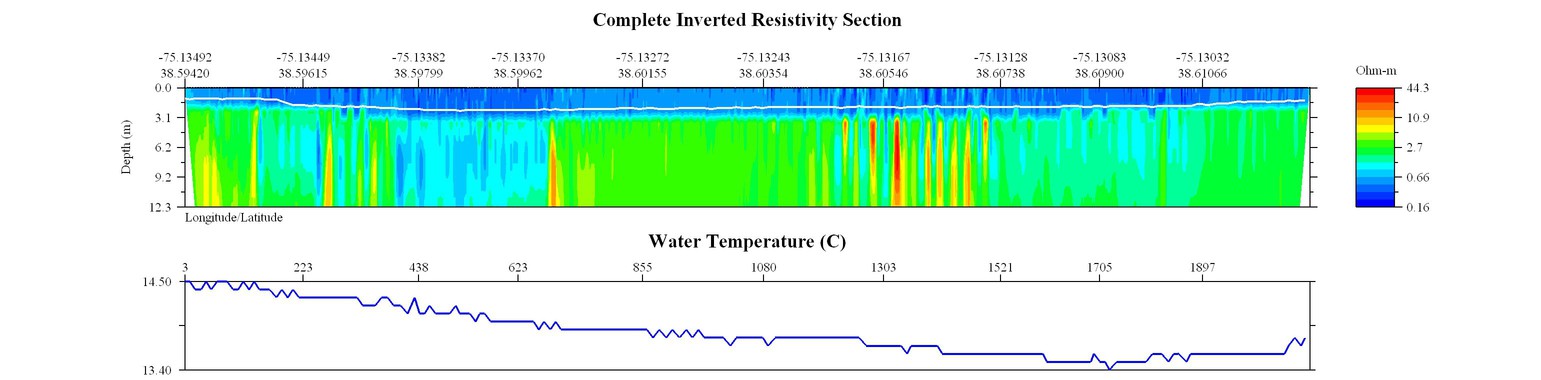
April 15, 2010: Line L28F1, WRES = 0.3442
EarthImager thumbnail JPEG image of line 28 resistivity and temperature profile.
Matlab thumbnail JPEG image of line 28 resistivity profile.
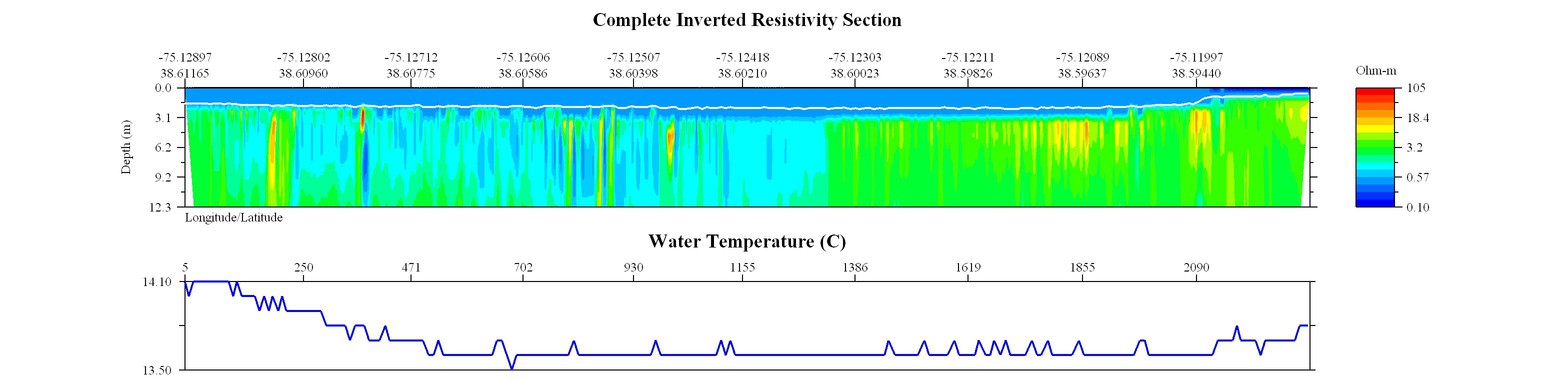
April 15, 2010: Line L29F1, WRES = 0.3312
EarthImager thumbnail JPEG image of line 29 resistivity and temperature profile.
Matlab thumbnail JPEG image of line 29 resistivity profile.
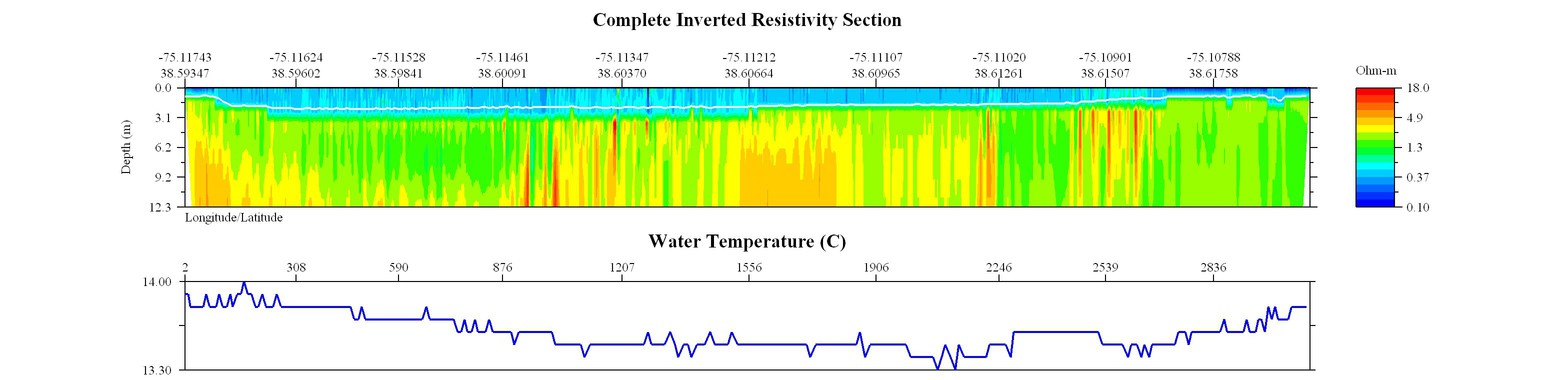
April 15, 2010: Line L30F1, WRES = 0.3288
EarthImager thumbnail JPEG image of line 30 resistivity and temperature profile.
Matlab thumbnail JPEG image of line 30 resistivity profile.
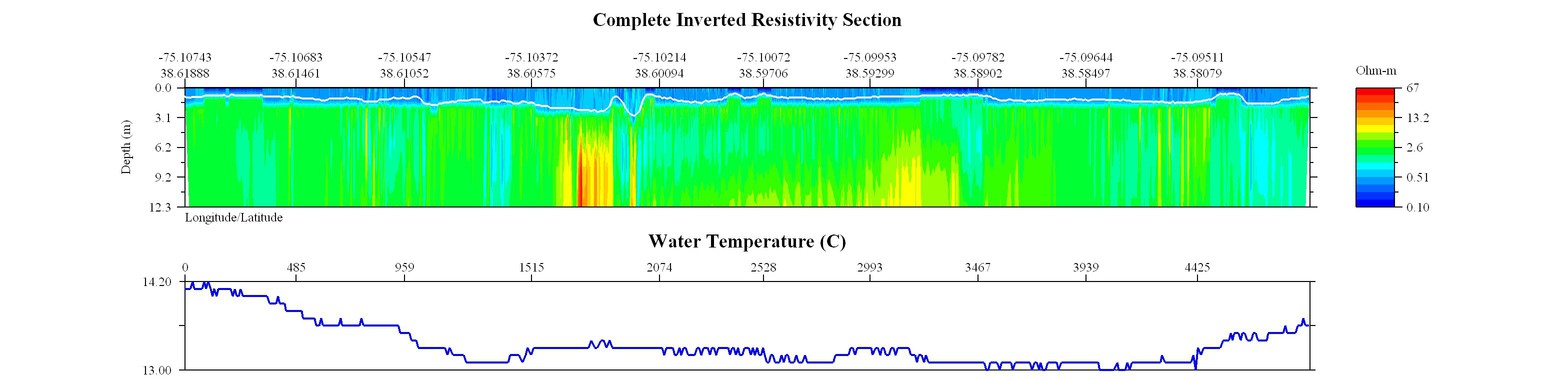
April 15, 2010: Line L31F1, WRES = 0.3242
EarthImager thumbnail JPEG image of line 31 resistivity and temperature profile.
Matlab thumbnail JPEG image of line 31 resistivity profiley.
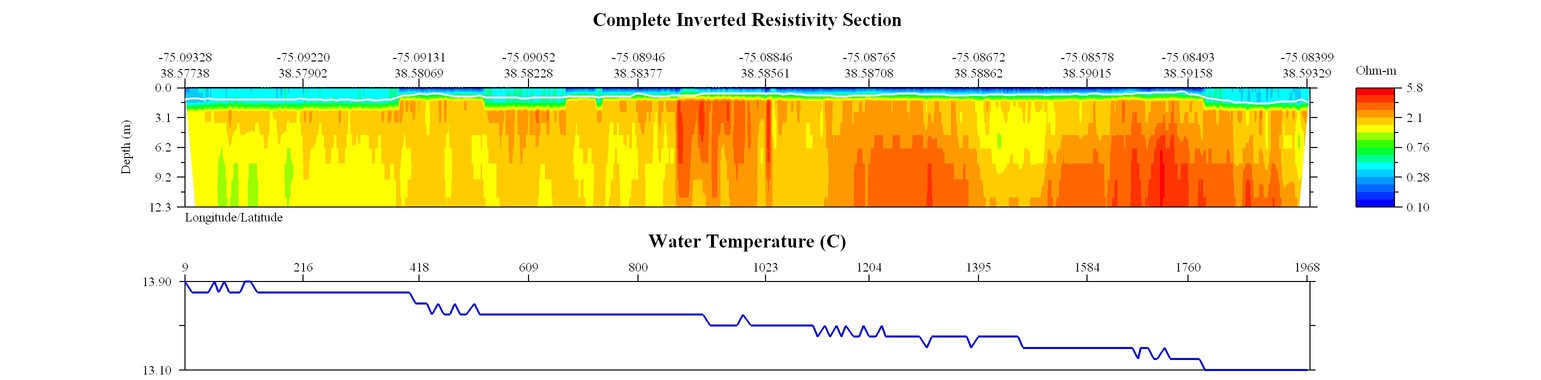
April 15, 2010: Line L32F1, WRES = 0.3430
EarthImager thumbnail JPEG image of line 32 resistivity and temperature profile.
Matlab thumbnail JPEG image of line 32 resistivity profile.
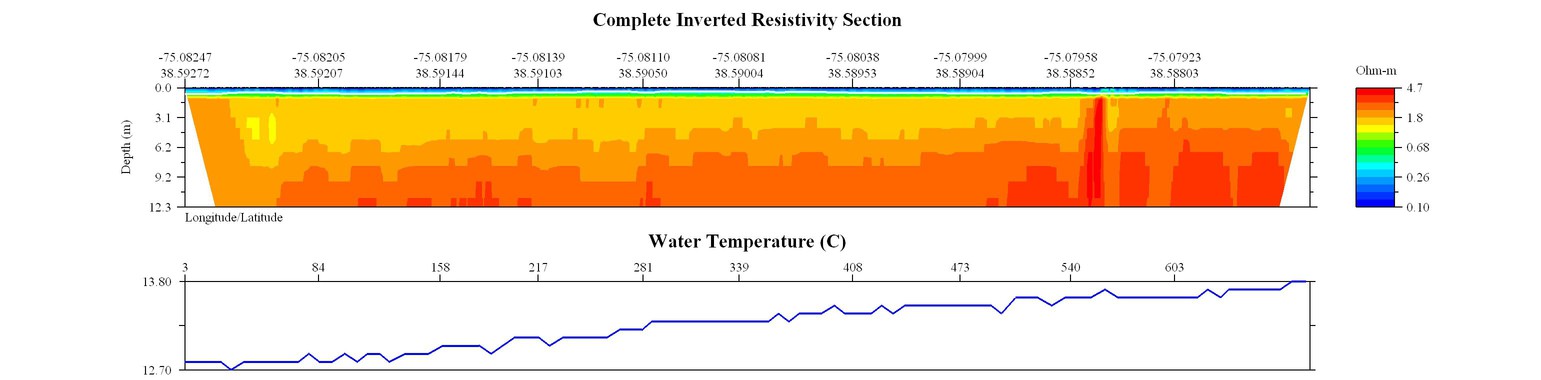
April 15, 2010: Line L33F1, WRES = 0.3194
EarthImager thumbnail JPEG image of line 33 resistivity and temperature profile.
Matlab thumbnail JPEG image of line 33 resistivity profile.
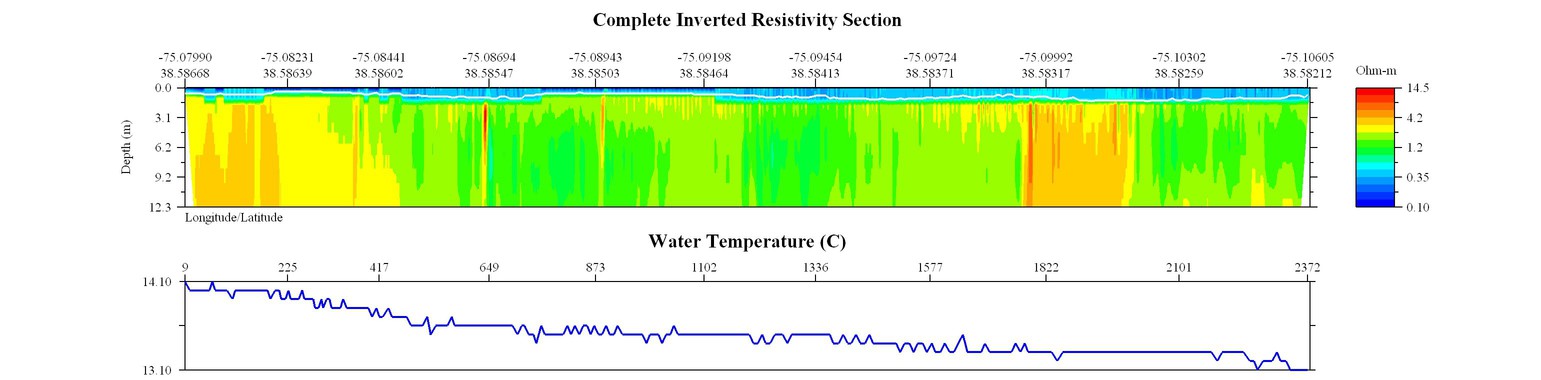
April 15, 2010: Line L35F1, WRES = 0.3261
EarthImager thumbnail JPEG image of line 35 resistivity and temperature profile.
Matlab thumbnail JPEG image of line 35 resistivity profile.
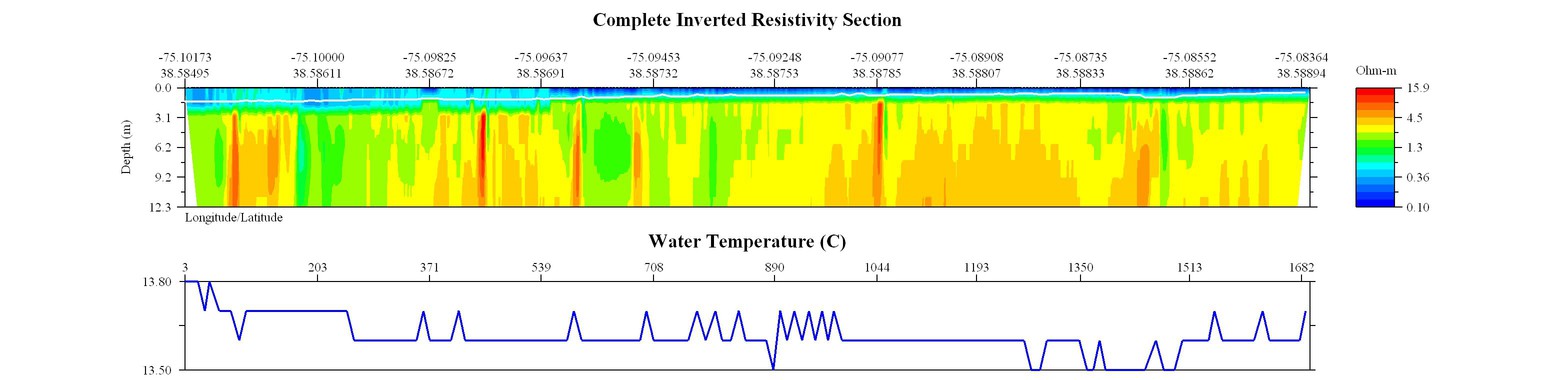
April 15, 2010: Line L36F1_a, WRES = 0.3297
EarthImager thumbnail JPEG image of line 36 a resistivity and temperature profile.
Matlab thumbnail JPEG image of line 36 a resistivity profile.
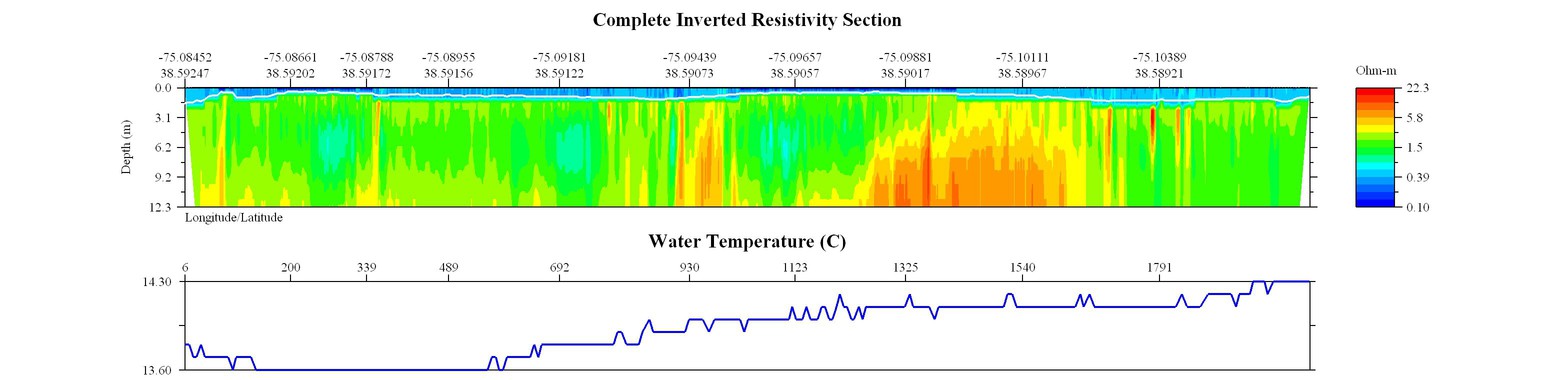
April 15, 2010: Line L36F1_b, WRES = 0.3352
EarthImager thumbnail JPEG image of line 36 b resistivity and temperature profile.
Matlab thumbnail JPEG image of line 36 b resistivity profile.
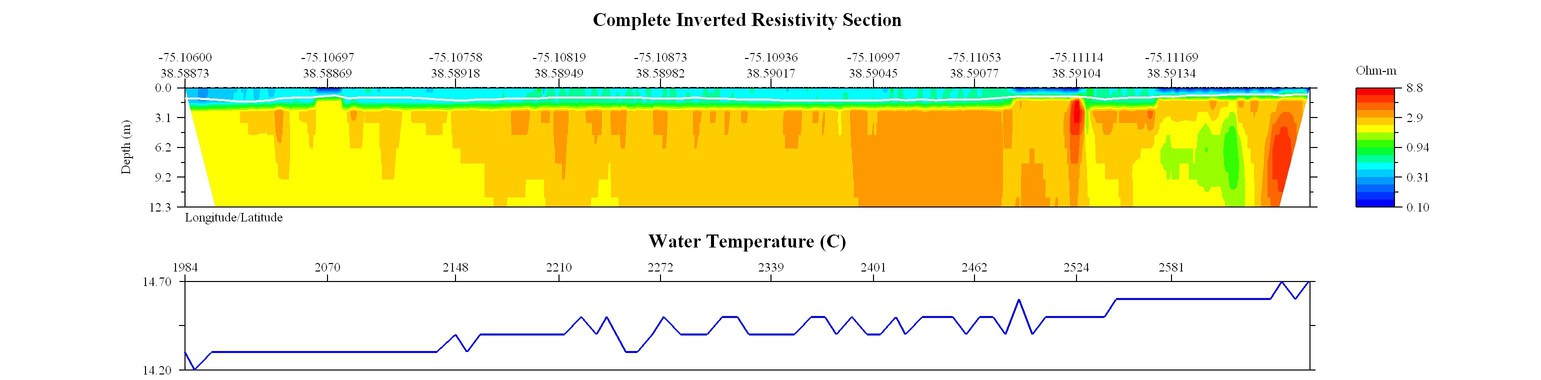
April 15, 2010: Line L37F2, WRES = 0.3260
EarthImager thumbnail JPEG image of line 37, file 2 resistivity and temperature profile.
Matlab thumbnail JPEG image of line 37, file 2 resistivity profile.
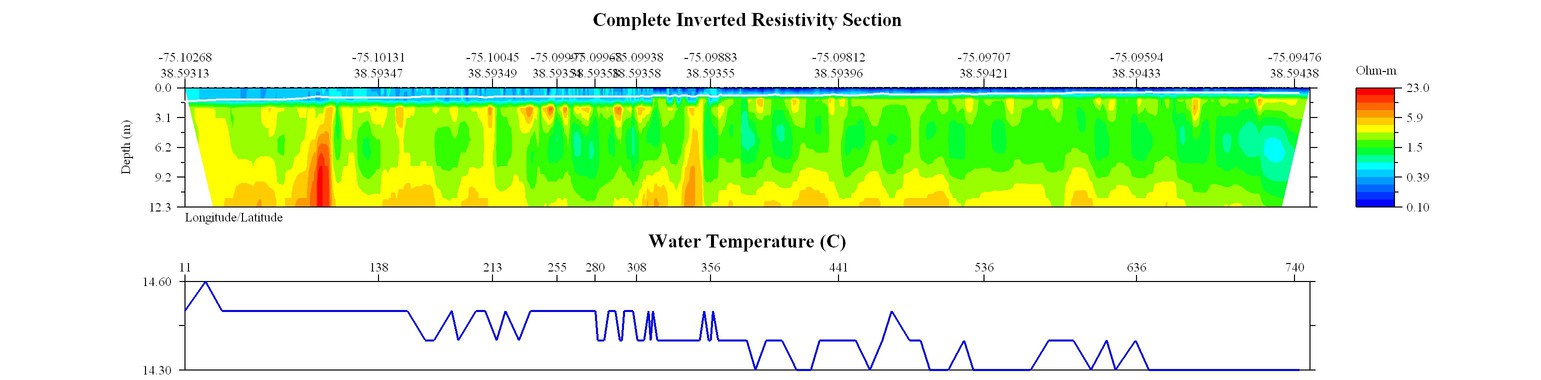
April 15, 2010: Line L38F1, WRES = 0.3495
EarthImager thumbnail JPEG image of line 38 resistivity and temperature profile.
Matlab thumbnail JPEG image of line 38 resistivity profile.
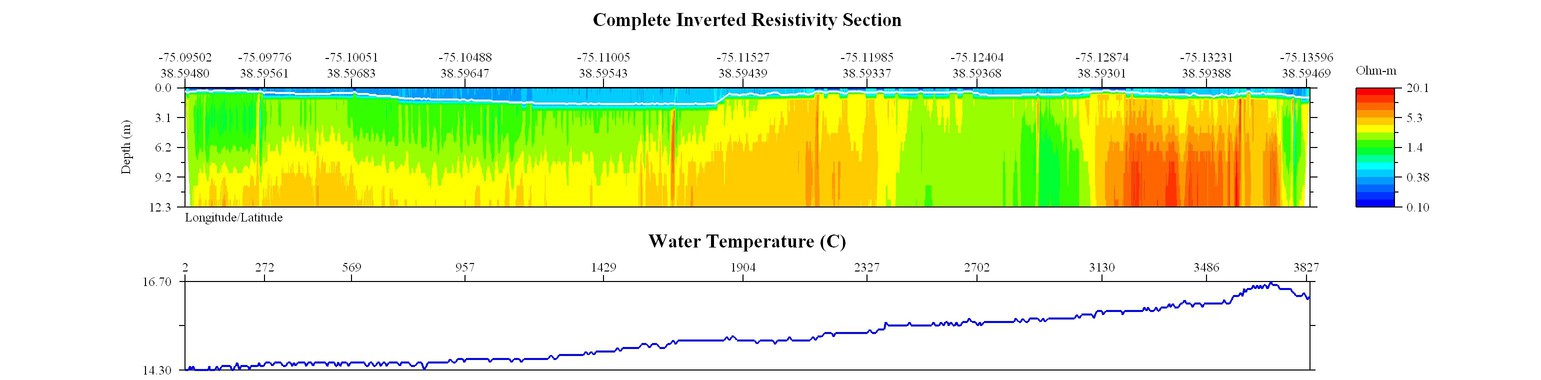
April 15, 2010: Line L38F1, water conductivity file
EarthImager thumbnail JPEG image of line 38 resistivity and temperature profile using continuous water conductivity file.
Matlab thumbnail JPEG image of line 38 resistivity profile using continuous water conductivity file.
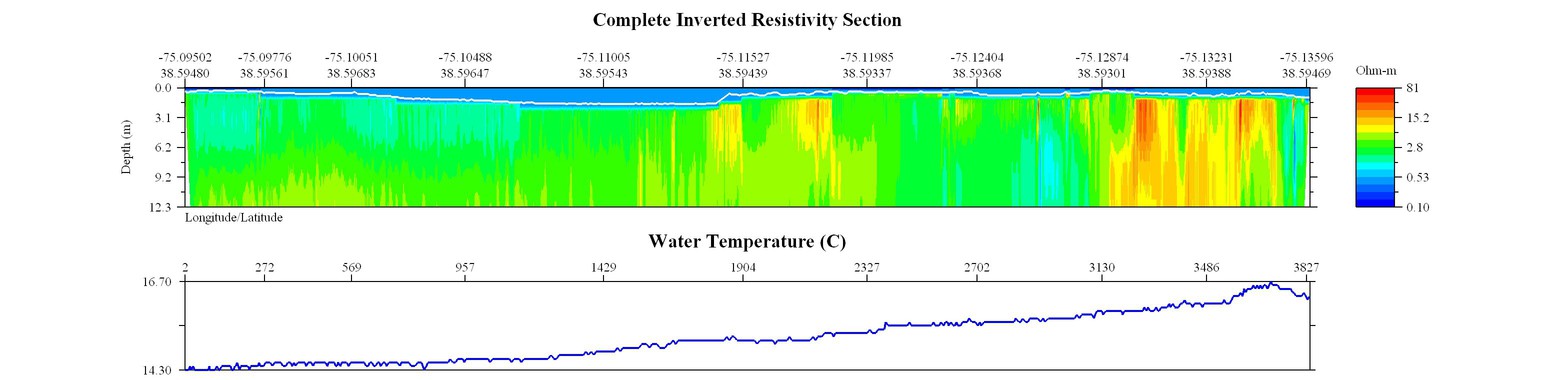
April 15, 2010: Line L39F1, WRES = 0.3605
EarthImager thumbnail JPEG image of line 39 resistivity and temperature profile.
Matlab thumbnail JPEG image of line 39 resistivity profile.
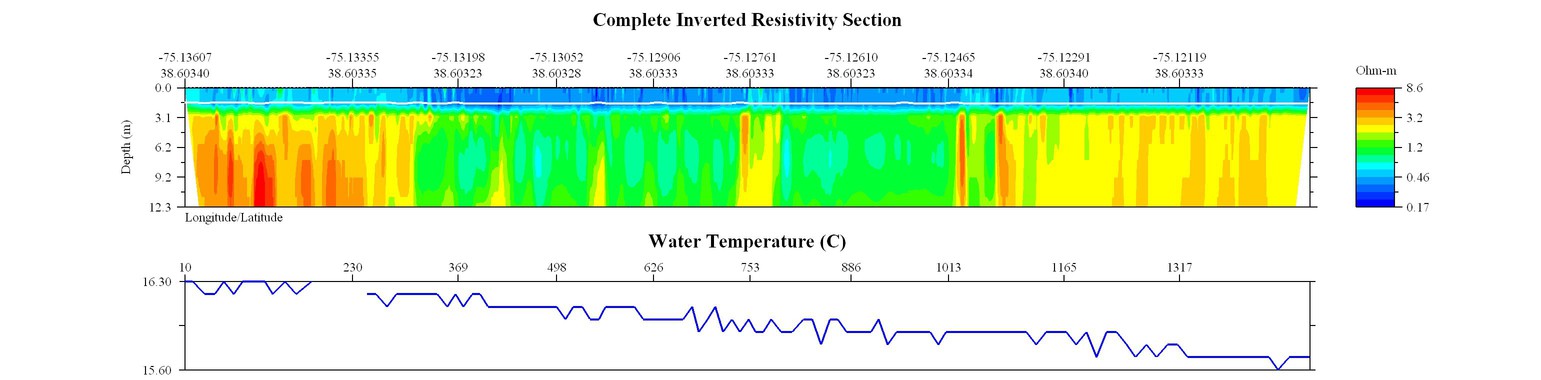
April 15, 2010: Line L40F1, WRES = 0.3498
EarthImager thumbnail JPEG image of line 40 resistivity and temperature profile.
Matlab thumbnail JPEG image of line 40 resistivity profile.
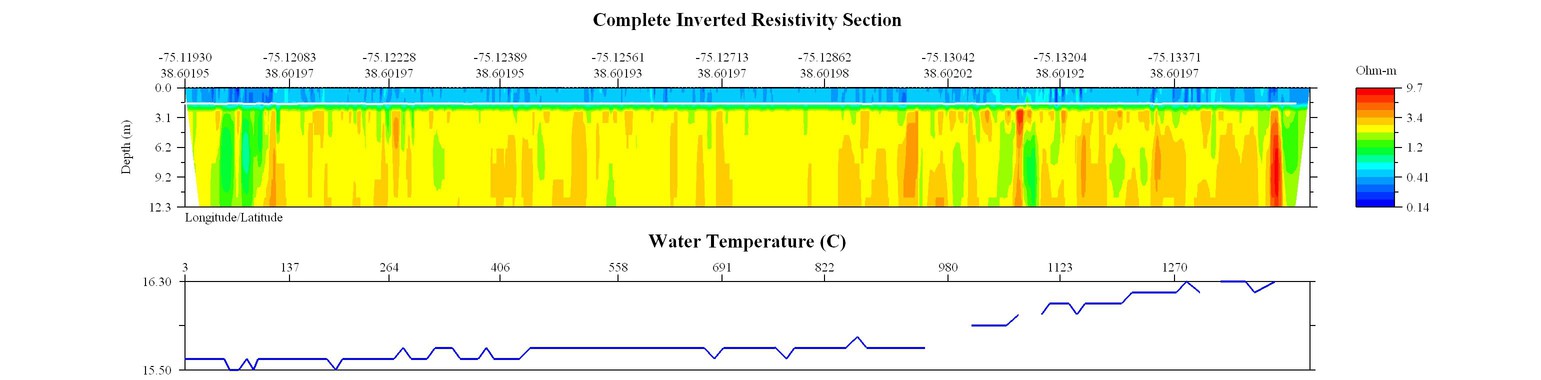
April 15, 2010: Line L41F1, WRES = 0.3525
EarthImager thumbnail JPEG image of line 41 resistivity and temperature profile.
Matlab thumbnail JPEG image of line 41 resistivity profile.
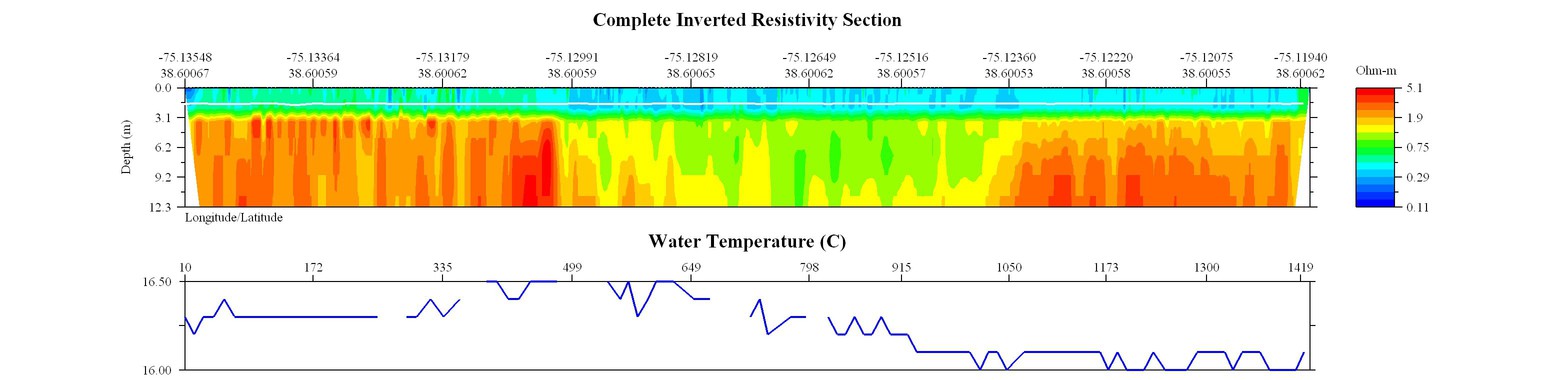
April 15, 2010: Line L42F1, WRES = 0.3714
EarthImager thumbnail JPEG image of line 42 resistivity and temperature profile.
Matlab thumbnail JPEG image of line 42 resistivity profile.
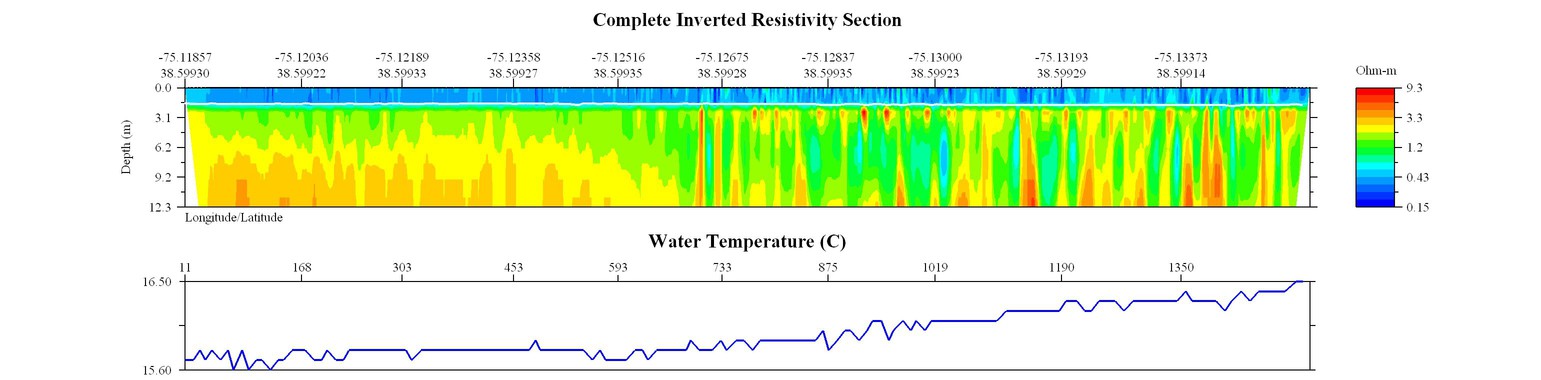
April 15, 2010: Line L43F1, WRES = 0.3573
EarthImager thumbnail JPEG image of line 43 resistivity and temperature profile.
Matlab thumbnail JPEG image of line 43 resistivity profile.
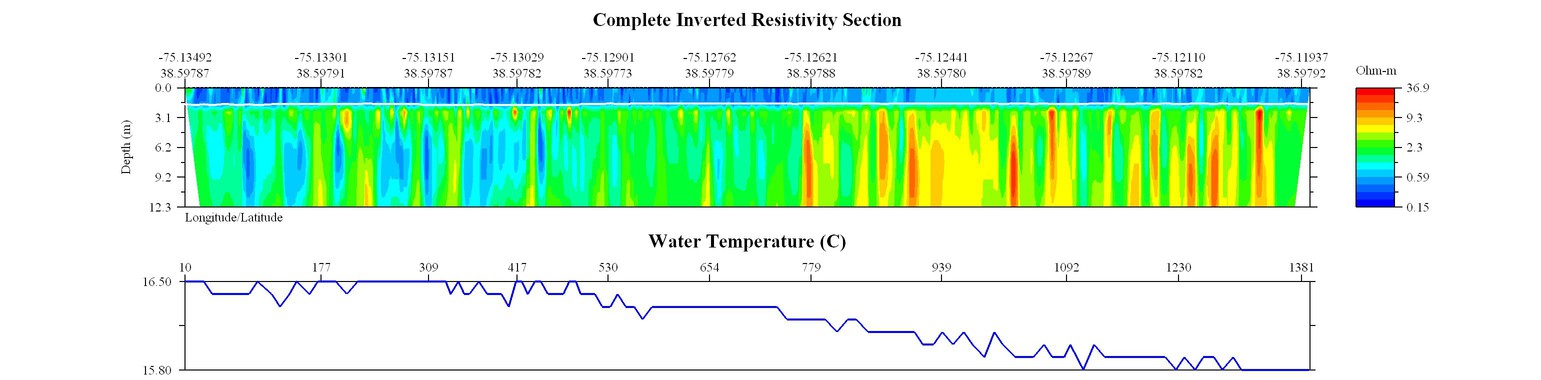
April 15, 2010: Line L44F1, WRES = 0.3592
EarthImager thumbnail JPEG image of line 44 resistivity and temperature profile.
Matlab thumbnail JPEG image of line 44 resistivity profile.
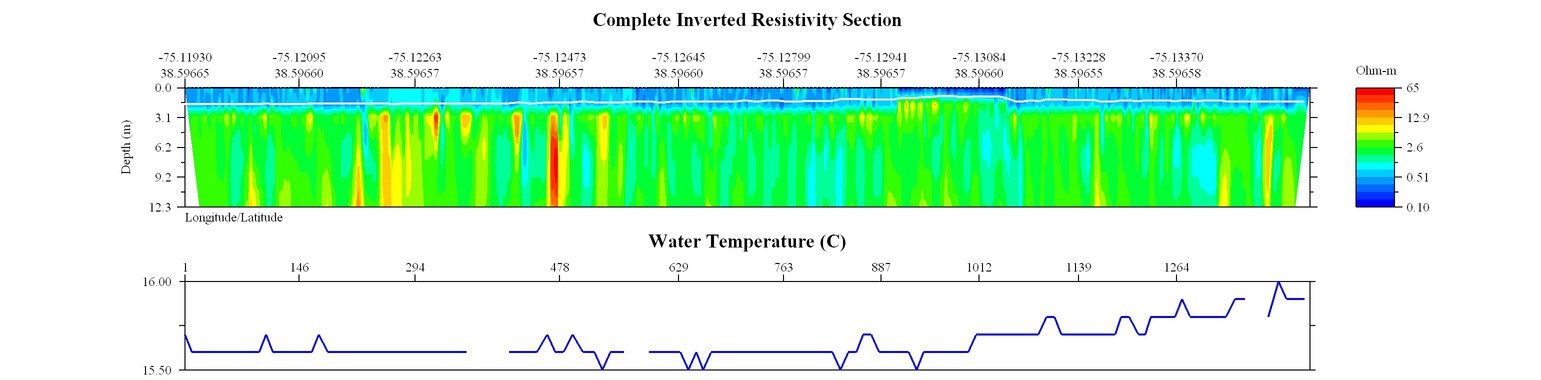
April 15, 2010: Line L45F1, WRES = 0.3743
EarthImager thumbnail JPEG image of line 45 resistivity profile.
Matlab thumbnail JPEG image of line 45 resistivity profile.
April 15, 2010: Line L46F2, WRES = 0.3741
EarthImager thumbnail JPEG image of line 46, file 2 resistivity profile.
Matlab thumbnail JPEG image of line 46, file 2 resistivity profile.
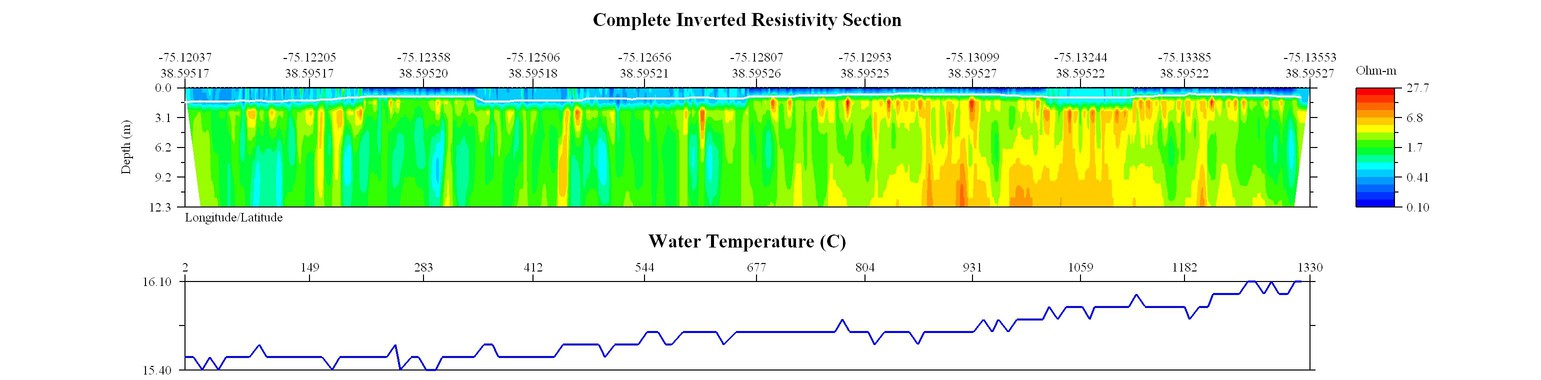
April 15, 2010: Line L47F1, WRES = 0.3972
EarthImager thumbnail JPEG image of line 47 resistivity and temperature profile.
Matlab thumbnail JPEG image of line 47 resistivity profile.
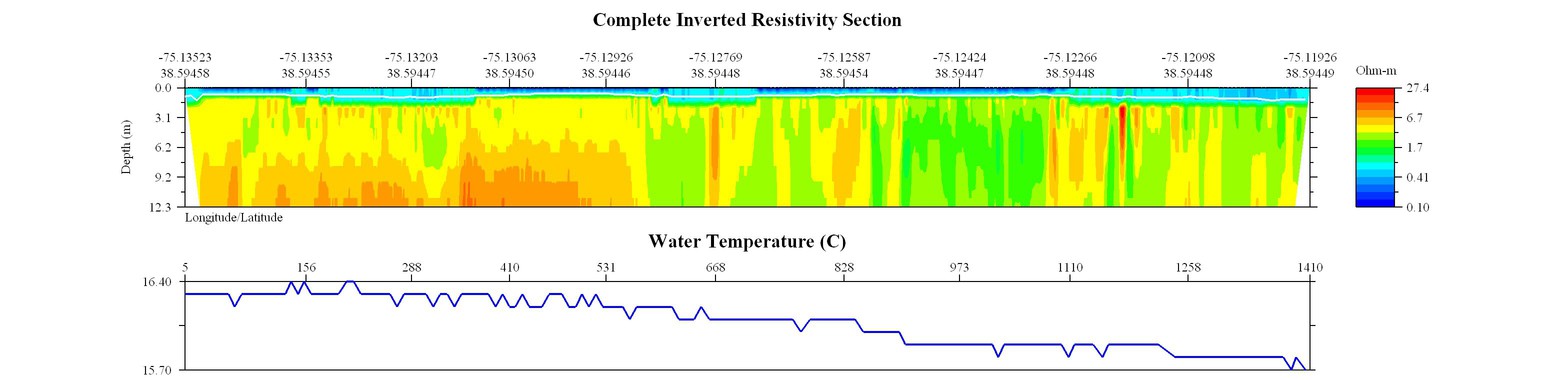
April 15, 2010: Line L48F1, WRES = 0.3585
EarthImager thumbnail JPEG image of line 48 resistivity and temperature profile.
Matlab thumbnail JPEG image of line 48 resistivity profile.
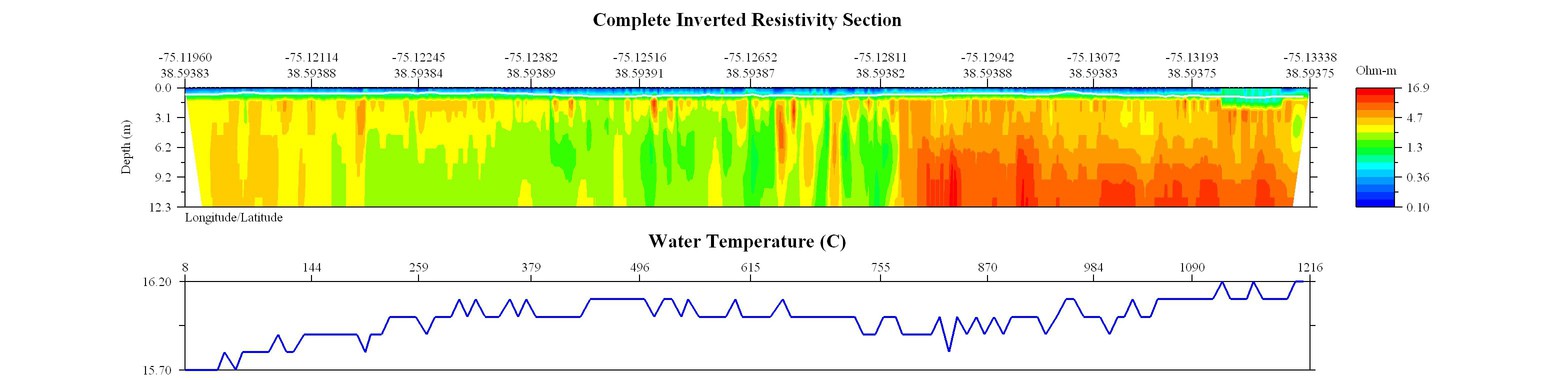
April 15, 2010: Line L49F1, WRES = 0.3531
EarthImager thumbnail JPEG image of line 49 resistivity and temperature profile.
Matlab thumbnail JPEG image of line 49 resistivity profile.
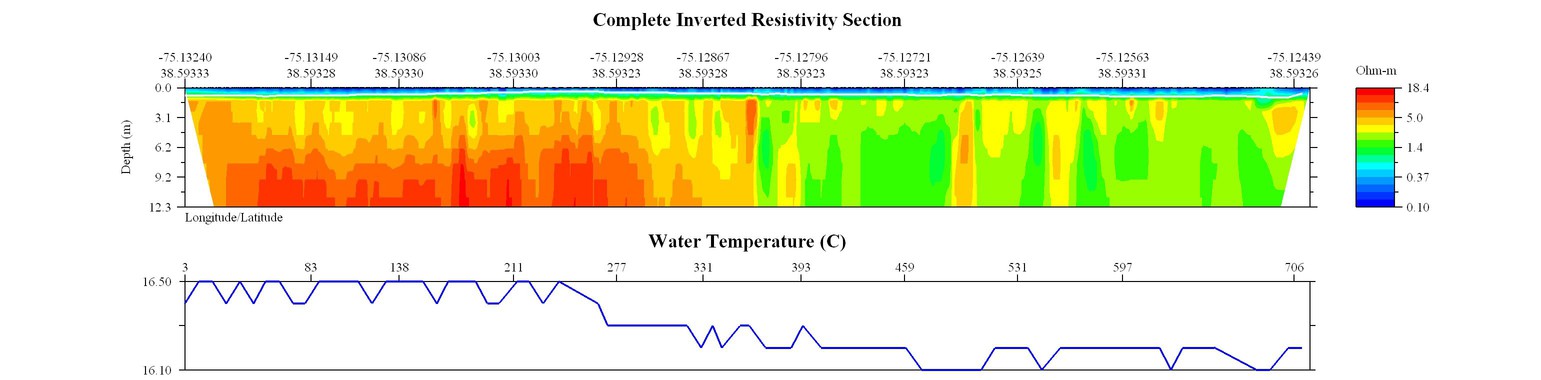
April 15, 2010: Line L50F1, WRES = 0.3325
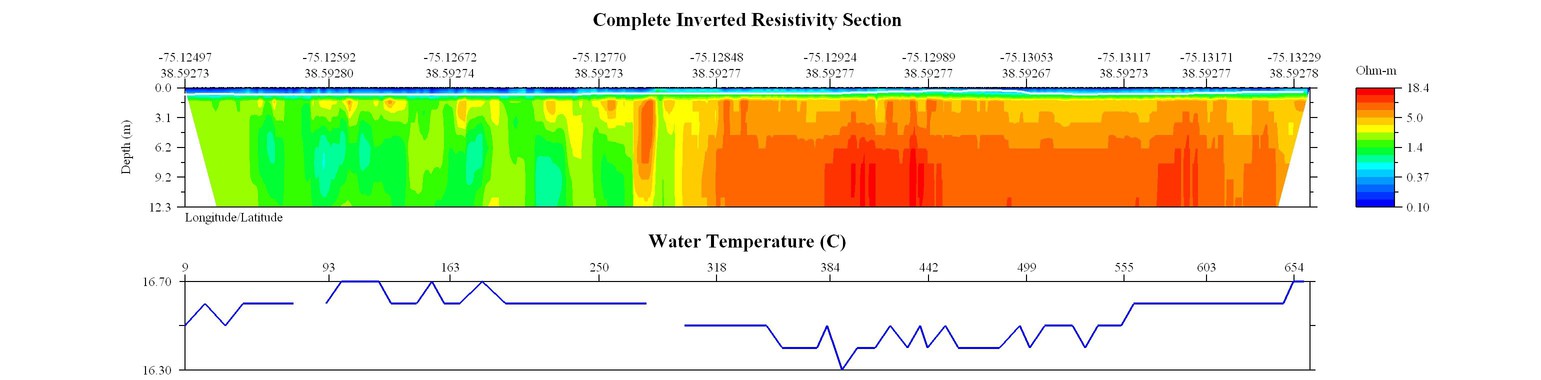
EarthImager thumbnail JPEG image of line 50 resistivity and temperature profile.
Matlab thumbnail JPEG image of line 50 resistivity profile.

Accessibility FOIA Privacy Policies and Notices

Take Pride in America logo USA.gov logo U.S. Department of the Interior | U.S. Geological Survey
URL: http://pubsdata.usgs.gov/pubs/of/2011/1039/html/ofr2011-1039-resistprev_apr15.html
Page Contact Information: GS Pubs Web Contact
Page Last Modified: Thursday, 24-Jul-2014 14:17:43 EDT

Link to line 22 EarthImager and MATLAB JPEG profiles. Link to line 21 EarthImager and MATLAB JPEG profiles. Link to line 23 EarthImager and MATLAB JPEG profiles. Link to line 24 EarthImager and MATLAB JPEG profiles. Link to line 26, file 1 EarthImager and MATLAB JPEG profiles. Link to line 25 EarthImager and MATLAB JPEG profiles. Link to line 26, file 2 EarthImager and MATLAB JPEG profiles. Link to line 28 EarthImager and MATLAB JPEG profiles. Link to line 291 EarthImager and MATLAB JPEG profiles. Link to line 20, file 2 EarthImager and MATLAB JPEG profiles. Link to line 36 a EarthImager and MATLAB JPEG profiles. Link to line 38 EarthImager and MATLAB JPEG profiles. Link to line 37, file 2 EarthImager and MATLAB JPEG profiles. Link to line 32 EarthImager and MATLAB JPEG profiles. Link to line 33 EarthImager and MATLAB JPEG profiles. Link to line 31 EarthImager and MATLAB JPEG profiles. Link to line 35 EarthImager and MATLAB JPEG profiles. Link to line 36 b EarthImager and MATLAB JPEG profiles. Link to line 39 EarthImager and MATLAB JPEG profiles. Link to line 40 EarthImager and MATLAB JPEG profiles. Link to line 41 EarthImager and MATLAB JPEG profiles. Link to line 42 EarthImager and MATLAB JPEG profiles. Link to line 43 EarthImager and MATLAB JPEG profiles. Link to line 44 EarthImager and MATLAB JPEG profiles. Link to line 45 EarthImager and MATLAB JPEG profiles. Link to line 46, file 2 EarthImager and MATLAB JPEG profiles. Link to line 47 EarthImager and MATLAB JPEG profiles. Link to line 48 EarthImager and MATLAB JPEG profiles. Link to line 27 EarthImager and MATLAB JPEG profiles. Link to line 29 EarthImager and MATLAB JPEG profiles. Link to line 49 EarthImager and MATLAB JPEG profiles. Link to line 50 EarthImager and MATLAB JPEG profiles.