U.S. Geological Survey Open-File Report 2012-1157
Shallow Geology, Seafloor Texture, and Physiographic Zones of the Inner Continental Shelf from Nahant to Northern Cape Cod Bay, Massachusetts

|
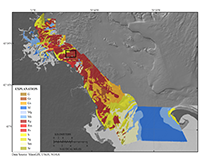
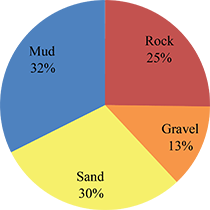
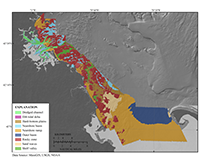
Sediment Texture and DistributionUsing the Barnhardt and others (1998) (fig. 10) and the Shepard (1954), as modified by Schlee (1973; fig. 11), classifications, sediment texture and distribution were mapped more than 1,000 square kilometers (km2; figs. 13 and 14). The data were generated at a scale between 1:8,000 and 1:25,000 depending on the resolution of the source geophysical grids and the sample data density. Sediments within the study area represent nearly all particle sizes. Sediment texture ranges from muddy sediments within Boston Harbor and Cape Cod Bay to pebbles, cobbles, and boulders in rocky areas of the inner shelf between Hull and Duxbury (figs. 13 and 14). There is no meaningful correlation between mean grain size and water depth within sediment texture polygons. Both coarse- and fine-grained sediment exist in all water depths; however, in general, fine-grained sediments are located in the deeper (greater than about 50 m), more quiescent environments of central Cape Cod Bay and Boston Harbor, and rocky textures are more prevalent along the nearshore margins of western Massachusetts and northern Cape Cod Bays (figs. 13 and 15). A mean sorting value of 1.63 suggests that the sediment is poorly sorted in the region, which is consistent with a reworked glacial environment. Sand is the dominant bottom sediment type for all sediment samples within the study area with laboratory grain size analysis information, representing more than 52 percent of sediment samples by weight. Sandy sediments are interpreted to cover 32 percent of the seafloor by area (fig. 16). Muddy sediments, which include silt and clay size particles less than 0.062 millimeter (mm) in diameter, represent an average of more than 43 percent of all sediment samples by weight and about 27 percent of the seafloor by area (fig. 16). Samples with the highest mud percentages were collected from Boston Harbor and north-central Cape Cod Bay. Sediment from the western margin of Massachusetts Bay is highly variable in terms of mud content, ranging from 0 percent to 70 percent mud with an average of 20 percent. Samples from dominantly rocky areas averaged only 2 percent mud. Gravel or particles greater than 2 mm (-1 phi) in diameter compose an average of 5 percent of all samples by weight, and are interpreted to be the primary sediment cover for 15 percent of the seafloor. Bottom photographs indicate that gravel content is underrepresented in the sediment sample data for this area. Photographs often document the occurrence of gravel and cobble in rocky areas where sediment samplers were unable to recover large-diameter particles. Primarily rocky areas are interpreted to cover about 26 percent of the seafloor by area, and are mostly present in western margins of Massachusetts and Cape Cod Bays (figs. 13 and 16). Physiographic ZonesAreal distribution of physiographic zones in the 1,000-km2 study area was generated at a scale of 1:12,000 to 1:25,000 depending on the resolution of the source geophysical grids. Following the classification of Kelley and others (1996), physiographic zones identified within the study area include rocky zones, outer basins, nearshore basins, hard-bottom plains, nearshore ramps, and shelf valleys. Three additional physiographic zones, sand waves, ebb-tidal delta, and dredged channel, were created to distinguish areas with large bedforms, depositional features associated with inlet mouths, and anthropogenically modified navigation routes, respectively. Outer basins are generally found in water depths greater than 40 meters and are of a fine texture, but may contain occasional rock outcrops. Outer basins are the most extensive single physiographic feature within the study area, making up the majority of northern and central Cape Cod Bay (fig. 17). By total area the outer basins are nearly 12 percent of the seafloor (fig. 18), and sediment samples within the outer basins range from sand to clayey silt, with muddy sediments being the primary texture. The surficial sediments of the outer basins can be characterized as Holocene marine muds that overlay glacial-marine and glacial-lacustrine muds (Oldale, 1988). Nearshore basins are areas of shallow, low-relief seafloor adjacent to the mainland, which are separated from offshore areas by islands or shoals. Nearshore basins make up more than 6 percent of the seafloor by area (fig. 18) and are interspersed along the inner shelf, usually adjacent to rocky zones. Surficial sediment samples within Nearshore Basins indicate that these features are filled with gravel to clayey silt and the composition is related to their location and the character of adjacent features, such that fine grained nearshore basins occur in and around Boston Harbor and Cape Cod Bay, whereas coarse grained nearshore basins lie along the margin of western Massachusetts Bay. Ebb-tidal deltas are lobate sandy shoals found on the seaward side of tidal inlets that form through the interaction of waves and ebb-tidal currents. There is only one ebb-tidal delta (1 percent of the seafloor) within the study area at the mouth of the North River. These young depositional features form at the mouth of rivers where fluvial and nearshore sediments are reworked by tidal currents and waves. The ebb-tidal delta at the mouth of the North River primarily comprises sand. Hard-bottom plains tend to have low bathymetric relief, with a coarse sediment texture consisting of primarily gravel, sand, and rock. Hard-bottom plains account for about 5 percent of the seafloor within the study area and are concentrated in western Massachusetts Bay in intermediate water depths (15–30 m) (fig. 17). Nearshore ramps are areas of gently sloping seafloor with generally shore-parallel bathymetric contours. This zone is primarily covered with sand-rich sediment, although small exposures of cobbles and boulders locally crop out on the seafloor. Nearshore ramps are most often gently sloping seaward extensions of mainland beaches within the study area. As such, they most often comprise sand and gravel with occasional subordinate concentrations of silt or rock. Nearshore ramps are found off Revere Beach, Hull, Humarock, and Duxbury and Plymouth Bay and are the largest physiographic zone by area (about 40 percent of the seafloor within the study area) (figs. 17 and 18). Sand waves are features developed by currents over the seafloor and may comprise gravel to fine sand. Sand waves make up about 3 percent of the seafloor by area and are concentrated east of Brant Rock in water depths generally between 20 and 30 m (figs. 17 and 18). These areas are characterized by large abundant bedforms (tens to hundreds of meters in wavelength) comprising sand and gravel. Shelf valleys are elongated depressions that extend offshore often perpendicular to the trend of the coastline, and slope gently seaward. Shelf valleys represent less than 3 percent of the study area, but subbottom data suggest that numerous shelf valleys exist in Cape Cod Bay partially buried beneath Holocene marine mud. These features are interpreted to be valleys formed by fluvial erosion during periods of lower than present sea level. Dredged channels are anthropogenic features where the seafloor has been modified to accommodate navigation. Dredged channels occur within Boston Harbor and are primarily filled with gravel, sand, and muddy sediments (figs. 17 and 18). StratigraphyFive primary seismic stratigraphic units and three major erosional unconformities were interpreted and mapped within the seismic survey area (fig. 6). Two interpretive geologic cross sections illustrate the general distributions and thicknesses of the seismic units and elevations of the unconformities along the western margin of the inner shelf (northwest to southeast) and across northern Cape Cod Bay (northeast to southwest) (fig. 7). The seismic units were correlated with previous USGS seismic-stratigraphic interpretations by Oldale and Bick (1987), Rendigs and Oldale (1990), and Oldale and O’Hara (1990) for western Massachusetts Bay, Boston Harbor, and Cape Cod Bay, respectively. Although the closely spaced, high-resolution, chirp seismic-reflection profiles used for interpretation in this study were particularly useful for mapping relatively shallow, Holocene subsurface units, they did not consistently provide adequate penetration for reliable mapping of the deep Pleistocene and pre-Quaternary units. For this reason, discussion of the pre-Holocene stratigraphy mostly relies on the interpretations of Oldale and Bick (1987) and Oldale and O’Hara (1990), which were based on more widely spaced, but deep-penetrating Uniboom seismic data and vibracores. Pz(?)/Tcp(?)/Qt(?), the lowermost stratigraphic unit, is identified by the major erosional unconformity, U1, which defines its upper surface (fig. 7). Chirp seismic data typically were unable to penetrate beneath this surface and provided little information regarding the seismic character of the unit. Pz(?)/Tcp(?)/Qt(?)is shallowest along the western margin of the inner shelf, where bedrock crops out locally in the nearshore, and deepens to the east (figs. 7 and 8). We infer from the interpretations of Oldale and Bick (1987) and Oldale and O’Hara (1990) that Pz(?)/Tcp(?)/Qt(?) mostly consists of pre-Quaternary units (fig. 6). The oldest components are probably bedrock (Pz?), seaward extensions of the consolidated crystalline, volcanic, and sedimentary rocks of Precambrian to Paleozoic age that underlie the adjacent mainland. Locally, the bedrock is overlain by eroded remnants of unconsolidated, coastal-plain deposits (Tcp?) that are Late Cretaceous to Tertiary in age. Thin deposits of Pleistocene glacial till and coarse drift (Qt?) may also locally overlie the pre-Quaternary units. U1 is a composite unconformity that was shaped at least in part by subaerial and fluvial erosion that occurred during Jurassic, Early Cretaceous, and middle Tertiary times, as well as glacial erosion during two or more Pleistocene glacial episodes. The U1 surface generally deepens to the east, eventually exceeding the penetration limit of the seismic data; however, in certain places, U1 also merges with the late Wisconsinan regressive (Ur) and Holocene transgressive (Ut) unconformities (fig. 7). Four stratigraphic units overlying Pz(?)/Tcp(?)/Qt(?) are interpreted to represent Quaternary sedimentary deposits (fig. 6). Qd is the oldest unit and is identified by Ur, which generally defines its surface (fig. 7). Chirp seismic penetration into Qd varied spatially, and the deepest records were obtained in areas where younger, overlying units were thinnest. Seismic character within Qd commonly consists of vertically laminated, roughly horizontal to broadly undulating reflectors or zones of near acoustic transparency (fig. 19). Vertical stacking of these seismic signatures separated by unconformities is indicative of internal sub-units within Qd. The Qd unit is thinnest along the western margin of Massachusetts Bay where it is locally absent and generally thicker to the east and south beneath Massachusetts and Cape Cod bays (figs. 7 and 8). We infer that Qd correlates with the thick (as much as 120 m), primarily late Wisconsinan, glacial-drift units described by Oldale and Bick (1987) and Oldale and O’Hara (1990). They distinguished three sub-units within the stratified glacial drift—Qdl, Qgm, Qa (fig. 6). Qgm is the second subunit, lies stratigraphically adjacent to Qdl beneath Massachusetts Bay and the northwest corner of Cape Cod Bay, and primarily comprises mud with minor lenses of sand and gravel. Deposition of Qgm is interpreted to have occurred after the ice front receded north of Provincetown, while the sea submerged the increasingly ice-free, yet isostatically depressed region. Glacial-marine sediments were delivered to the sea by submarine and subaerial melt-water flows sourced by the retreating ice (fig. 19). Qa, the youngest subunit, is primarily sandy and overlies parts of Qdl and Qgm within north-central Cape Cod Bay and south-central Massachusetts Bay. Qa is thought to represent nonglacial, submarine, mass flow, and (or) fluvial (deltaic) deposition that occurred when the ice front had receded north to Boston or beyond. Ur marks the elevation of the late Wisconsinan regressive unconformity (figs. 19 and 20). Insufficient penetration due to water depth and overlying sediment thickness prohibited its identification across a substantial part of eastern Cape Cod Bay. Ur generally deepens from west to east, and its elevation ranges between approximately –3 and –73 m (NAVD 88). The unconformity clearly illustrates a complex network of fluvial valleys incised into the Qd surface across western and central Cape Cod Bay (figs. 8 and 20). The fluvial incision is less extensive and generally shallower along the western margin of the survey area where drift cover is relatively thin to absent across the more resistant, underlying pre-Quaternary surface. As a result, Ur merges with U1 and Ut over much of this part of the study area (fig. 7). Ur was shaped while the region became subaerially exposed during the late Wisconsinan, when this part of the margin isostatically rebounded in delayed response to unloading of the glacial ice at a rate that outpaced eustatic sea-level rise. The remaining three Quaternary stratigraphic units overlying Pz(?)/Tcp(?)/Qt(?) and Qd are interpreted to represent Holocene sedimentary deposits (fig. 6). Ut, which generally defines the surface of Qfe, formed as coastal waves and currents broadly truncated Qfe and older adjacent units along the inner shelf and shoreline during the ongoing Holocene transgression. The elevation of Ut ranges between approximately –3 and –64 m (NAVD 88) and generally deepens to the northeast (fig. 24). Morphologically, Ut is rather low relief beneath most of Cape Cod Bay, illustrating the effectiveness of transgressive ravinement across the Qd and Qfe units; however, subtle linear depressions on this part of the unconformity indicate slight preservation of the broader antecedent fluvial valley topography. This could indicate that Qfe sediments are slightly less resistant and eroded to greater depths than the adjacent Qd units, or simply that Qfe deposition was only sufficient to subdue the antecedent topography of the paleodrainage systems. Along the western margin of the inner shelf, Ut is more rugged where it merges with U1 and Ur over broad areas where Pz(?)/Tcp(?)/Qt(?) and Qd crop out on the seafloor (figs. 8 and 24). Qmn and Qmd are posttransgressive Holocene sediments recognized as two distinct stratigraphic units overlying Ut (figs. 6 and 8). The Qmn and Qmd units produce similar seismic signatures, typically consisting of faint, vertically laminated, horizontal reflectors or near acoustic transparency (figs. 22 and 23); however, they are readily distinguished based on their texture and location on the inner shelf. Qmn deposits are predominantly sandy with varying proportions of gravel and mud, and mostly restricted to Nearshore Ramps on the inner shelf. They are thickest along western Cape Cod Bay adjacent to Duxbury and Plymouth bays, where they form low-relief, shore-oblique ridges and bars as much as 13 m thick (figs. 2 and 25). Qmn thins substantially northward along the coast between Duxbury and Hull, where it is essentially absent with the exception of several isolated pockets along the coastline (figs. 7 and 25). These nearshore deposits have formed along the landward-migrating shoreline as coastal waves, and currents have eroded and reworked sediments from the underlying stratigraphic units during the ongoing Holocene transgression. Qmd deposits are mostly muddy with varying proportions of sand, and are generally confined to Outer Basin parts of Cape Cod Bay that are deeper than 45 m. Qmd is thickest in the southeastern part of the survey area, locally exceeding 16 m, and thins northward toward the mouth of the bay, and towards its eastern and western margins (figs. 7 and 25). These sediments were also derived through erosion and reworking of the underlying stratigraphic units, but due to their fine grain size, they have been transported by currents over long distances, and eventually concentrated in the deep parts of the bays. |
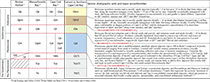
Figure 6. Seismic stratigraphic units and major unconformities interpreted within Boston Harbor by Rendigs and Oldale (1990), Massachusetts Bay by Oldale and Bick (1987), Cape Cod Bay by Oldale and O’Hara (1990), and between Nahant and northern Cape Cod Bay in this study.
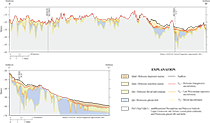
Figure 7. Geologic cross sections (B–B′ and C–C′) illustrating the general distributions and thicknesses of seismic stratigraphic units and elevations of major unconformities beneath the Massachusetts inner shelf between Nahant and northern Cape Cod Bay. Geologic cross sections are interpreted from chirp seismic reflection profiles. Vertical scale is elevation in meters from the North American Vertical Datum of 1988. Solid vertical black line denotes bend in section, and dashed vertical black lines indicate intersections. See figure 6 for descriptions of stratigraphic units and unconformities. Geologic section locations are identified on figure 8. 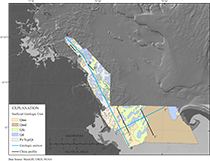 Figure 8. Surficial geologic map of the Massachusetts inner shelf between Nahant and northern Cape Cod Bay. The areal extents over which subsurface geologic units crop out at the seafloor were interpreted from seismic-reflection data. Detailed descriptions of the primary geologic units are figure 6. Qmn, Holocene nearshore marine sediments; Qmd, Holocene deepwater marine sediments; Qfe, Holocene fluvial and estuarine sediments; Qd, undifferentiated Pleistocene glacial drift sediments; Pz(?)/Tcp(?)/Qt(?), undifferentiated Paleozoic bedrock, late Cretaceous to Tertiary coastal plain sediments, or Pleistocene glacial tills. Holocene sediment veneers too thin to be detected in the seismic-reflection data (less than about 0.5 meter) may overlie outcrops of pre-Holocene units (blue and gray areas) locally. The locations of geologic cross sections B-B' and C-C' (fig. 8) are indicated by cyan lines, and the locations of chirp seismic-reflection profiles A-A', D-D', E-E', and F-F' are indicated by black lines.
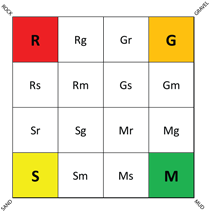
Figure 10. Barnhardt and others (1998) bottom-type classification based on four basic sediment units: rock (R), gravel (G), sand (S), and mud (M). Twelve additional two-part units represent combinations of the four basic units, where the primary texture (more than 50 percent of the area) is given an upper case letter and the secondary texture (less than 50 percent of the area) is given a lower case letter.
Figure 11. Sediment classification scheme by Shepard (1954), as modified by Schlee (1973) and McMullen and others (2011).
Figure 13. The distribution of sediment textures within the study area from Nahant to northern Cape Cod Bay. The bottom-type classification is from Barnhardt and others (1998) and is based on 16 sediment classes, where the first letter in the legend is the primary sediment unit (more than 50 percent) and the second letter is the secondary sediment unit (less than 50 percent). The classification is based on four easily recognizable sediment units that include gravel (G), mud (M), rock (R), and sand (S) (fig. 11). The black rectangle is indicating the location of figure 15.
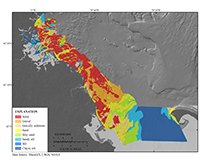
Figure 14. The distribution of sediment textures based on a modified Shepard (1954) and Schlee (1973) classification within the study area from Nahant to northern Cape Cod Bay. The classification used here is based on eight units, which include solid (for rocky substrates), gravel, gravelly sediment, sand, sandy silt, silty sand, silt, and clayey silt.
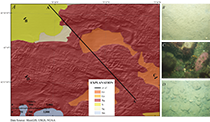
Figure 15. A, Sediment textures within an approximately 3-by-2-kilometer area in western Massachusetts Bay (see fig. 13 for location). The location of seismic profile A–A′ from figure 5 is shown; the lines B, C, and D indicate where the photographs in B, C, and D were taken. B, A photograph of the sea floor within an area classified as sand (S). C, A photograph of a section of sea floor classified as primarily rock with some gravel (Rg). D, A photograph from a section of sea floor classified as primarily gravel with some rock (Gr). The viewing frame for photographs B, C, and D is approximately 50 centimeters.
Figure 16. The chart shows the percentage of each primary sediment unit within the study area. %, percent.
Figure 17. The distribution of physiographic zones within the study area from Nahant to Northern Cape Cod Bay. The physiographic zone classification is based on Kelley and others (1996), and the zones are delineated based on sea-floor morphology and the dominant texture of surficial material.
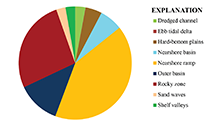
Figure 18. Chart showing the relative percentage of each physiographic zone within the study area.
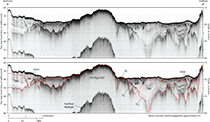
Figure 19. Chirp seismic-reflection profile D–D′ with seismic stratigraphic interpretation. This profile illustrates the stratigraphy beneath western Massachusetts Bay offshore of Scituate, Massachusetts, where a relatively broad depression in the oldest composite fluvial unconformity (U1) is filled by Pleistocene glaciomarine (Qgm) and overlying Holocene fluvial and estuarine (Qfe) sediments. See figure 6 for descriptions of stratigraphic units and major unconformities (indicated by red lines). See figure 8 for profile location. A constant sound velocity of 1,500 meters per second wasused to convert two-way travel time to depth in meters.
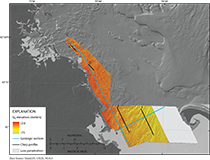
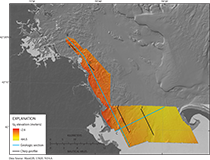
Figure 20. Map showing the elevation (from the North American Vertical Datum of 1988) of the late Wisconsinan regressive unconformity Ur, which identifies the truncated surface of Pleistocene glacial drift (Qd) and older adjacent units beneath the Massachusetts inner shelf between Nahant and northern Cape Cod Bay. The grey shaded area indicates where Ur was not identified and mapped due to insufficient seismic penetration. Ur represents a composite unconformity where it locally merges with the oldest fluvial unconformity (U1), Holocene transgressive unconformity (Ut), or both (fig. 7). The locations of geologic cross sections B-B' and C-C' (fig. 8) are indicated by cyan lines, and the locations of chirp seismic-reflection profiles A-A', D-D', E-E', and F-F' are indicated by black lines.
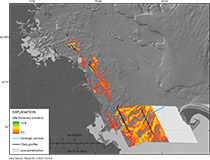
Figure 21. Map showing the thickness of Holocene fluvial and estuarine (Qfe) sediments beneath the Massachusetts inner shelf between Nahant and northern Cape Cod Bay. The grey shaded area indicates where Qfe thickness could not be evaluated due to insufficient seismic penetration to adequately map the underlying Ur surface. The locations of geologic cross sections in figure 8 are indicated by cyan lines, and locations of chirp seismic-reflection profiles are indicated by black lines.
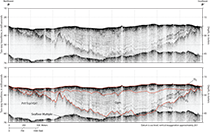
Figure 22. Chirp seismic-reflection profile E–E′ with seismic stratigraphic interpretation. This profile illustrates the stratigraphy beneath northern Cape Cod Bay offshore of Duxbury Beach and Plymouth Bay, Massachusetts, where two depressions in the oldest composite fluvial unconformity (U1), located on either side of a broad outcrop, are filled by a succession of Pleistocene glaciolacustrine (Qdl), Holocene fluvial and estuarine (Qfe), and Holocene nearshore marine (Qmn) sediments. See figure 6 for descriptions of stratigraphic units and major unconformities (indicated by red lines). See figure 8 for profile location. A constant sound velocity of 1,500 meters per second was used to convert two-way travel time to depth in meters.
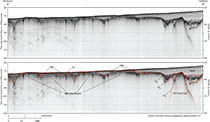
Figure 23. Chirp seismic-reflection profile F–F′ with seismic stratigraphic interpretation. This profile illustrates the stratigraphy beneath northern Cape Cod Bay offshore of Duxbury Beach and Plymouth Bay, Massachusetts, seaward of profile E–E′ in figure 22. Deep fluvial channels incised into the surface of thick glaciolacustrine (Qdl) sediments are filled with Holocene fluvial and estuarine (Qfe) deposits. The truncated Qd and Qfe units are broadly exposed at the seafloor to the northwest, but buried beneath increasingly thick Holocene deepwater marine (Qmd) sediments to the southeast. See figure 6 for descriptions of stratigraphic units and major unconformities (indicated by red lines). See figure 8 for profile location. A constant sound velocity of 1,500 meters per second was used to convert two-way travel time to depth in meters.
Figure 24.
|

![]() U.S. Department of the Interior |
U.S. Geological Survey
U.S. Department of the Interior |
U.S. Geological Survey
URL: http://pubsdata.usgs.gov/pubs/of/2012/1157/html/results.html
Page Contact Information: GS Pubs Web Contact
Page Last Modified: Friday, 16-Aug-2013 11:53:40 EDT