U.S. Geological Survey Open-File Report 2012-1157
Shallow Geology, Seafloor Texture, and Physiographic Zones of the Inner Continental Shelf from Nahant to Northern Cape Cod Bay, Massachusetts

|
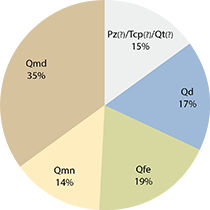
High-resolution geophysical data at dense seafloor coverage provide a previously unavailable means of viewing and delineating seafloor morphology. Interpretations of high- resolution geophysical data combined with ground truth information (sample data) have produced geologic interpretations at unprecedented resolutions and are superior to maps produced from sample information alone or widely spaced survey data. Each of the interpretations produced in this study contributes insight to the evolution and environments on the inner continental shelf between Nahant and northern Cape Cod Bay and can be used as layers for mapping marine habitats and resources. The following section outlines our confidence in the interpretations, some of the limitations, and indicates how these data interface to create an in-depth look at the seafloor and shallow subsurface in the region. Confidence and Limitation in InterpretationsSeismic-reflection data did not extend through Boston Harbor and its approaches on the westernmost edge of Massachusetts Bay, or within an offshore, triangular-shaped part of the study area located between Scituate and Marshfield, Massachusetts (figs. 1 and 4). As a result, surficial geology polygons derived from the seismic data interpretations are not as extensive as the sea-floor sediment and physiographic zone polygons that encompassed the bathymetry and acoustic-backscatter datasets (figs. 2 and 3). Because all data input sources were not available in all parts of the study area, qualitatively defined polygons of sediment texture were assigned a data interpretation confidence value between 1 and 4 based on the quality and number of data sources (fig. 26). Sediment texture regions that were defined based on the highest resolution bathymetry (5 m) and backscatter (1 m), bottom photographs, sediment samples, and seismic interpretations were given the highest data interpretation confidence value of 1. Areas with a confidence value of 1 include the Duxbury to Hull and northern Cape Cod Bay geophysical and sample data areas published by Barnhardt and others (2010) and Andrews and others (2010), respectively. Areas where sediment texture was defined based on bathymetry of 30-m resolution, backscatter of 1-m resolution, bottom photographs, and sediment samples, but no seismic data were assigned an interpretation confidence value of 2. Confidence 2 was assigned to the Boston Harbor and approaches geophysical and sample data area published by Ackerman and others (2006). A confidence value of 3 was given to areas with multibeam bathymetry and backscatter data of 10-m resolution and sediment samples, but no bottom photographs or high-density seismic interpretations were available. The data confidence 3 area is located offshore of Marshfield, Mass., generally in water depths greater than 20 m, where multibeam data were collected for Massachusetts Bay and Stellwagen Bank National Marine Sanctuary (Butman and others, 2007). The lowest confidence values (4) were given to nearshore areas (typically shallower than 5 m), where only lidar data of 2.5-m resolution (and near full coverage) and sediment samples were available. Limitations associated with qualitative interpretations exist because the scale of the source geophysical data and the spacing of samples do not capture all changes in seafloor texture. The data were mapped between 1:8,000 and 1:25,000, but the recommended scale for application of these data is greater than 1:25,000. In general, features below 5,000 square meters (m2) or less than 50 m wide were not digitized due to positional uncertainty, lack of sample information, and the often ephemeral nature of small-scale seafloor features. Not all digitized seafloor features contained sample information; therefore, the seafloor character often is determined by the nearest similar feature that contains a sample. Conversely, sometimes a digitized feature contained multiple samples and not all of the samples within the feature were in agreement (of the same texture). In these cases, the dominant sediment texture within the polygon was chosen. Samples from rocky areas often only consist of bottom photographs because large particle size often precludes the recovery of a sediment sample. Bottom photograph classification based on interpretation is subjective, such that determining the dominant sediment type within the view frame is estimated by the interpreter and may differ among interpreters. Bottom photograph transects often reveal changes in the seafloor over distances of less than 100 m and these changes are often not observable in acoustic data. Heterogeneous seafloor texture can change quickly, and many small-scale changes will not be detectable or mappable at a scale of 1:25,000. The boundaries of polygons are often inferred based on sediment samples, and even boundaries that are traced based on amplitude or rugosity changes in geophysical data are subject to migration. Polygon boundaries should be considered an approximation of the location of a change in texture. Sediment ClassificationThe Barnhardt and others (1998) classification is considered the best representation of sea-floor texture for this study area due to the complex nature and heterogeneity of sea-floor material and the scale at which these data are mapped. This system works well for inner-shelf environments where one sediment unit is generally inadequate for representing sea-floor texture, such as the New England coast, where reworked tills and rocky pavements are common. We could not apply the full complexity of the Shepard (1954), as modified by Schlee (1973), ternary classification to our data due to variable input resolutions and sample densities. Instead, we applied a modified scheme limited to the gravel, sand, sandy-silt, silty-sand, and clay classes, with the addition of a ‘solid’ class to encompass rocky areas. Our sample-data spacing and geophysical-data resolution typically did not support the discrimination between clayey sand, silty sand, and sand silt clay. For example, a large (nearly 240-km2) muddy area of uniformly low backscatter and low slope in northern and central Cape Cod Bay was digitized and classified as silt because the randomly spaced sediment samples within the area indicated that the sea floor comprised 56 percent clayey silt, 15 percent silt, 15 percent sandy silt, and 10 percent silty sand (fig. 14). In the absence of additional sediment samples to further resolve distribution of the fine grain sizes, the prudent solution was to aggregate the area to its common class and rely on the continuity of the backscatter signature. Integrating the InterpretationsEach subsurface stratigraphic unit composes some part of the seafloor in the survey area (fig. 8), and the areal distribution of the units is closely related to the surficial sediment distribution and physiographic zone interpretations. Geologic units either directly crop out at the seafloor or are buried beneath surficial sediments too thin to be detected in the seismic data (less than about 0.5 m). Outcrops of Pz(?)/Tcp(?)/Qt(?) are most extensive along the nearshore of western Massachusetts Bay, and account for roughly 15 percent of the seafloor by area (fig. 27). They generally correspond to rocky zones and hardbottom plains, where the most common sediment textures are Rg and Gr. Qd crops out throughout western Massachusetts Bay and along the eastern and western margin of northern Cape Cod Bay. Dominant surficial sediment textures associated with Qd include R, G, and S. Sandy Qd seafloor textures occur primarily within Cape Cod Bay. Qd is associated with rocky zones, nearshore and outer basins, and hardbottom plains physiographic zones. Qfe crops out across roughly 20 percent of the study area and is primarily associated with S and G sediment textures that coincide with shelf valleys, nearshore ramps, nearhsore basins, and hardbottom plains. Qmn and Qmd blanket half of the study area, and Qmn is concentrated in the nearshore of Massachusetts and northern Cape Cod bays, while Qmd is wholly within central and eastern Cape Cod Bay. Qmn has dominant sediment textures of S and G, and is associated with nearshore ramps and basins. Qmd has a dominant sediment texture of M with subordinate S, and is located in the outer basin. Seafloor geologic composition and sediment texture are most variable along the western margin of Massachusetts Bay north of Brant Rock, where exposures of Qd and Qfe are interspersed in complex patterns among relatively abundant and broad outcrops of Pz(?)/Tcp(?)/Qt(?). The complicated outcrop patterns are controlled by the shallow and rugged antecedent topography of the underlying pre-Quaternary surface, which only accommodated relatively thick Quaternary deposition within its depressions (fig. 8). The outcrop patterns likely evolved during the Holocene transgression, where truncation of the inner shelf has reduced the areal extent of Quaternary units and further exposed the pre-Quaternary surface. The only mappable accumulations of Qmn across this part of the survey area are restricted to several narrow zones near the coast. To the southeast, outcrops of Pz(?)/Tcp(?)/Qt(?) become progressively narrower and more isolated along the western margin of northern Cape Cod Bay. The inner shelf adjacent to Duxbury and Plymouth bays is otherwise dominated by Qmn, with limited exposures of underlying Qd and Qfe units occurring adjacent to Pz(?)/Tcp(?)/Qt(?) outcrops where Qmn sediments are thin or absent. Farther bayward, Qd and Qfe are the dominant seafloor units, and they form sublinear to sinuous outcrop patterns that clearly illustrate their relation as valley-fill deposits and adjacent interfluves (figs. 7, 19, and 21). Throughout the central and eastern parts of northern Cape Cod Bay, Qmd dominates the seafloor, except for an area adjacent to Provincetown where Qd units are capped by a small accumulation of Qmn that extends bayward from the Provincetown recurved spit. Comparison between the spatial distributions of outcropping geologic units and seafloor sediment textures provides additional insight concerning seafloor composition and the physical processes that have affected regional sediment textural trends (figs. 8, 13, and 15). As would be expected, the coarsest textures (Rg, Rs, and Gr) are most prevalent along the western margin of Massachusetts Bay, where outcrops of Pz(?)/Tcp(?)/Qt(?) are relatively expansive. Textures generally fine to the south and east into deep parts of Massachusetts and northern Cape Cod bays. Adjacent to Duxbury and Plymouth bays, sandy Qmn sediments are most common, and coarse zones are centered on isolated outcrops of Pz(?)/Tcp(?)/Qt(?). As Qmn sands thin bayward (fig. 22), seafloor textures transition to interfingered zones of predominantly sandy and muddy sediments across the seafloor outcrops of Qfe valley fills and Qd glaciolacustrine interfluves. Fining continues into the basin, where Qmd muds dominate. Farther east, textures coarsen slightly up the slope of the eastern margin from muds to sands toward the northeast and nearshore around the Provincetown recurved spit. Knebel and Circe (1995), Knebel and others (1996), and Bothner and others (2007) suggest that textural distributions are primarily a function of regional variability in geologic composition and coastal oceanographic processes between the shallow-margin and deep basin areas of Boston Harbor, Massachusetts Bay, and Cape Cod Bay. Their analyses of atmospheric and oceanographic data showed that waves and currents, primarily driven by northerly storms between late fall and early spring, tend to preferentially erode, rework, and winnow the seafloor along the shallow margins of the bays, force southward circulation and sediment transport along their eastern and western margins, and preferentially redistribute fine-grained sediments to the south and deep parts of the bays. Although the high-energy environment of the western margin of Massachusetts Bay is primarily a function of the shallow subsurface presence of the pre-Quaternary surface and relatively thin to absent Quaternary sediment cover, the preferential effect of strong waves and currents causes this part of the shelf to be erosional or nondepositional, and undoubtedly maintains or accentuates this seafloor character. As fine-grained sediments are episodically winnowed from the outcropping surfaces of relatively finer-grained Qd-glaciomarine and Qfe-valley-fill units, they become armored by concentrated lags of coarser material, which is probably augmented by clasts liberated and mobilized from adjacent Pz(?)/Tcp(?)/Qt(?) outcrops. Indeed, despite being generally located within zones classified as having coarse surface character, several vibracores reported by Oldale and Bick (1987) recovered predominantly clayey and sandy material from as much as 12 m into the subsurface. The southward and basinward fining of sediment textures down the transitional slopes of the bay margins indicates that progressively finer grain sizes are transported over progressively greater distances. It appears that sandy sediments (S) are primarily concentrated across the slopes of the bay margins in areas that Knebel and Circe (1995) and Knebel and others (1996) classified as zones of sediment reworking, and we have mapped progressions from Qmn sand ridges and shoals to outcrops of Qd glaciolacustrine and Qfe valley fills. The striking correlation between sublinear patterns of seafloor sediment texture and relatively sharp contacts between outcrops of Qd glaciomarine and Qfe valley fills on the margin slope of northeast and north-central Cape Cod Bay provides indirect evidence of reduced wave and current effect on the seafloor. The thick and widespread blanket of marine muds across the deepest parts of the bays indicates that oceanographic conditions are typically quiescent and conducive to deposition. Similar quiescent conditions generally exist within Boston Harbor, which is protected from much of the storm-driven wave and current energy produced in adjacent Massachusetts Bay. Fine-grained sediment deposited in the harbor are winnowed from glacial drift deposits within the bay and delivered to the bay from small upland tributaries. |
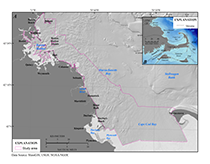
Figure 1.A, Location map of the study area from Nahant to northern Cape Cod Bay, Massachusetts and B, map of eastern Massachusetts showing the moraines associated with the Laurentide ice sheet. The outline in A is drawn based on the extent of the physiographic zones and surficial sediment texture maps. The approximate moraine locations are modified from Ridge (2004). BBM, Buzzards Bay Moraine; BSM, Billingsgate Shoal Moraine; CR, Chicopee Readvance Moraine; FPM, Fresh Pond Moraine; SM, Sandwich Moraine; TM, terminal moraine through Martha’s Vineyard and Nantucket.
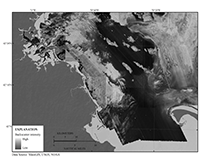
Figure 2. A composite backscatter image at 10-meter resolution was created from a series of published backscatter images (table 1). Areas of high backscatter have strong acoustic reflections and suggest boulders, gravels, and generally coarse seafloor sediments. Low backscatter areas have weak acoustic reflections and are generally finer grained material such as muds and fine sands. 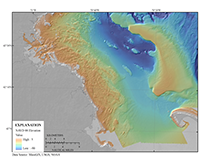
Figure 3. A digital elevation model (DEM) was produced from swath interferometric, multibeam bathymetry, and lidar at 30-meter resolution (table 1). High rugosity and high relief are most often associated with rocky areas, whereas smooth, low relief regions tend to be blanketed by fine-grained sediment deposits. NAVD 88, North American Vertical Datum of 1988. 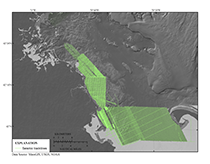
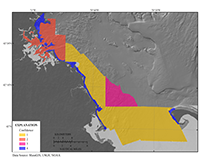
Figure 4. Map showing tracklines of chirp seismic-reflection profiles from Andrews and others (2010) and Barnhardt and others (2010) used to interpret surficial geology and shallow stratigraphy.
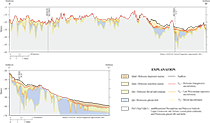
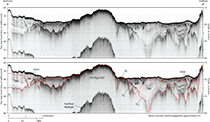
Figure 7. Geologic cross sections (B–B′ and C–C′) illustrating the general distributions and thicknesses of seismic stratigraphic units and elevations of major unconformities beneath the Massachusetts inner shelf between Nahant and northern Cape Cod Bay. Geologic cross sections are interpreted from chirp seismic reflection profiles. Vertical scale is elevation in meters from the North American Vertical Datum of 1988. Solid vertical black line denotes bend in section, and dashed vertical black lines indicate intersections. See figure 6 for descriptions of stratigraphic units and unconformities. Geologic section locations are identified on figure 8. 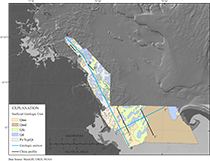 Figure 8. Surficial geologic map of the Massachusetts inner shelf between Nahant and northern Cape Cod Bay. The areal extents over which subsurface geologic units crop out at the seafloor were interpreted from seismic-reflection data. Detailed descriptions of the primary geologic units are figure 6. Qmn, Holocene nearshore marine sediments; Qmd, Holocene deepwater marine sediments; Qfe, Holocene fluvial and estuarine sediments; Qd, undifferentiated Pleistocene glacial drift sediments; Pz(?)/Tcp(?)/Qt(?), undifferentiated Paleozoic bedrock, late Cretaceous to Tertiary coastal plain sediments, or Pleistocene glacial tills. Holocene sediment veneers too thin to be detected in the seismic-reflection data (less than about 0.5 meter) may overlie outcrops of pre-Holocene units (blue and gray areas) locally. The locations of geologic cross sections B-B' and C-C' (fig. 8) are indicated by cyan lines, and the locations of chirp seismic-reflection profiles A-A', D-D', E-E', and F-F' are indicated by black lines.
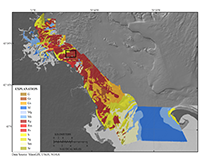
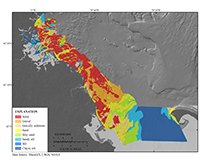
Figure 13. The distribution of sediment textures within the study area from Nahant to northern Cape Cod Bay. The bottom-type classification is from Barnhardt and others (1998) and is based on 16 sediment classes, where the first letter in the legend is the primary sediment unit (more than 50 percent) and the second letter is the secondary sediment unit (less than 50 percent). The classification is based on four easily recognizable sediment units that include gravel (G), mud (M), rock (R), and sand (S) (fig. 11). The black rectangle is indicating the location of figure 15.
Figure 14. The distribution of sediment textures based on a modified Shepard (1954) and Schlee (1973) classification within the study area from Nahant to northern Cape Cod Bay. The classification used here is based on eight units, which include solid (for rocky substrates), gravel, gravelly sediment, sand, sandy silt, silty sand, silt, and clayey silt.
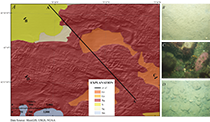
Figure 15. A, Sediment textures within an approximately 3-by-2-kilometer area in western Massachusetts Bay (see fig. 13 for location). The location of seismic profile A–A′ from figure 5 is shown; the lines B, C, and D indicate where the photographs in B, C, and D were taken. B, A photograph of the sea floor within an area classified as sand (S). C, A photograph of a section of sea floor classified as primarily rock with some gravel (Rg). D, A photograph from a section of sea floor classified as primarily gravel with some rock (Gr). The viewing frame for photographs B, C, and D is approximately 50 centimeters.
Figure 19. Chirp seismic-reflection profile D–D′ with seismic stratigraphic interpretation. This profile illustrates the stratigraphy beneath western Massachusetts Bay offshore of Scituate, Massachusetts, where a relatively broad depression in the oldest composite fluvial unconformity (U1) is filled by Pleistocene glaciomarine (Qgm) and overlying Holocene fluvial and estuarine (Qfe) sediments. See figure 6 for descriptions of stratigraphic units and major unconformities (indicated by red lines). See figure 8 for profile location. A constant sound velocity of 1,500 meters per second wasused to convert two-way travel time to depth in meters.
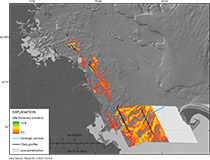
Figure 21. Map showing the thickness of Holocene fluvial and estuarine (Qfe) sediments beneath the Massachusetts inner shelf between Nahant and northern Cape Cod Bay. The grey shaded area indicates where Qfe thickness could not be evaluated due to insufficient seismic penetration to adequately map the underlying Ur surface. The locations of geologic cross sections in figure 8 are indicated by cyan lines, and locations of chirp seismic-reflection profiles are indicated by black lines.
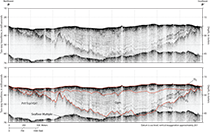
Figure 22. Chirp seismic-reflection profile E–E′ with seismic stratigraphic interpretation. This profile illustrates the stratigraphy beneath northern Cape Cod Bay offshore of Duxbury Beach and Plymouth Bay, Massachusetts, where two depressions in the oldest composite fluvial unconformity (U1), located on either side of a broad outcrop, are filled by a succession of Pleistocene glaciolacustrine (Qdl), Holocene fluvial and estuarine (Qfe), and Holocene nearshore marine (Qmn) sediments. See figure 6 for descriptions of stratigraphic units and major unconformities (indicated by red lines). See figure 8 for profile location. A constant sound velocity of 1,500 meters per second was used to convert two-way travel time to depth in meters.
Figure 26. Sediment texture polygons are assigned a data interpretation confidence value between 1 and 4 based on the resolution and number of input data sources. The highest interpretation confidence value is 1 and the lowest is 4.
Figure 27. Chart showing the relative percentage of sea-floor outcrop for each of the primary seismic stratigraphic units. Qmd, Holocene deepwater marine; Qmn, Holocene nearshore marine; Qfe, Holocene fluvial and estuarine; Qd, undifferentiated Pleistocene glacial drift; Pz(?)/Tcp(?)/Qt(?), undifferentiated Paleozoic bedrock, late Cretaceous to Tertiary coastal plain sediments, or Pleistocene glacial tills; %, percent. |

![]() U.S. Department of the Interior |
U.S. Geological Survey
U.S. Department of the Interior |
U.S. Geological Survey
URL: http://pubsdata.usgs.gov/pubs/of/2012/1157/html/discussion.html
Page Contact Information: GS Pubs Web Contact
Page Last Modified: Friday, 16-Aug-2013 12:00:22 EDT