
|
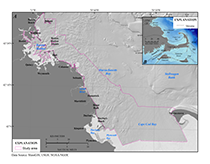 |
Figure 1. A, Location map of the study area from Nahant to northern Cape Cod Bay, Massachusetts and B, map of eastern Massachusetts showing the moraines associated with the Laurentide ice sheet. The outline in A is drawn based on the extent of the physiographic zones and surficial sediment texture maps. The approximate moraine locations are modified from Ridge (2004). BBM, Buzzards Bay Moraine; BSM, Billingsgate Shoal Moraine; CR, Chicopee Readvance Moraine; FPM, Fresh Pond Moraine; SM, Sandwich Moraine; TM, terminal moraine through Martha’s Vineyard and Nantucket. |
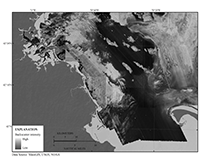 |
Figure 2. A composite backscatter image at 10-meter resolution was created from a series of published backscatter images (table 1). Areas of high backscatter have strong acoustic reflections and suggest boulders, gravels, and generally coarse seafloor sediments. Low backscatter areas have weak acoustic reflections and are generally finer grained material such as muds and fine sands. |
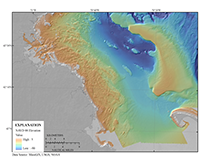 |
Figure 3. A digital elevation model (DEM) was produced from swath interferometric, multibeam bathymetry, and lidar at 30-meter resolution (table 1). High rugosity and high relief are most often associated with rocky areas, whereas smooth, low relief regions tend to be blanketed by fine-grained sediment deposits. NAVD 88, North American Vertical Datum of 1988. |
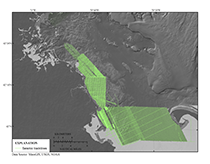 |
Figure 4. Map showing tracklines of chirp seismic-reflection profiles from Andrews and others (2010) and Barnhardt and others (2010) used to interpret surficial geology and shallow stratigraphy. |
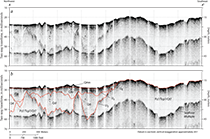 |
Figure 5. Chirp seismic reflection profiles A, A-A’ with seismic stratigraphic interpretation and B, illustrating the subsurface stratigraphy of the study area. Qmn, Holocene nearshore marine sediments; Qfe, Holocene fluvial and estuarine sediments; Qd, undifferentiated Pleistocene glacial drift sediments; Pz(?)/Tcp(?)/Qt(?), undifferentiated Paleozoic bedrock, late-Cretaceous to Tertiary coastal plain sediments, or Pleistocene glacial tills; Ul, fluvial unconformity marking the upper surface of Pz(?)/Tcp(?)/Qt(?); Ur, late Wisconsinan regressive unconformity; Ut, transgressive unconformity over Qfe and Qd. See figure 6 for detailed descriptions of stratigraphic units and major unconformities (indicated by red lines). See figure 8 for profile location. A constant sound velocity of 1,500 meters per second was used to convert two-way travel time to depth in meters. |
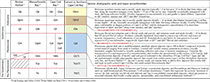 |
Figure 6. Seismic stratigraphic units and major unconformities interpreted within Boston Harbor by Rendigs and Oldale (1990), Massachusetts Bay by Oldale and Bick (1987), Cape Cod Bay by Oldale and O’Hara (1990), and between Nahant and northern Cape Cod Bay in this study. |
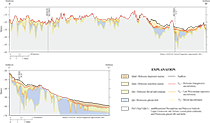 |
Figure 7. Geologic cross sections (B–B′ and C–C′) illustrating the general distributions and thicknesses of seismic stratigraphic units and elevations of major unconformities beneath the Massachusetts inner shelf between Nahant and northern Cape Cod Bay. Geologic cross sections are interpreted from chirp seismic reflection profiles. Vertical scale is elevation in meters from the North American Vertical Datum of 1988. Solid vertical black line denotes bend in section, and dashed vertical black lines indicate intersections. See figure 6 for descriptions of stratigraphic units and unconformities. Geologic section locations are identified on figure 8. |
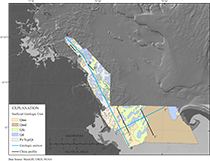 |
Figure 8. Surficial geologic map of the Massachusetts inner shelf between Nahant and northern Cape Cod Bay. The areal extents over which subsurface geologic units crop out at the seafloor were interpreted from seismic-reflection data. Detailed descriptions of the primary geologic units are figure 6. Qmn, Holocene nearshore marine sediments; Qmd, Holocene deepwater marine sediments; Qfe, Holocene fluvial and estuarine sediments; Qd, undifferentiated Pleistocene glacial drift sediments; Pz(?)/Tcp(?)/Qt(?), undifferentiated Paleozoic bedrock, late Cretaceous to Tertiary coastal plain sediments, or Pleistocene glacial tills. Holocene sediment veneers too thin to be detected in the seismic-reflection data (less than about 0.5 meter) may overlie outcrops of pre-Holocene units (blue and gray areas) locally. The locations of geologic cross sections B-B' and C-C' (fig. 8) are indicated by cyan lines, and the locations of chirp seismic-reflection profiles A-A', D-D', E-E', and F-F' are indicated by bl |
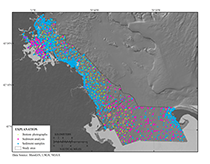 |
Figure 9. Bottom photographs and sediment samples collected within the study area were used to aid interpretations. Sediment samples with laboratory analysis are shown as magenta dots, while blue dots are visual descriptions. Data are from Ford and Voss (2010), McMullen and others (2011) and Emily Huntley (Massachusetts Office of Coastal Zone Management, unpub. data, 2012). |
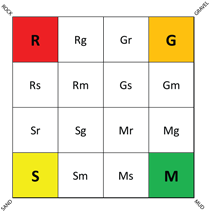 |
Figure 10. Barnhardt and others (1998) bottom-type classification based on four basic sediment units: rock (R), gravel (G), sand (S), and mud (M). Twelve additional two-part units represent combinations of the four basic units, where the primary texture (more than 50 percent of the area) is given an upper case letter and the secondary texture (less than 50 percent of the area) is given a lower case letter. |
 |
Figure 11. Sediment classification scheme by Shepard (1954), as modified by Schlee (1973) and McMullen and others (2011). |
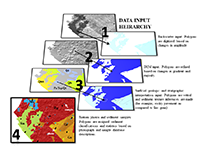 |
Figure 12. Sediment texture and distribution data were mapped qualitatively in Esri ArcGIS using a hierarchical methodology. Backscatter data were the first input, followed by bathymetry, surficial geologic and shallow stratigraphic interpretations, and photograph and sample databases. DEM, digital elevation model. |
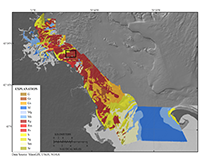 |
Figure 13. The distribution of sediment textures within the study area from Nahant to northern Cape Cod Bay. The bottom-type classification is from Barnhardt and others (1998) and is based on 16 sediment classes, where the first letter in the legend is the primary sediment unit (more than 50 percent) and the second letter is the secondary sediment unit (less than 50 percent). The classification is based on four easily recognizable sediment units that include gravel (G), mud (M), rock (R), and sand (S) (fig. 11). The black rectangle is indicating the location of figure 15. |
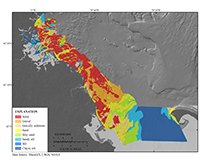 |
Figure 14. The distribution of sediment textures based on a modified Shepard (1954) and Schlee (1973) classification within the study area from Nahant to northern Cape Cod Bay. The classification used here is based on eight units, which include solid (for rocky substrates), gravel, gravelly sediment, sand, sandy silt, silty sand, silt, and clayey silt. |
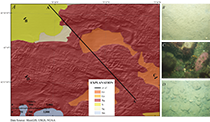 |
Figure 15. A, Sediment textures within an approximately 3-by-2-kilometer area in western Massachusetts Bay (see fig. 13 for location). The location of seismic profile A–A′ from figure 5 is shown; the lines B, C, and D indicate where the photographs in B, C, and D were taken. B, A photograph of the sea floor within an area classified as sand (S). C, A photograph of a section of sea floor classified as primarily rock with some gravel (Rg). D, A photograph from a section of sea floor classified as primarily gravel with some rock (Gr). The viewing frame for photographs B, C, and D is approximately 50 centimeters. |
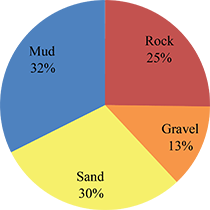 |
Figure 16. The chart shows the percentage of each primary sediment unit within the study area. %, percent. |
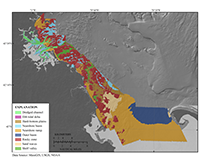 |
Figure 17. The distribution of physiographic zones within the study area from Nahant to Northern Cape Cod Bay. The physiographic zone classification is based on Kelley and others (1996), and the zones are delineated based on sea-floor morphology and the dominant texture of surficial material. |
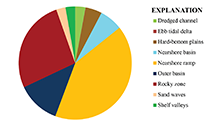 |
Figure 18. Chart showing the relative percentage of each physiographic zone within the study area. |
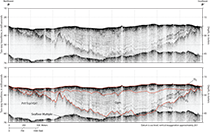 |
Figure 19. Chirp seismic-reflection profile D–D′ with seismic stratigraphic interpretation. This profile illustrates the stratigraphy beneath western Massachusetts Bay offshore of Scituate, Massachusetts, where a relatively broad depression in the oldest composite fluvial unconformity (U1) is filled by Pleistocene glaciomarine (Qgm) and overlying Holocene fluvial and estuarine (Qfe) sediments. See figure 6 for descriptions of stratigraphic units and major unconformities (indicated by red lines). See figure 8 for profile location. A constant sound velocity of 1,500 meters per second wasused to convert two-way travel time to depth in meters. |
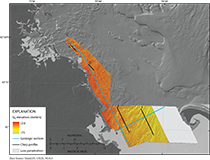 |
Figure 20. Map showing the elevation (from the North American Vertical Datum of 1988) of the late Wisconsinan regressive unconformity Ur, which identifies the truncated surface of Pleistocene glacial drift (Qd) and older adjacent units beneath the Massachusetts inner shelf between Nahant and northern Cape Cod Bay. The grey shaded area indicates where Ur was not identified and mapped due to insufficient seismic penetration. Ur represents a composite unconformity where it locally merges with the oldest fluvial unconformity (U1), Holocene transgressive unconformity (Ut), or both (fig. 7). The locations of geologic cross sections B-B' and C-C' (fog. 8) are indicated by cyan lines, and the locations of chirp seismic-reflection profiles A-A', D-D', E-E', and F-F' are indicated by black lines. |
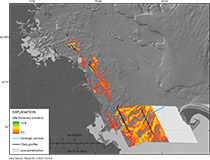 |
Figure 21. Map showing the thickness of Holocene fluvial and estuarine (Qfe) sediments beneath the Massachusetts inner shelf between Nahant and northern Cape Cod Bay. The grey shaded area indicates where Qfe thickness could not be evaluated due to insufficient seismic penetration to adequately map the underlying Ur surface. The locations of geologic cross sections in figure 8 are indicated by cyan lines, and locations of chirp seismic-reflection profiles are indicated by black lines. |
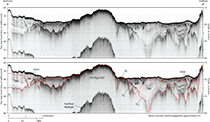 |
Figure 22. Chirp seismic-reflection profile E–E′ with seismic stratigraphic interpretation. This profile illustrates the stratigraphy beneath northern Cape Cod Bay offshore of Duxbury Beach and Plymouth Bay, Massachusetts, where two depressions in the oldest composite fluvial unconformity (U1), located on either side of a broad outcrop, are filled by a succession of Pleistocene glaciolacustrine (Qdl), Holocene fluvial and estuarine (Qfe), and Holocene nearshore marine (Qmn) sediments. See figure 6 for descriptions of stratigraphic units and major unconformities (indicated by red lines). See figure 8 for profile location. A constant sound velocity of 1,500 meters per second was used to convert two-way travel time to depth in meters. |
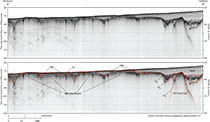 |
Figure 23. Chirp seismic-reflection profile F–F′ with seismic stratigraphic interpretation. This profile illustrates the stratigraphy beneath northern Cape Cod Bay offshore of Duxbury Beach and Plymouth Bay, Massachusetts, seaward of profile E–E′ in figure 22. Deep fluvial channels incised into the surface of thick glaciolacustrine (Qdl) sediments are filled with Holocene fluvial and estuarine (Qfe) deposits. The truncated Qd and Qfe units are broadly exposed at the seafloor to the northwest, but buried beneath increasingly thick Holocene deepwater marine (Qmd) sediments to the southeast. See figure 6 for descriptions of stratigraphic units and major unconformities (indicated by red lines). See figure 8 for profile location. A constant sound velocity of 1,500 meters per second was used to convert two-way travel time to depth in meters. |
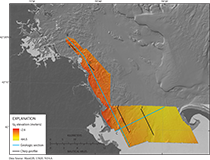 |
Figure 24.Map showing the elevation (from the North American Vertical Datum of 1988) of the Holocene transgressive unconformity Ut, which identifies the truncated surface of Holocene fluvial and estuarine (Qfe) sediments and older adjacent units beneath the Massachusetts inner shelf between Nahant and northern Cape Cod Bay. Ut represents a composite unconformity where it locally merges with the oldest fluvial (U1) unconformity, the late Wisconsinan regressive (Ut) unconformity, or both (fig. 7). The locations of geologic cross sections B-B' and C-C' (fig. 8) are indicated by cyan lines, and the locations of chirp seismic-reflection profiles A-A', D-D', E-E', and F-F' are indicated by black lines. |
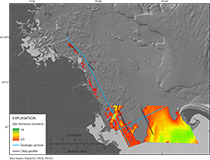 |
Figure 25.Map showing the thickness of Holocene marine (Qmn and Qmd) sediments on the Massachusetts inner shelf between Nahant and northern Cape Cod Bay. The locations of geologic cross sections B-B' and C-C' (fig. 8) are indicated by cyan lines, and the locations of chirp seismic-reflection profiles A-A', D-D', E-E', and F-F' are indicated by black lines |
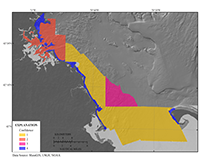 |
Figure 26. Sediment texture polygons are assigned a data interpretation confidence value between 1 and 4 based on the resolution and number of input data sources. The highest interpretation confidence value is 1 and the lowest is 4. |
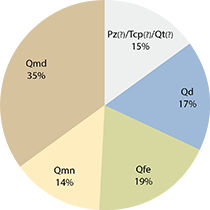 |
Figure 27. Chart showing the relative percentage of sea-floor outcrop for each of the primary seismic stratigraphic units. Qmd, Holocene deepwater marine; Qmn, Holocene nearshore marine; Qfe, Holocene fluvial and estuarine; Qd, undifferentiated Pleistocene glacial drift; Pz(?)/Tcp(?)/Qt(?), undifferentiated Paleozoic bedrock, late Cretaceous to Tertiary coastal plain sediments, or Pleistocene glacial tills; %, percent. |
|

