
|
| Click on figure for larger image. |
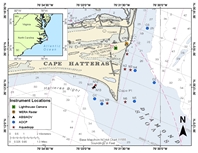 |
Figure 1. Location map for Cape Hatteras, North Carolina. Markers are placed to identify the nearshore (starting with “N”), offshore (starting with “O”), lighthouse, and Wellen radar (WERA) sites. Locations for Aquadopps (current profiler utilizing Doppler technology), acoustic backscatter sensor (ABS),acoustic Doppler velocimeter (ADV), and acoustic Doppler current profilers (ADCP) are identified
|
The U.S. Geological Survey (USGS) Coastal and Marine Geology Program in Woods Hole, Massachusetts, is leading an effort to understand the regional sediment dynamics along the coastline of North and South Carolina. The Carolinas Coastal Change Processes (CCCP) Project examines the interactions between oceanographic forcing, geologic conditions, and the resulting changes to topography of the inner shelf, nearshore, and subaerial beach regions. This report provides an overview of an oceanographic field study conducted in February 2010 to investigate processes that control the dynamics of sediment transport at Cape Hatteras, North Carolina.
To investigate processes that control the dynamics of sediment transport at Cape Hatteras, North Carolina, six field activities were conducted in the study area. A camera was mounted on the lighthouse and georeferenced targets were installed to capture images of the surf zone. These images were used to define estimates of along shore ocean current speed. A single high-frequency (48 MHz) Wellen radar (WERA) site was installed on the dunes to estimate wind, wave, and current conditions. Nearshore surveys were conducted to acquire subaqueous bathymetry and subaerial topography. Uranine dye was injected into the surf zone, aerial targets were installed and aerial photographs were taken to help visualize the circulation dynamics at Cape Point. Oceanographic instruments were deployed to collect wave and current data at 11 sites in the nearshore and at three offshore locations. Figure 1 identifies locations of the equipment for the nearshore (sites starting with ‘N’), offshore (sites starting with ‘O’), lighthouse, and WERA sites.
During this field study a benthic unattended generator (BUG) was deployed on the south side of the cape close to the nearshore sites by the Naval Research Lab (NRL) to test the fuel cell’s ability to generate electrical power in situ. Data from this field study are available to support NRL’s analysis of the BUG data.
This data report presents background information on the impetus for understanding coastal change processes in the nearshore at Cape Hatteras, a description of the field program (including the oceanographic instrumentation used) to collect data, and the data-processing and archival techniques used. This report also provides access to all observational data related to the field study, available in digital form. The edited data are presented in time-series plots for rapid visualization of the dataset, and in data files that are in the network common data format (NetCDF). |

