U.S. Geological Survey Open-File Report 2012-1219
Carolinas Coastal Change Processes Project data report for nearshore observations at Cape Hatteras, North Carolina, February 2010
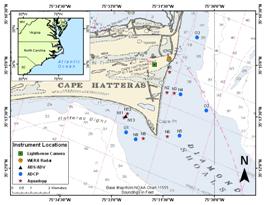
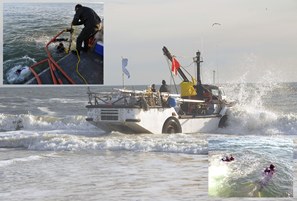
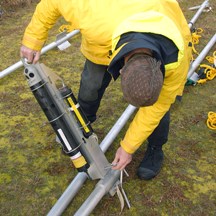
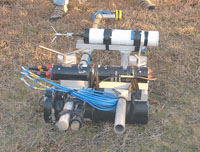
This page describes the deployment locations, equipment mounted at each site, and sensor elevations. The field program deployed equipment at eleven sites in the nearshore surf zone and at three offshore locations.The nearshore sites consisted of 11 jetted pole mounts, identified as starting with an "N" (fig. 1). The 3 offshore sites, identified as starting with an "O" (fig. 1), consisted of a trawl resistant bottom mount (TRBM) containing an acoustic Doppler current profilers (ADCP). Instruments were deployed and recovered on different days due to weather conditions. Additionally other data were collected from a dye study, a camera system located on the lighthouse (fig. 1), Wellen radar (WERA) installed on the dunes (fig. 1), nearshore surveys and a benthic unattended generator. Details for each data type are provided below. Nearshore Sites The 11 nearshore sites are identified as locations N1 to N13 (there is no N7 or N10, fig. 1). Sites 7 and 10 could not be deployed due to the shallow depth of the selected sites, high winds and rough seas. The sites are located on the east and south shorelines and on top of the shoal. Instruments were deployed to measure ocean currents, water levels, wave heights, and wave directions. Seven of these instruments were Aquadopp (current profiler utilizing Doppler technology) 1 Mhz profilers and three were Teledyne RD Instruments (T-RDI) 1200 Khz ADCPs. Site N13 consisted of an acoustic doppler velocimeter-Triton (ADV) and an acoustic backscatter Sensor (ABS). These instruments were deployed on stainless pipes that are 4.26 meters (m) long. Each pipe was jetted into the sea floor to a depth of about 3 m, leaving approdimately 1.2 m above the sediment surface. The instruments were mounted on a cantilever arm approximately 40 to 60 centimeters (cm) above bottom (CMAB). that was attached to the pipes. U.S. Geological Survey (USGS) divers deployed the equipment. United States Army Corps of Engineers Field Research Facility (USACE FRF) maintains several specialized vehicles that are capable of deploying equipment and transferring gear from the beach into or past the surf zone. One type of vehicle is an amphibious water craft lighter amphibious resupply cargo (LARC) that is capable of driving from the beach into the water. The LARC (fig. 2) was used as a dive platform from which to deploy, perform periodic maintenance visits, and recover the gear. N1. Nearshore site 1 was located at 35.2469° N, 75.5216° W, deployed on the seafloor at a water depth of 3.9 m. Instrumentation mounted on this jetted pole mount consisted of an Aquadopp and a pinger 40 CMAB (fig. 3). The instruments were deployed on February 9, 2010, and recovered on February 22, 2010. N2. Nearshore site 2 was located at 35.2369° N, 75.5230° W, deployed on the seafloor at a water depth of 6.0 m. Instrumentation mounted on this jetted pole mount consisted of an Aquadopp and a pinger 40 CMAB (fig. 3). The instruments were deployed on February 9, 2010, and recovered on February 21, 2010. N3. Nearshore site 3 was located at 35.2365° N, 75.5193° W, deployed on the seafloor at a water depth of 4.9 m. Instrumentation mounted on this jetted pole mount consisted of an Aquadopp and a pinger 40 CMAB (fig. 3). The instruments were deployed on February 2, 2010, and recovered on February 22, 2010. N4. Nearshore site 4 was located at 35.2360° N, 75.5164° W, deployed on the seafloor at a water depth of 7.8 m. Instrumentation mounted on this jetted pole mount consisted of an ADCP (fig. 4). The instrument was deployed on February 9, 2010, and recovered on February 22, 2010. N5. Nearshore site 5 was located at 35.2160° N, 75.5167° W, deployed on the seafloor at a water depth of 6.0 m. Instrumentation mounted on this jetted pole mount consisted of an ADCP (fig. 4). The instrument was deployed on February 2, 2010, and recovered on February 21, 2010. N6. Nearshore site 6 was located at 35.2156° N, 75.5227° W, deployed on the seafloor at a water depth of 4.7 m. Instrumentation mounted on this jetted pole mount consisted of an Aquadopp and a pinger 40 CMAB (fig. 3). The instruments were deployed on February 2, 2010, and recovered on February 21, 2010. N8. Nearshore site 8 was located at 35.2146° N, 75.5345° W, deployed on the seafloor at a water depth of 4.8 m. Instrumentation mounted on this jetted pole mount consisted of an Aquadopp and a pinger 40 CMAB (fig. 3). The instruments were deployed on February 5, 2010, and recovered on February 22, 2010. N9. Nearshore site 9 was located at 35.2143° N, 75.5381° W, deployed on the seafloor at a water depth of 7.0 m. Instrumentation mounted on this jetted pole mount consisted of an ADCP (fig. 4). The instrument was deployed on February 4, 2010, and recovered on February 22, 2010. N11. Nearshore site 11 was located at 35.2247° N, 75.5437° W, deployed on the seafloor at a water depth of 4.9 m. Instrumentation mounted on this jetted pole mount consisted of an Aquadopp and a pinger 58 CMAB (fig. 3). The instrument was deployed on February 3, 2010, and recovered on February 22, 2010. N12. Nearshore site 12 was located at 35.2266° N, 75.5421° W, deployed on the seafloor at a water depth of 2.9 m. Instrumentation mounted on this jetted pole mount consisted of an Aquadopp and a pinger 40 CMAB (fig. 3). The instrument was deployed on February 3, 2010, and recovered on February 8, 2010; then a different instrument was deployed February 8, 2010, and recovered February 22, 2010. N13. Nearshore site 13 was located at 35.2254° N, 75.5430° W, deployed on the seafloor at a water depth of 3.5 m. Instrumentation mounted on this jetted pole mount consisted of an acoustic doppler velocimeter-Triton and an acoustic backscatter Sensor (fig. 5). The instrument was deployed on February 8, 2010, and recovered on February 23, 2010. Offshore Sites The three (3) offshore sites are identified as O1, O2, and O3. These deepwater sites (8-10m), required a boat with a winch, a crane, or an A-frame to deploy and recover TRBMs. These sites were contracted out for deployment and recovery. O1. Offshore site one was deployed at 35.2177° N, 75.5427° W at a water depth of 8.8 m. Instrumentation mounted on the TRBM consisted of an ADCP (fig. 6). This TRBM was deployed on February 4, 2010, and recovered on March 20, 2010. O2. Offshore site two was deployed at 35.2282° N, 75.5039° W at a water depth of 9.8 m. Instrumentation mounted on the TRBM consisted of an ADCP (fig. 6). This TRBM was deployed on February 4, 2010, and recovered on March 20, 2010. O3. Offshore site three was deployed at 35.2636° N, 75.5083° W at a water depth of 9.45 m. Instrumentation mounted on the TRBM consisted of an ADCP (fig.6). This TRBM was deployed on February 4, 2010, and recovered on March 20, 2010.
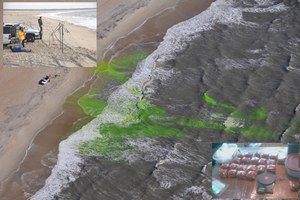
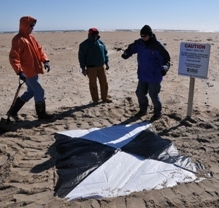
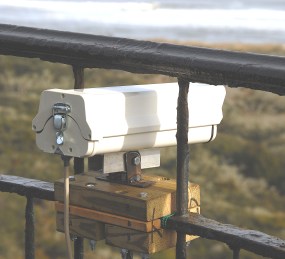
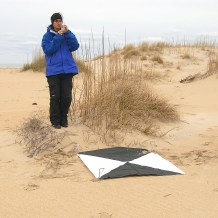
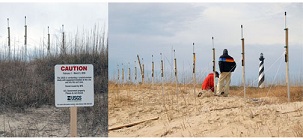
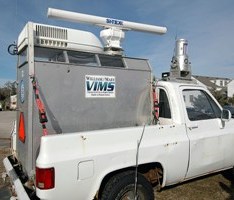
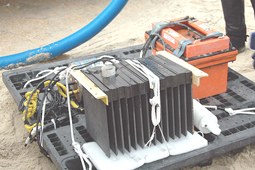
Lighthouse Camera System A video camera system was mounted on the railing at the top of the Cape Hatteras Lighthouse (fig. 9). The lighthouse is approximately 59 m tall. The height allowed a vantage point to view the nearshore and image the surf zone. Processed images provide estimates of along shore ocean current speeds. Several targets (fig. 10) were installed on the beach and dunes in view of the camera. The targets were located with GPS to identify their exact locations. The targets help to geo-rectify the images during post processing. The camera system was primarily installed and maintained by Georgia Tech Savannah. Wellen Radar Array Wellen radar antenna arrays were located near 35.25360° N, 75.52199° W. At the WERA site both a transmit array of 4 antennae and a receive array of 12 antennae were installed (fig. 11). A trailer with access to electricity was set up as an electronics base. Cables were run from the trailer to each antenna array. The WERA system was primarily installed and maintained by the University of South Carolina. Further information on high-frequency radar capabilities can be found in Voulgaris, and others (2011). Nearshore Surveys Throughout the deployment, surveys were conducted to acquire subaqueous bathymetry and subaerial topography. The surveys measured seafloor bathymetry elevations in the nearshore zone immediately off of Cape Point and on top of Diamond Shoals. The surveys extended on either side of the point along the eastern shore toward the lighthouse and along the southern shore toward Hatteras Inlet using the CLARIS and LARC systems as described below. Coastal Lidar and Radar Imaging System The U.S. Army Corps of Engineers conducted X-band radar and light detection and ranging (lidar) surveys during the deployment using a 4-wheel-drive vehicle (fig. 12). The truck is equipped with a coastal lidar and X-band Radar Imaging System (CLARIS). The CLARIS system provides measurements of wave parameters, inferred bathymetry, and dune heights to provide a spatially continuous measurement of bathy and surface topography. Further information on the X-band radar technique can be found in McNinch (2007). Lighter Amphibious Resupply Cargo The lighter amphibious resupply cargo (LARC) vessel is unique in its ability to survey in shallow water, across shoals and in the surf zone. Measurements were obtained by the LARC (fig. 2) using the built in survey system which includes HYPACK hydrographic software for data logging and navigation, a Trimble 4000 kinematic differential global positioning system (KDGPS), and a Knudson 320BP dual frequency sounder. Benthic Unattended Generator A benthic unattended generator (BUG, fig. 13) was deployed for testing near 35.2242° N, 75.5428° W on the sea floor at a water depth of 4.5 m from February 3-22, 2010. A BUG consists of a graphite electrode (the anode) in the anoxic zone connected to a graphite cathode in the overlying aerobic water (Bond and others, 2002). The BUG was installed by the Naval Research Laboratory (NRL) to record a time series of the fuel cell’s ability to generate electrical power in situ. Previous experiments tested BUGs in a salt marsh near Tuckerton, New Jersey and in the Yaquina Bay Estuary near Newport, Oregon (Tender and others, 2002). |

![]() U.S. Department of the Interior |
U.S. Geological Survey
U.S. Department of the Interior |
U.S. Geological Survey
URL: http://pubsdata.usgs.gov/pubs/of/2012/1219/methods.html
Page Contact Information: GS Pubs Web Contact
Page Last Modified: Monday, 26-Aug-2013 12:17:13 EDT