U.S. Geological Survey Open-File Report 2012-1234
Application of a Hydrodynamic and Sediment Transport Model for Guidance of Response Efforts Related to the Deepwater Horizon Oil Spill in the Northern Gulf of Mexico Along the Coast of Alabama and Florida
Title Page | Contents | List of Figures | List of Tables | Conversion Factors | Abbreviations | Executive Summary | Introduction | Methods | Results | Digital Data Files | Discussion | Summary and Conclusions | References Cited | Appendix 1. Scenarios | Appendix 2. Example Model Input Files | Appendix 3. Calculations of Mobility and Potential Flux | Appendix 4. File Naming Conventions | Appendix 5. Time Step of Maximum Ebb and Flood for Inlets in the Model Domain
 |
||
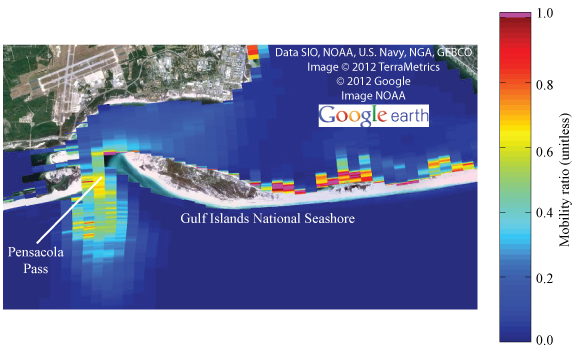
| Figure 24. Mobility ratio (table 2, metric 5) in the northern Gulf of Mexico alongshore Alabama and Florida for a midlevel threshold of 2.5-centimeter (cm) surface residual balls (SRBs; table 1) along the Gulf Islands National Seashore (east of Pensacola Pass, Florida) for wave scenario H5_D1, corresponding to waves observed at NDBC buoy 42040 of height greater than 2 meters and coming from a north-northeasterly direction (fig. 2). Where the mobility ratio exceeded 1 (in pink) mobility of 2.5-cm SRBs was indicated at locations along the back-barrier from northerly wind-waves locally generated behind the barrier. | ||


