U.S. Geological Survey Open-File Report 2012-1234
Application of a Hydrodynamic and Sediment Transport Model for Guidance of Response Efforts Related to the Deepwater Horizon Oil Spill in the Northern Gulf of Mexico Along the Coast of Alabama and Florida
Title Page | Contents | List of Figures | List of Tables | Conversion Factors | Abbreviations | Executive Summary | Introduction | Methods | Results | Digital Data Files | Discussion | Summary and Conclusions | References Cited | Appendix 1. Scenarios | Appendix 2. Example Model Input Files | Appendix 3. Calculations of Mobility and Potential Flux | Appendix 4. File Naming Conventions | Appendix 5. Time Step of Maximum Ebb and Flood for Inlets in the Model Domain
 |
||
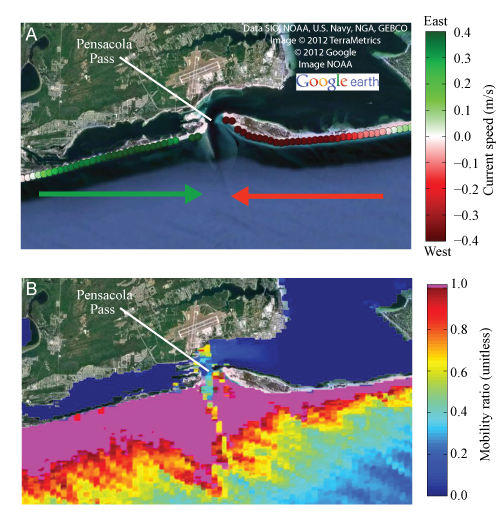
| Figure 29. A, Maximum alongshore flow speed (green and red arrows) smoothed over a 2-kilometer length scale (table 2, metric 2) and B, mobility ratio (table 2, metric 5) using the lowest critical stress threshold, appropriate for surface residual balls (SRBs) sitting on top of the seabed, for 10-centimeter SRBs (table 1) near Pensacola Pass, Fla., for scenario H5_D8 (fig. 2). All small-size classes of SRBs are also mobilized, leading to convergence and a high probability of deposition in Pensacola Pass during the wave conditions represented by this scenario. | ||


