
|
List of Figures
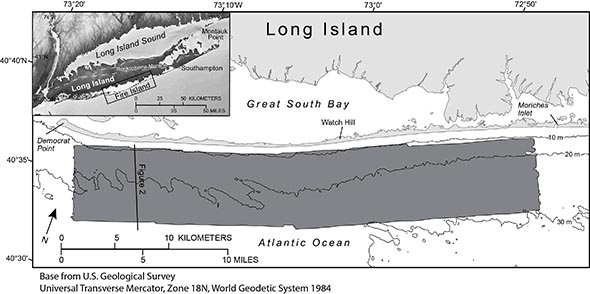 |
Figure 1. Map showing the survey area offshore of Fire Island, New York, 2011. Inset map shows location of study area (outlined in black). Bathymetric contours are in meters (m) below the North American Vertical Datum of 1988 (NAVD 88). Figure modified from Schwab and others (2013). |
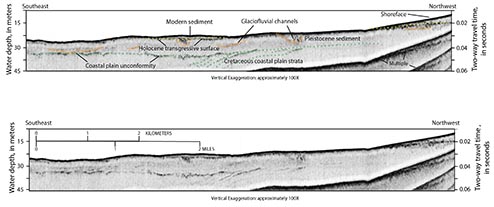 |
Figure 2. High-resolution chirp seismic-reflection profile illustrating stratigraphic features and geometries discussed in the text, offshore of Fire Island, New York, 2011. Location of the profile is shown in figure 1. Approximate water depth in meters is based on two-way travel time of 1,500 meters per second. A, The Holocene marine transgressive surface is marked by a yellow dotted line. Glaciofluvial channels and older Pleistocene sediments are marked by orange dotted lines, and the underlying Cretaceous-age coastal plain strata and the coastal plain unconformity are shown as green dotted lines. B, The chirp seismic-reflection profile displayed without interpretations. Figure modified from Schwab and others (2013). |
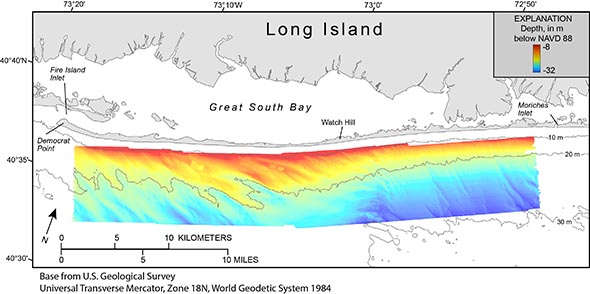 |
Figure 3. Map showing an interpolated bathymetric surface generated from interferometric sonar offshore of Fire Island, New York, 2011. Regional bathymetric contours are in meters (m) below the North American Vertical Datum of 1988 (NAVD 88). West of Watch Hill the modern sand deposit is organized into a series of shoreface-attached sand ridges oriented at angles oblique to the shoreline. Figure modified from Schwab and others (2013). |
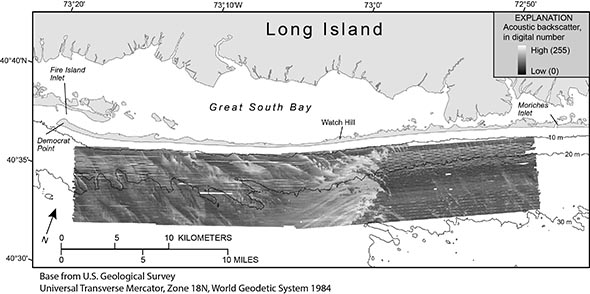 |
Figure 4. Map showing acoustic backscatter collected with interferometric sonar offshore of Fire Island, New York, 2011. High backscatter is displayed as light tones and low backscatter is displayed as dark tones within the backscatter image. In general, high backscatter corresponds to coarser-grained sediments, and low backscatter corresponds to finer-grained sediments. Regional bathymetric contours are in meters (m) below the North American Vertical Datum of 1988 (NAVD 88). Figure modified from Schwab and others (2013). |
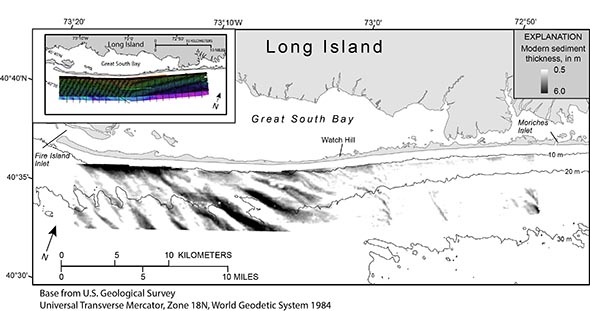 |
Figure 5. Map showing modern sediment thickness offshore of Fire Island, New York, 2011. Regional bathymetric contours are in meters (m) below the North American Vertical Datum of 1988 (NAVD 88). The inset map shows the location of the chirp seismic-reflection profiles, overlain on bathymetry (fig. 3), that were used to map the Holocene transgressive surface (fig. 6) and thus the modern sediment thickness. Figure modified from Schwab and others (2013). |
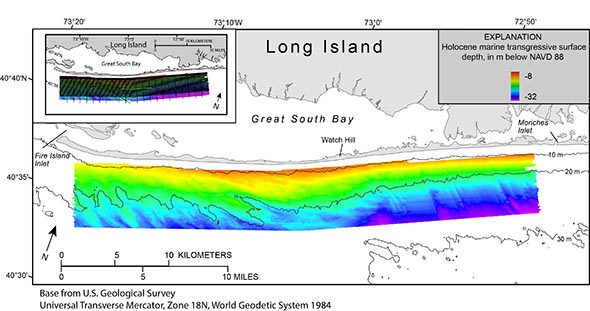 |
Figure 6. Map showing the Holocene marine transgressive surface mapped by using chirp seismic-reflection profiles collected in 2011 (see inset map) offshore of Fire Island, New York. The depth scale from the explanation of figure 3 is used to display the Holocene marine transgressive surface for easy comparison between the two surfaces. Regional bathymetric contours are in meters (m) below the North American Datum of 1988 (NAVD 88). The inset map shows the location of the chirp seismic-reflection profiles, overlain on bathymetry (fig. 3), that were used to map the Holocene marine transgressive surface. Figure modified from Schwab and others (2013). |
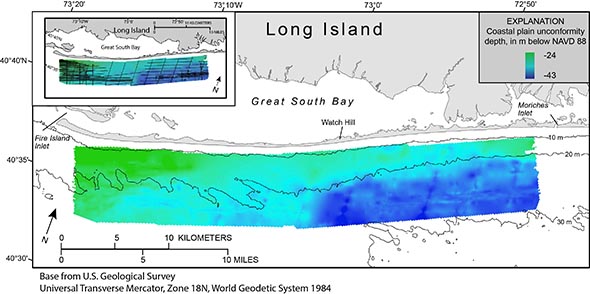 |
Figure 7. Map showing the coastal plain unconformity offshore of Fire Island, New York, 2011. Regional bathymetric contours are in meters (m) below the North American Vertical Datum of 1988 (NAVD 88). The inset map shows the location of the seismic-reflection profiles where subbottom penetration and resolution allowed identification of the coastal plain unconformity. In addition to chirp profiles collected in 2011, this grid includes reprocessed boomer and sparker data collected by the U.S. Geological Survey in 1996 and 1997 (Foster and others, 1999). The relatively sparse seismic-reflection data coverage yields a generalized, regional surface, with less resolution than other maps presented. |
|

