Open-File Report 2014-1203
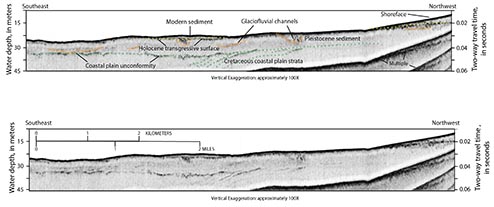
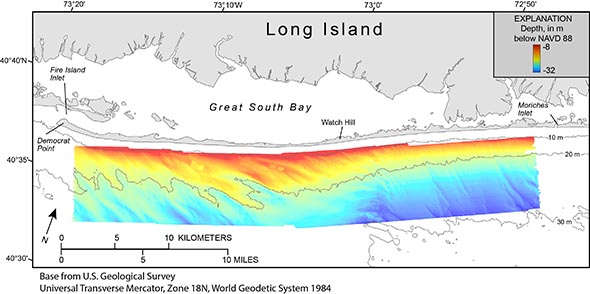
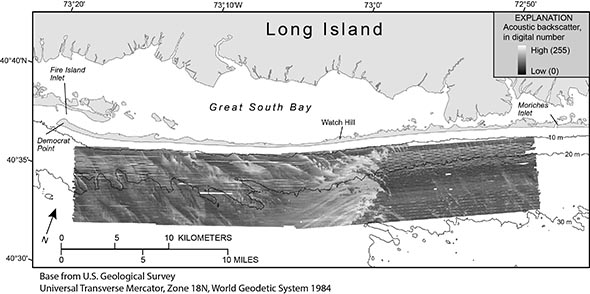
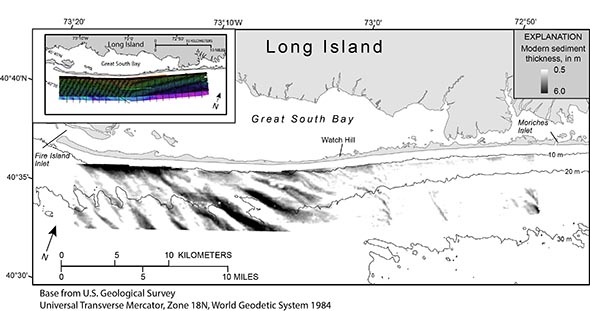
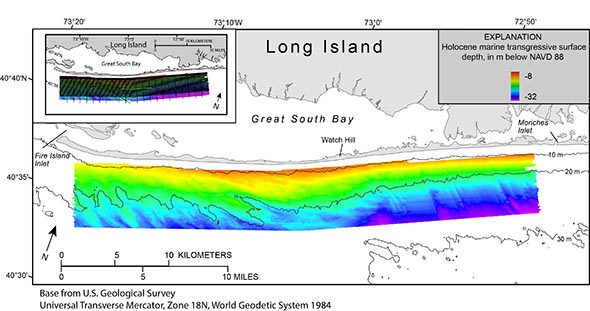
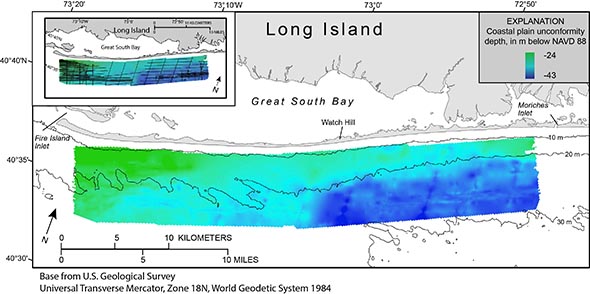
Methods—Data Collection and ProcessingSurvey OperationsAn interferometric sonar and a chirp seismic-reflection profiler were used to map bathymetry, acoustic backscatter, and subsurface stratigraphy and structure along approximately 336 km2 of the inner continental shelf offshore of Fire Island, N.Y. The mapping was conducted aboard the MV Scarlett Isabella, May 4 to 17, 2011 (USGS field activity 2011–005–FA). Methods used in the collection, processing, and analysis of the data are detailed in the following sections. A full description of the data acquisition parameters, processing steps, and accuracy assessments can be found in the metadata associated with each spatial dataset (Geospatial Data). Bathymetry and BackscatterApproximately 2,800 line kilometers of colocated bathymetry and acoustic backscatter data were acquired by using a Systems Engineering and Assessment, Ltd. (SEA) SWATHplus-M 234-kilohertz (kHz) interferometric sonar system. The sonar transducers were mounted on a rigid pole deployed from the port side of the ship approximately 2.17 m below the water line. Survey lines were run at an average speed of 5 nautical miles per hour (knots), and soundings were recorded over swath widths ranging from 50 to 150 m in water depths of 8 to 32 m, resulting in coverage of about 90 percent of the sea floor in the survey area. A Coda Octopus F180 motion reference unit (MRU), mounted directly above the sonar transducers, measured vertical displacement (heave) and attitude (pitch and roll) of the vessel during data acquisition. Sound velocity profiles were collected approximately every 2 hours by using an ODIM MVP30 moving vessel profiler. SEA SWATHplus acquisition software and the Computer Aided Resource Information System (CARIS) Hydrographic Information Processing System (HIPS) were used to collect and process, respectively, the raw bathymetric soundings. Navigation data were inspected and edited, MRU and sound velocity data were used to reduce vessel motion and refraction artifacts, and bathymetric filters were used to remove spurious soundings. A Differential Global Positioning System (DGPS) was used for horizontal positioning during data acquisition. Real Time Kinematic (RTK) Global Positioning System height corrections, broadcast from a continuously operated reference station (CORS) at Central Islip, N.Y. (station NTCI), were used to reference soundings to the North American Vertical Datum of 1988 (NAVD 88) and remove water-depth variations caused by tides. A 5-m bathymetric grid was generated within CARIS HIPS. Due to the lack of 100-percent coverage of the sea floor, between-line data gaps are present within the 5-m bathymetric grid. In order to generate a continuous bathymetric surface of the survey area, ArcGIS Spatial Analyst was used to create an interpolated bathymetric grid at a 10-meter-per-pixel (mmp) resolution (fig. 3). SWATHplus acoustic backscatter data were processed by using Chesapeake Technology’s SonarWiz. Altitudes were selected by using an automated bottom tracker with minor adjustments with manual digitizing. An empirical gain normalization function was applied to the backscatter to optimize the dynamic range and enhance the quality of the mosaic. A 24-bit gray-scale GeoTIFF image of backscatter was then generated at a 5.0-mpp resolution and imported into ArcGIS (fig. 4). Seismic-Reflection ProfilingChirp seismic-reflection data were collected by using an EdgeTech GeoStar FSSB subbottom profiling system and an SB 512i towfish (FM frequency modulation swept frequency of 0.5 to 12 kHz). Data were acquired by using a 0.25-second (s) shot rate, a 5-millisecond (ms) pulse length, and a 0.5- to 8-kHz frequency sweep. Data were recorded over two-way travel time travel lengths of 200 ms (4,328 samples/trace and 0.000046-s sample interval) and logged in the SEG-Y Rev. 1 format. SEIOSEIS (Henkart, 2011) seismic processing software was used to shift traces vertically to remove the effects of sea-surface heave, mute water column portions of the traces, and apply time-varying gain and automatic gain control. Processed seismic-reflection data were loaded into the seismic interpretation software package Landmark SeisWorks 2D, through which erosional unconformities (coastal plain unconformity and Holocene marine transgressive surface) were identified and digitized (fig. 2). The two-way travel times between the sea floor and the unconformities were calculated and converted to thicknesses in meters by using a constant velocity of 1,500 meters per second to produce an isopach of the modern sediment seismostratigraphic unit. ArcGIS Spatial Analyst was used to create interpolated grids of the modern sediment isopach (50 mpp; fig. 5) as well as the Holocene marine transgressive surface (50 mpp) and coastal plain unconformity (100 mpp) relative to NAVD 88 (figs. 6 and 7). Modern sediment less than 50 centimeters (cm) thick is assumed to be zero for sediment-volume calculations because of a conservative estimate of the limits in the vertical resolution of the seismic-reflection data. |

![]() U.S. Department of the Interior |
U.S. Geological Survey
U.S. Department of the Interior |
U.S. Geological Survey
URL: http://pubsdata.usgs.gov/pubs/of/2014/1203/ofr2014-1203-methods.html
Page Contact Information: GS Pubs Web Contact
Page Last Modified: Wednesday, 07-Dec-2016 19:39:40 EST