Results
Suspended Sediment
Storm Sampling
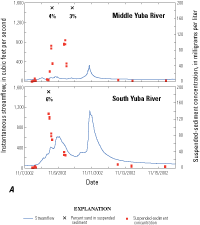
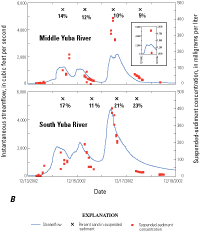
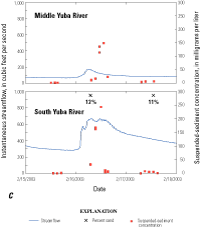
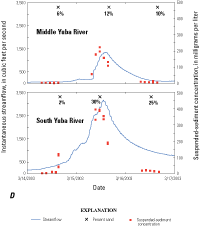
Storm sampling provided information regarding the timing of suspended-sediment concentration and streamflow peaks as well as information about varying grain-size distributions during storm events. Storm hydrographs, suspended-sediment concentrations, and percent sand are shown in figure 9A-D. Sediment sampling missed the November 2002 streamflow peak (fig. 9A); however, several sediment peaks that arrived prior to the storm peak were sampled and are characteristic of abundant sediment supply during first flush conditions. During the December 2002 storm event, the peak in suspended-sediment concentration coincided with the peak in streamflow (fig. 9B). We inferred that this was indicative of an abundant sediment supply during transport-limited winter storm conditions. During the February 2003 storm, the peaks in suspended-sediment concentration and streamflow coincided at the South Yuba River gage, again inferred to represent winter storm conditions, but the peak in suspended-sediment concentration was delayed at the Middle Yuba River (11410000) gage (fig. 9C). During the March 2003 storm, the peak in suspended-sediment concentrations arrived approximately 3 hours earlier than the peak in streamflow at the Middle Yuba River (11410000) gage and 6 hours earlier than the streamflow peak at the South Yuba River (11417500) gage (fig. 9D). The early arrival of sediment peaks indicated a limited supply of sediment. For the most part, concentrations of sand change systematically over the storm hydrographs with the lowest percentage of sand on the rising limb, greater percentages on the falling limb, and the highest percentages at the peak, indicating some hysteresis in sand concentrations.
Another observation made during storm sampling was of anomalously high suspended-sediment concentrations at the Middle Yuba River (11410000) gage on December 16, 2002 (see inset figure 9B). Significant volumes of sediment are stored behind Log Cabin Dam and Our House Dam (fig. 1), which require periodic dredging (Yuba County Water Agency, 1989). During large runoff events, these facilities discharge water over their spillways, and previously impounded sediment may be scoured and conveyed downstream resulting in elevated suspended-sediment concentrations at the Middle Yuba River (11410000) gage. Log Cabin Dam spilled again during the March 2003 storm sampling, but the impact of the spill was less dramatic in the March 2003 data set. During the March 2003 event, the peak in suspended-sediment concentration coincided with the peak of the spill, but the peak in streamflow at the Middle Yuba River (11410000) gage did not occur until several hours later. The magnitude of the December 2002 and March 2003 streamflows were similar, which may indicate that the first spill event of the water year flushed most of the finer impounded sediment available for transport over the spillway.
Grain-Size Analysis of Suspended Sediment
Suspended-sediment concentrations and grain sizes of sand-size material measured at the U.S. Geological Survey laboratory in Marina, California, are presented in table 2. Samples processed at the Marina laboratory did not meet the minimum sample mass requirement for pipet analyses of the less-than-0.063-mm sized sediment. However, the less-than-0.063-mm grain-size fraction of replicate samples sent to the USGS sediment laboratory in Menlo Park, California, was analyzed using a laser-diffraction particle-size analyzer. Suspended-sediment concentration, median and mean grain sizes (in µm), and percentages of clay (less than 0.004 mm), silt (0.004 to 0.063 mm), and sand (0.063 mm to 2.0 mm) measured at the Menlo Park laboratory are presented in table 3; full grain-size distributions are presented in Appendix 2.
Table 2
(View this table on a separate page.)
Summary of streamflow, suspended-sediment concentrations, and grain sizes of sand-sized suspended sediment at gaging stations in the upper Yuba River watershed, California.
[See figure 1 for station locations. Sand-size material measured by the U.S. Geological Survey in Marina, California. ft3/s, cubic foot per second; mg/L, milligram per liter; mm, millimeter]
[See figure 1 for station locations. Sand-size material measured by the U.S. Geological Survey in Marina, California. ft3/s, cubic foot per second; mg/L, milligram per liter; mm, millimeter]
| Map identifier | Station identifier | Date | Time | Streamflow (ft³/s) | Suspended-sediment concentration (mg/L) | Grain size percent finer than 2.0 mm | Grain size percent finer than 1.0 mm | Grain size percent finer than 0.5 mm | Grain size percent finer than 0.25 mm | Grain size percent finer than 0.125 mm | Grain size percent finer than 0.063 mm |
|---|---|---|---|---|---|---|---|---|---|---|---|
| MYG | 11410000 | 11/08/02 | 15:15 | 88 | 55 | 100 | 99 | 98 | 98 | 96 | |
| 11/09/02 | 08:15 | 66 | 96 | 100 | 98 | 98 | 97 | 97 | |||
| 12/14/02 | 10:00 | 1,250 | 79 | 100 | 99 | 97 | 92 | 86 | |||
| 12/15/02 | 07:30 | 883 | 48 | 100 | 98 | 96 | 92 | 88 | |||
| 12/16/02 | 11:50 | 1,950 | 374 | 100 | 98 | 95 | 93 | 90 | |||
| 12/16/02 | 11:50 | 1,950 | 375 | 100 | 97 | 96 | 95 | 93 | 90 | ||
| 12/16/02 | 11:50 | 1,950 | 360 | 100 | 99 | 97 | 95 | 94 | |||
| 12/17/02 | 13:25 | 170 | 35 | 100 | 99 | 98 | 95 | ||||
| 12/18/02 | 10:00 | 95 | 10 | 100 | 97 | 93 | 92 | ||||
| 12/30/02 | 12:00 | 150 | 5 | 194 | |||||||
| 03/14/03 | 15:00 | 63 | 7 | 194 | |||||||
| 03/15/03 | 15:45 | 1,230 | 218 | 100 | 99 | 98 | 96 | 88 | |||
| 03/16/03 | 15:30 | 100 | 6 | 190 | |||||||
| SYG | 11417500 | 11/08/02 | 10:15 | 279 | 116 | 100 | 100 | 99 | 97 | 94 | |
| 12/13/02 | 14:22 | 123 | 12 | 100 | 100 | 76 | 72 | 65 | |||
| 12/14/02 | 08:00 | 1,970 | 145 | 100 | 100 | 90 | 87 | 83 | |||
| 12/15/02 | 14:15 | 1,270 | 50 | 100 | 100 | 96 | 93 | 89 | |||
| 12/16/02 | 14:35 | 3,060 | 223 | 100 | 100 | 89 | 84 | 79 | |||
| 12/17/02 | 09:52 | 1,240 | 30 | 100 | 100 | 93 | 87 | 79 | |||
| 12/17/02 | 10:11 | 1,220 | 29 | 92 | 86 | 78 | |||||
| 12/17/02 | 10:11 | 1,220 | 31 | 100 | 100 | 89 | 82 | 73 | |||
| 12/18/02 | 09:40 | 605 | 13 | 95 | 88 | 79 | |||||
| 12/30/02 | 16:00 | 750 | 14 | 93 | 87 | 79 | |||||
| 12/31/02 | 11:31 | 1,190 | 199 | 100 | 100 | 99 | 99 | 98 | |||
| 02/16/03 | 07:00 | 661 | 39 | 100 | 100 | 95 | 91 | 87 | |||
| 02/16/03 | 07:00 | 661 | 36 | 100 | 100 | 95 | 93 | 88 | |||
| 02/17/03 | 13:00 | 419 | 7 | 191 | |||||||
| 02/17/03 | 13:00 | 419 | 8 | 186 | |||||||
| 03/14/03 | 16:00 | 409 | 89 | 99 | 99 | 98 | |||||
| 03/15/03 | 11:30 | 2,790 | 404 | 100 | 97 | 97 | 80 | 76 | 70 | ||
| 03/16/03 | 12:30 | 974 | 18 | 92 | 85 | 75 | |||||
| YRE | 11418000 | 03/15/03 | 14:10 | 5,400 | 10 | 189 | |||||
| 03/16/03 | 10:45 | 2,980 | 3 | 195 |
Table 3
(View this table on a separate page.)
Summary of streamflow, suspended-sediment concentrations, and grain sizes of suspended sediment collected at gaging stations in the upper Yuba River watershed, California.
[See figure 1 for station locations. Grain-size material measured at the U.S. Geological Survey in Menlo Park, California. ft3/s, cubic foot per second; mg/L, milligram per liter; mm, millimeter; µm, micrometer]
[See figure 1 for station locations. Grain-size material measured at the U.S. Geological Survey in Menlo Park, California. ft3/s, cubic foot per second; mg/L, milligram per liter; mm, millimeter; µm, micrometer]
| Map identifier | Station identifier | Date | Time | Streamflow (ft³/s) | Suspended sediment concentration (mg/L) | Sand (greater than 0.063 mm) (%) | Silt (0.004 to 0.063 mm) (%) | Clay (less than 0.004 to 0.063 mm) (%) | Grain size, median (µm) | Grain size, mean (µm) |
|---|---|---|---|---|---|---|---|---|---|---|
| MYG | 11410000 | 11/08/02 | 15:20 | 88 | 48 | 2 | 30 | 68 | 3 | 3 |
| 11/09/02 | 08:17 | 66 | 82 | 0 | 31 | 69 | 3 | 2 | ||
| 12/14/02 | 10:00 | 1,250 | 69 | 7 | 70 | 23 | 11 | 11 | ||
| 12/15/02 | 07:30 | 889 | 37 | 0 | 62 | 38 | 6 | 5 | ||
| 12/17/02 | 13:25 | 170 | 39 | 2 | 65 | 33 | 6 | 6 | ||
| 12/18/02 | 10:00 | 100 | 9 | 0 | 58 | 42 | 5 | 4 | ||
| 12/30/02 | 12:00 | 153 | 4 | 0 | 61 | 39 | 5 | 5 | ||
| 02/06/03 | 08:00 | 158 | 13 | 1 | 54 | 45 | 5 | 4 | ||
| 02/16/03 | 08:00 | 158 | 12 | 0 | 58 | 42 | 5 | 5 | ||
| 02/17/03 | 14:00 | 83 | 5 | 0 | 48 | 52 | 4 | 4 | ||
| 02/17/03 | 14:00 | 83 | 10 | 0 | 65 | 35 | 6 | 6 | ||
| 02/17/03 | 14:00 | 83 | 13 | 0 | 41 | 59 | 3 | 3 | ||
| 03/14/03 | 15:00 | 70 | 12 | 0 | 55 | 45 | 5 | 5 | ||
| 03/15/03 | 15:45 | 1,240 | 223 | 8 | 66 | 26 | 10 | 9 | ||
| 03/15/03 | 15:45 | 1,240 | 219 | 7 | 65 | 28 | 9 | 9 | ||
| 03/16/03 | 15:30 | 105 | 8 | 0 | 54 | 46 | 5 | 4 | ||
| SYG | 11417500 | 11/08/02 | 10:22 | 279 | 105 | 0 | 59 | 41 | 5 | 5 |
| 12/13/02 | 14:22 | 123 | 18 | 0 | 48 | 52 | 4 | 4 | ||
| 12/14/02 | 08:00 | 1,970 | 128 | 9 | 56 | 35 | 6 | 8 | ||
| 12/15/02 | 14:15 | 1,270 | 49 | 6 | 62 | 32 | 7 | 7 | ||
| 12/16/02 | 14:35 | 3,060 | 87 | 18 | 60 | 22 | 10 | 15 | ||
| 12/18/02 | 09:40 | 605 | 9 | 17 | 56 | 27 | 9 | 11 | ||
| 12/30/02 | 16:00 | 750 | 11 | 10 | 57 | 33 | 7 | 8 | ||
| 12/31/02 | 11:30 | 1,190 | 208 | 1 | 58 | 41 | 5 | 5 | ||
| 02/16/03 | 07:00 | 661 | 36 | 7 | 59 | 34 | 7 | 7 | ||
| 02/17/03 | 13:00 | 419 | 5 | 9 | 58 | 33 | 7 | 7 | ||
| 03/14/03 | 16:00 | 409 | 90 | 1 | 54 | 45 | 4 | 4 | ||
| 03/14/03 | 16:00 | 409 | 83 | 0 | 52 | 48 | 4 | 4 | ||
| 03/15/03 | 11:30 | 2,790 | 411 | 22 | 50 | 28 | 9 | 15 | ||
| 03/15/03 | 11:30 | 2,790 | 415 | 24 | 49 | 27 | 9 | 15 | ||
| 03/16/03 | 12:30 | 974 | 11 | 2 | 63 | 35 | 7 | 6 | ||
| YRE | 11418000 | 03/15/03 | 14:10 | 5,400 | 10 | 0 | 54 | 46 | 4 | 4 |
| 03/16/03 | 10:45 | 2,980 | 10 | 0 | 56 | 44 | 5 | 5 |
Normalized by the mean of the two measurements, the concentrations measured in the Marina laboratory were on average 4.9 percent higher than those measured in the Menlo Park laboratory. Generally higher concentrations measured at the Marina laboratory may reflect the different sample-processing techniques used in the two laboratories (removal of organic material from the full sample and ultrasonicating at Menlo Park). The Marina laboratory measurements of sand content averaged 7.0 percent higher than the measurements at the Menlo Park laboratory. This difference may reflect the removal of organic material, perhaps because the H2O2 reaction not only dissolves free-floating organic material but also the thin organic films on the surfaces of sediment grains. In addition, ultrasound dispersal techniques used at the Menlo Park laboratory may break up particle aggregates thereby reducing grain size relative to the undispersed samples. Concentration and percent sand were measured in the Menlo Park laboratory both before and after removal of organics for a subset of 12 samples from February and March 2003. On average, suspended-sediment concentrations were 28.0 percent higher prior to removal of organic material (reflecting 3–26 mg/L of material removed during the reaction with H2O2) and sand contents were 1.4 percent greater.
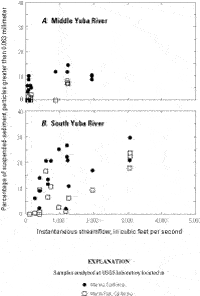
Suspended sediment in the upper Yuba River watershed was dominantly silt and clay (typically greater than 85 percent) during water year 2003, and sand concentrations were higher at the South Yuba River (11417500) gage than at the Middle Yuba River (11410000) gage for similar streamflow rates (fig. 10). Small-volume (5 to 10 pints) samples collected for grain-size analyses resulted in high variability among processed replicate samples. These differences underscore the importance of using large-volume samples to obtain more precise grain-size analyses, especially during low-concentration conditions.
Suspended-Sediment Rating Curves
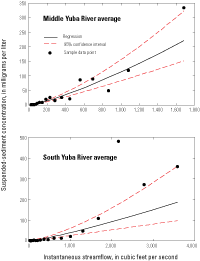
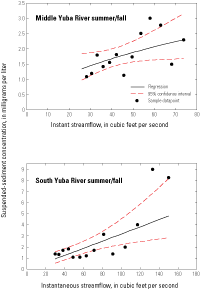
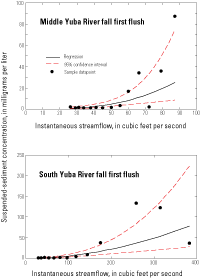
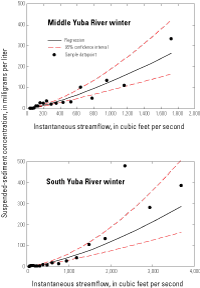
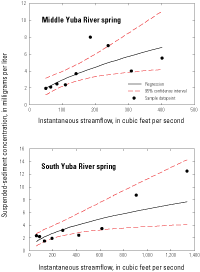
Group-average suspended-sediment rating curves for the Middle Yuba River (11410000) and South Yuba River (11417500) gages describe average, summer/fall, first flush, winter, and spring snowmelt conditions (fig. 11). The form and goodness-of-fit of regressions are shown in table 4. Suspended-sediment concentrations generally increase with increasing streamflow indicating an associated increase in stream power (the ability of the river to transport sediment); however, the slopes of the seasonal rating curves differ significantly. Variations in the slopes of the rating curves indicate changes in sediment supply throughout the water year. Under average and below-average precipitation conditions, such as occurred during the study period, sediment supply is greatest during the first flush of the water year; therefore, the first flush curves for the Middle Yuba and South Yuba Rivers have the greatest slopes. Sediment supplies decreased following the first flush; thus, the slopes of the winter rating curves are lower than those of the first flush curves. The spring and summer/fall rating curves had the lowest slopes, indicating lower sediment supplies during spring snowmelt conditions and throughout the dry summer and fall months.
Table 4
(View this table on a separate page.)
Regression equation form and statistics for gaging stations in the Middle Yuba and South Yuba Rivers in the upper Yuba River watershed, California.
[Note: Regression variables, which include suspended-sediment concentration and streamflow, were converted to base-10 logarithms. r2, coefficient of determination. a is the Y intercept and b is the regression coefficient in equation 1. N, number of data points: Data points were used to determine group-averaged dataset; group-averaged data points were used in the regression analysis]
[Note: Regression variables, which include suspended-sediment concentration and streamflow, were converted to base-10 logarithms. r2, coefficient of determination. a is the Y intercept and b is the regression coefficient in equation 1. N, number of data points: Data points were used to determine group-averaged dataset; group-averaged data points were used in the regression analysis]
| a | b | r2 | Standard error | P value | F statistic | Critical F statistic | 6N | 7N (group-averaged) | |
|---|---|---|---|---|---|---|---|---|---|
| Middle Yuba River (MYG, Station ID 11410000) | |||||||||
| Average1 | −1.776 | 1.278 | 0.95 | 0.165 | 0.000 | 326 | 1.4 | 675 | 19 |
| Summer/fall2 | −0.602 | 0.516 | 0.28 | 0.125 | 0.050 | 5 | 1.5 | 135 | 14 |
| First flush3 | −4.377 | 2.987 | 0.60 | 0.423 | 0.001 | 18 | 1.5 | 154 | 14 |
| Winter4 | −1.838 | 1.317 | 0.91 | 0.207 | 0.000 | 178 | 1.4 | 371 | 19 |
| Spring snowmelt5 | −0.736 | 0.602 | 0.65 | 0.145 | 0.008 | 13 | 1.6 | 174 | 9 |
| South Yuba River (SYG, Station ID 11417500) | |||||||||
| Average1 | −2.066 | 1.221 | 0.87 | 0.310 | 0.000 | 120 | 1.4 | 698 | 20 |
| Summer/fall2 | −1.548 | 1.024 | 0.57 | 0.209 | 0.002 | 16 | 1.5 | 127 | 14 |
| First flush3 | −3.127 | 1.945 | 0.79 | 0.383 | 0.000 | 40 | 1.5 | 145 | 12 |
| Winter4 | −2.750 | 1.460 | 0.91 | 0.273 | 0.000 | 184 | 1.4 | 380 | 20 |
| Spring snowmelt5 | −0.798 | 0.538 | 0.67 | 0.186 | 0.007 | 20 | 1.6 | 165 | 9 |
The accuracy of seasonal suspended-sediment rating curves was assessed based on 95-percent confidence intervals for predicted values (fig.11A–E) and summary statistics (table 4). Confidence intervals denote a range around the predicted value where the "true" value can be expected with a given level of certainty, which is 95 percent in this case, and the confidence interval width indicates uncertainty. The first flush regressions display the widest confidence intervals, and therefore the predicted suspended-sediment concentrations have the greatest associated uncertainty. The confidence intervals for the summer/fall and spring snowmelt rating curves are greater than those for the winter and average curves indicating greater accuracy for the winter and average curves.
The following is a synopsis of the summary statistics presented in table 4. The p value represents the probability of error associated in accepting the predicted results as true. Higher p values indicate less confidence in the regression as a reliable indicator of the relation between suspended-sediment concentration and streamflow. Typically, p values less than or equal to 0.05 are considered borderline statistically significant, p values less than or equal to 0.01 commonly are considered statistically significant, and p values less than or equal to 0.001 often are considered highly significant. The total variation in predicted suspended-sediment concentrations accounted for by the regression equations is given by r2, which can also be used as a measure of the strength of the regression relation. The standard error is an overall indication of the accuracy with which the regression predicts the dependence of suspended-sediment concentration on streamflow; however, the magnitude of the standard error is proportional to the magnitude of the dependent variable. Thus this statistic cannot be used to compare the accuracies of several of the regressions. The p values of all the regressions listed in table 4 were 0.05 or less, indicating statistical significance. In addition, the F statistic was greater than the critical F (alpha = 5 percent) for all regressions in table 4, providing further evidence of statistical significance. The r2 values for the first flush and spring snowmelt regressions for the Middle Yuba and South Yuba Rivers generally were lower than those for the average and winter regressions; the r2 values for the summer/fall regressions were extremely low. Consequently, the average and winter regressions have a greater likelihood for predicting suspended-sediment concentrations closest to the true value.
Bed Load
Bed-Load Rating Curves
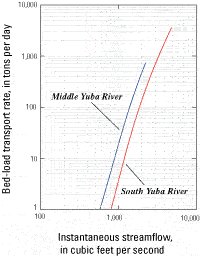
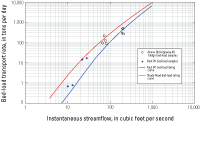
Bed-load rating curves (fig. 12) indicate that the Middle Yuba River has greater transport capacity (the ability to transport bed load) than the South Yuba River for a given instantaneous streamflow, even though bed material at the Middle Yuba River (11410000) gage site (fig. 7) is coarser because of deposition of fine-grained bed material in upstream reservoirs. The greater transport capacity at the Middle Yuba River (11410000) gage, compared with that at the South Yuba River (11410000) gage, can be attributed to a narrower and deeper channel that results in higher streamflow velocities (fig. 8) and to a smaller component of form drag that affects bed-shear stresses. The high slopes of the velocity-streamflow relations (fig. 8) further demonstrate that the Middle Yuba and South Yuba Rivers experience a rapid increase in capacity and competence (the size of the largest particle a stream can entrain under any given set of hydraulic conditions) with increasing streamflow.
Shady Creek Bed-Load Measurements
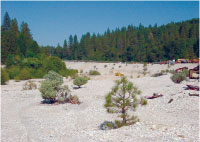
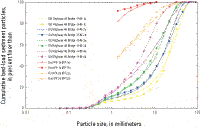
The accuracy of predicted bed-load rating curves was assessed using bed-load measurements collected in Shady Creek, a tributary to the South Yuba River that has been severely impacted by hydraulic mining (fig. 13). Shady Creek bed-load rating curves, a comparison of bed-load measurements and predicted bed-load transport rates, and grain-size distributions of bed-load samples are presented in figure 14, table 5, and figure 15 respectively.
Table 5
(View this table on a separate page.)
Measured bed load and predicted bed-load transport rates for two sites along Shady Creek in the upper Yuba River watershed, California.
[See figure 6 for location of sampling sites. ft3/s, cubic feet per second; tons/day, tons per day]
[See figure 6 for location of sampling sites. ft3/s, cubic feet per second; tons/day, tons per day]
| Predicted bed-load transport rates (tons/day) | ||||||||
|---|---|---|---|---|---|---|---|---|
| Sampling location | Sample number | Date | Time | Streamflow (ft³/s) | Measured bed-load transport (tons/day) | Rust Pit rating curve | Shady Road rating curve | Ratio (predicted/measured)¹ |
| Rust Pit | RP-1a | 02/17/02 | 09:00 | 10 | 0.7 | 0.2 | 29 | |
| RP-1b | 02/17/02 | 09:10 | 13 | 0.8 | 0.5 | 63 | ||
| RP-2a | 04/28/03 | 11:20 | 22 | 14.3 | 2.3 | 16 | ||
| RP-2b | 04/28/03 | 11:30 | 28 | 16.8 | 4.6 | 27 | ||
| Above Old Hwy 49 Bridge | H49-1a | 02/25/04 | 11:15 | 191 | 289.9 | 817.3 | 282 | |
| H49-1b | 02/25/04 | 11:50 | 196 | 480.5 | 817.3 | 170 | ||
| H49-2a | 02/25/04 | 14:40 | 201 | 487.9 | 980.2 | 201 | ||
| H49-2b | 02/25/04 | 15:09 | 207 | 267.7 | 980.2 | 366 | ||
| H49-3a | 02/26/04 | 15:40 | 66 | 94.2 | 134.4 | 143 | ||
| H49-3b | 02/26/04 | 16:16 | 72 | 214.4 | 134.4 | 63 | ||
| H49-4a | 02/26/04 | 10:01 | 77 | 126.3 | 224.5 | 178 | ||
| H49-4b | 02/26/04 | 10:19 | 80 | 89.2 | 224.5 | 252 | ||
Shady Creek bed-load rating curves were developed for two locations (Rust Pit and Shady Road, fig. 6). Subsequent to developing the rating curves, sites were chosen for bed-load measurements. Low streamflow conditions were measured at the Rust Pit wading site and higher streamflow conditions were measured at the Old Hwy 49 Bridge site (fig. 6). Predicted bed-load transport at the Shady Road site was inferred to be representative of bed-load transport at the Old Hwy 49 Bridge site; therefore, the Shady Road rating curve was used to estimate bed-load transport at the Old Hwy 49 Bridge site. Use of the Shady Road rating curve to estimate bed-load transport at the Old Hwy 49 Bridge site was justified based on the equation of continuity and the character of the channel between the two sites. Downstream of the Shady Road site, the channel transitions into a narrower, steeper, bedrock channel with negligible channel storage; therefore following the laws of conservation, bed-load transported past the Shady Road site subsequently passes the Old Hwy 49 Bridge.
Overall, the bed-load measurements agreed well with predicted curves; bed-load measurements were generally within the bounds of the bed-load rating curves (fig. 14). Grain-size distributions for paired bed-load samples agreed well; sediment values were generally within 10 percent of each other (fig. 15). However, transport rates at the Old Hwy 49 site were generally overpredicted and transport rates were generally underpredicted for the Rust Pit site (table 5).
Sediment Transport
There are three ways of defining total sediment discharge, the sum of all sediment passing a gaging station per unit time. (1) Total sediment discharge may be divided into fine-grained material and bed-material fractions. Fine-material discharge consists of particles finer than those normally found in the streambed. Bed-material discharge is composed of particles typically found in considerable quantity in the streambed. (2) Total sediment discharge may be divided into suspended-sediment, whose weight is entirely supported by the surrounding fluid, and into bed load, whose weight is supported primarily by the streambed. (3) Total sediment discharge may also be divided into sampled and unsampled sediment discharge. Owing to physical limitations of depth-integrating suspended-sediment samplers, samples are only collected from the water surface to within 0.3 ft of the streambed. Sampled sediment discharge consists of both fine material and bed material transported in suspension greater than 0.3 ft above the streambed. Unsampled sediment discharge (unsampled by the bed-load sampler) consists of both fine material and bed material transported in suspension less than 0.3 ft above the streambed and bed material transported as bed load. In this report, total sediment discharge equates to the sum of sampled suspended-sediment discharge and estimated bed-load discharge.
Annual Sediment Discharge
Annual sediment discharge was calculated at the Middle Yuba River (11410000) gage and South Yuba River (11417500) gage for water years 2001, 2002 and 2003 (table 6). Suspended-sediment discharge was calculated using seasonal suspended-sediment rating curves and mean daily streamflow, whereas bed-load discharge was calculated using the flow-duration sediment transport method (Glysson, 1987), which employed bed-load rating curves and 15-minute streamflow data.
Table 6
(View this table on a separate page.)
Annual sediment discharge and bed-load estimates for gaging stations on the Middle Yuba and South Yuba Rivers in the upper Yuba River watershed, California.
[Annual suspended-sediment discharge estimated using seasonal suspended-sediment rating curves. Annual bed-load discharge estimated using mixed-sediment model (Wilcock and Crowe, 2003). Total annual sediment discharge equals annual suspended-sediment discharge plus annual bed-load discharge. tons/mi2, tons per square mile; mi2, square mile]
[Annual suspended-sediment discharge estimated using seasonal suspended-sediment rating curves. Annual bed-load discharge estimated using mixed-sediment model (Wilcock and Crowe, 2003). Total annual sediment discharge equals annual suspended-sediment discharge plus annual bed-load discharge. tons/mi2, tons per square mile; mi2, square mile]
| Year | Annual suspended-sediment discharge (tons) | Annual bed-load discharge (tons) | Total annual sediment discharge (tons) | Annual sediment yield (tons/mi²) |
|---|---|---|---|---|
| South Yuba River (SYG, Station ID 11417500 [drainage area 308 mi²]) | ||||
| 2001 | 730 | 1 | 731 | 2 |
| 2002 | 4,700 | 16 | 4,716 | 15 |
| 2003 | 7,600 | 89 | 7,689 | 25 |
| Average annual sediment discharge | 4,379 | 14 | ||
| Middle Yuba River (MYG, Station ID 11410000 [drainage area 198 mi²]) | ||||
| 2001 | 150 | 0 | 150 | 1 |
| 2002 | 910 | 3 | 913 | 5 |
| 2003 | 2,000 | 19 | 2,019 | 10 |
| Average annual sediment discharge | 1,027 | 5 | ||
Estimated annual sediment discharges at the Middle Yuba River (11410000) gage were significantly lower than those at the South Yuba River (11417500) gage even when compared by drainage area. The main contributing factor to the difference in sediment loads is that 88 percent of the Middle Yuba River watershed lies upstream of Log Cabin and Our House Reservoirs. This effect is compounded by significant flow diversions above the Middle Yuba River (11410000) gage, which resulted in a median daily flow for the project period of 57 ft3/s at the Middle Yuba River (11410000) gage compared with 98 ft3/s at the South Yuba River (11417500) gage. Because the South Yuba River has higher flows and no man-made restrictions to sediment movement in the lower basin, it is able to transport a greater and coarser sediment load.
In water years 2001, 2002, and 2003, the Middle Yuba River transported only 9, 14, and 31 percent, respectively, of the load transported by the South Yuba River at the gaging stations. The increase of sediment discharge in water year 2003 at the Middle Yuba River (11410000) gage, relative to that at the South Yuba River (11417500) gage, may reflect the influence of spill events at Log Cabin and Our House Dam reservoirs. Our House Reservoir, the larger of the two facilities, spilled only 1 day in 2001, 11 days in 2002, and 21 days in 2003. Because anomalously high suspended-sediment concentrations (fig. 9B inset) can occur during spill events, annual suspended-sediment discharge may be elevated during years in which these reservoirs spill. Storm sampling in December 2002 and March 2003 indicates that the first spill event in December 2002 flushed a fraction of suspendable-sized reservoir sediment impounded within Log Cabin and Our House Dam reservoirs. As the volume of suspendable-sized reservoir sediment was depleted, subsequent spills, such as occurred in March 2003, contributed smaller amounts of sediment.
The percentage of annual sediment discharge transported as bed load was less than 1 percent throughout the study period, which was quite low and unexpected given the abundance of bed material available for transport. Significant volumes of hydraulic-mining sediment remain stored in smaller upland tributary channels. The mining sediment tends to be finer grained and therefore more transportable than bed material derived from non-mining sources (James, 2005). Consequently, stored sediment from hydraulic mining represents a significant sediment source in the Middle Yuba and the South Yuba Rivers (Curtis and others, 2005).
It is important to note that 88 percent of the Middle Yuba River watershed lies upstream of Log Cabin and Our House Reservoirs; therefore most of the source area for coarser sediment in the Middle Yuba River was cutoff by the reservoirs, which subsequently resulted in decreased bed-load transport and coarsening of the channel bed at the Middle Yuba River (11410000) gage (fig. 7). However, the low bed-load transport rates at the South Yuba River (11417500) gage remain an anomaly (table 6). Below-average to average precipitation conditions occurred throughout the project period, which likely influenced the low percentage of annual sediment discharge transported as bed load. During above-average water years, the percentage of bed load may change as greater streamflows mobilize larger volumes of bed material.
A better representation of the long-term average bed-load transport can be made using estimates of bed load transported by the Feather River. The Feather River is adjacent to the Yuba River and has a similar land-use history including hydraulic mining and timber harvesting. On the basis of deposition in Lake Oroville, long-term average sediment discharge for the Feather River from 1902 to 1962 consisted of approximately 13 percent bed load (Porterfield and others, 1978).
Annual suspended-sediment discharges reported here are compared with those published in the USGS annual data reports (table 7). Annual suspended-sediment discharges published in USGS annual data reports were estimated using a software package called Graphical Constituent Loading Analysis System (GCLAS; http://oh.water.usgs.gov/gclas/). GCLAS is designed to compute mean daily suspended-sediment concentrations and mean daily sediment loads. Using suspended-sediment concentrations and mean daily streamflow, GCLAS implements a user-defined interpolation between suspended-sediment concentration data points to predict a continuous trace of mean daily suspended-sediment concentrations. A typical time series of concentration data includes one concentration data point every 1 to 3 days. Load computations are made by applying a mid-interval method to the concentration time series data, which involves interpolating concentrations during periods between data points. Options for interpolation are user-defined and include linear (preferred) or log-linear equations.
Table 7
(View this table on a separate page.)
Annual suspended-sediment discharge for gaging stations on the Middle Yuba (MYG) and South Yuba (SYG) Rivers in the upper Yuba River watershed, California.
[GCLAS, Graphical Constituent Loading Analysis System, used for U.S. Geological Survey annual data reports (Rockwell and others, 2001; Smithson and others, 2002; Friebel and others, 2003). Percent difference is the difference between the GCLAS and rating curve estimates divided by the GCLAS estimate. Rating curve regression equations listed in table 4 for sample periods]
[GCLAS, Graphical Constituent Loading Analysis System, used for U.S. Geological Survey annual data reports (Rockwell and others, 2001; Smithson and others, 2002; Friebel and others, 2003). Percent difference is the difference between the GCLAS and rating curve estimates divided by the GCLAS estimate. Rating curve regression equations listed in table 4 for sample periods]
| Water year | Sampling period | Annual suspended-sediment discharge | Percent difference | |
|---|---|---|---|---|
| Estimated using GCLAS (tons) | Estimated using rating curves (tons) | |||
| South Yuba River (SYG, Station ID 11417500) | ||||
| 2001 | 11/08/00–09/30/01 | 1,500 | 690 | 54 |
| 2002 | 10/01/01-06/30/02 | 3,400 | 4,700 | -38 |
| 2003 | 11/01/02-05/31/02 | 7,700 | 7,500 | 3 |
| Middle Yuba River (MYG, Station ID 11410000) | ||||
| 2001 | 11/08/00–09/30/01 | 140 | 140 | 0 |
| 2002 | 10/01/01-06/30/02 | 480 | 890 | -85 |
| 2003 | 11/01/02-05/31/02 | 2,400 | 1,900 | 21 |
The two methods for estimating annual suspended-sediment discharge produced substantially different results (table 7). The difference in annual suspended-sediment discharge estimated using the seasonal rating curves and that estimated using GCLAS ranged from –85 to +21 percent for the Middle Yuba River and from –38 to +54 percent for the South Yuba River. The percent difference was generally greatest for water years that had below average precipitation (WY2001 and 2002); however, there was 0 percent difference for the Middle Yuba River in WY2001. Wetter conditions prevailed during WY2003, and the number of samples increased. The time series dataset for suspended-sediment concentrations in WY2003 included four storm sampling events. The increased number of samples collected during WY2003 likely improved the GCLAS estimates of sediment loads.
Event-Based Suspended-Sediment Discharge
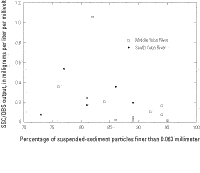
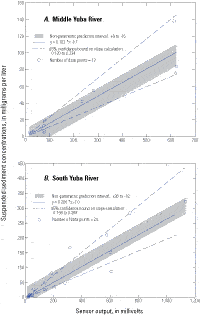
A continuous time series of calibrated OBS data and seasonal suspended-sediment rating curves were used to evaluate event-based suspended-sediment transport. Calibration of the optical backscatter data required a relatively stable particle-size distribution. Over the range of flows represented in the calibration data sets (50 to 2,000 ft3/s), the fraction of fine-grained sediment (percent less than 0.063 mm) remained quite high, varying from 73 to 99 percent, which indicates that fine-grained sediment dominates the suspended load. A plot of the ratio of suspended-sediment concentration to sensor output voltage as a function of suspended particles finer than 0.063 mm (fig. 16) has an essentially constant slope, illustrating the minimal effects of particle size on sensor calibration (fig. 17). At higher flows, as more sand goes into suspension, the effects of particle size likely increase; therefore, sensor calibrations indicate an increase in uncertainty with increasing streamflow, indicated by the large deviation outside the prediction interval by the confidence bounds at higher suspended-sediment concentrations (fig. 17).
The accuracy of the calibrated OBS data was assessed using nonparametric prediction intervals and 95-percent confidence intervals. The nonparametric prediction interval (Helsel and Hirsch, 1992, p. 76) contains one standard deviation (68.26 percent) of the calibration dataset and represents essentially the same error prediction limits as the root mean square (RMS) error of prediction in ordinary least–squared regression, and the confidence intervals represent a range of predicted values where the true value can be expected to fall with 95 percent certainty. The smaller width of the prediction and confidence intervals for the Middle Yuba River calibration equation indicates greater accuracy than that for the South Yuba River calibration equation. In addition, confidence bounds increase with increasing concentration and sensor output voltage, indicating greater accuracy at low to moderate concentrations.
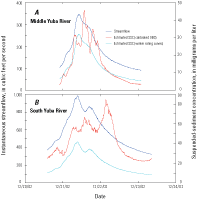
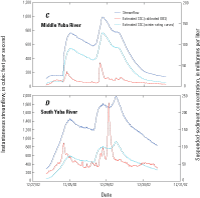
Calibrated OBS data and winter suspended-sediment rating curves were used to evaluate suspended-sediment transport for two moderate discharge events occurring during December 2002 at the Middle Yuba River (11410000) and South Yuba River (11417500) gages (table 8). Figure 18 shows streamflow and predicted suspended-sediment concentrations based on calibrated OBS output and winter rating curves. During the December 20−23, 2002 storm, the OBS registered delayed sediment peaks at both the Middle Yuba River (11410000) and South Yuba River (11417500) gages. The OBS sediment peaks occurred 5 hours after the streamflow peak at the Middle Yuba River (11410000) gage (fig. 18A) and almost 24 hours after the streamflow peak at the South Yuba River (11417500) gage (fig. 18B). Suspended-sediment transport estimated using the winter rating curve during the December 20−23, 2002, storm was 86 percent of that estimated using the calibrated OBS data at the Middle Yuba River (11410000) gage and only 50 percent of that estimated using the OBS data at the South Yuba River (11417500) gage (table 8). During the December 27−30, 2002 storm, the OBS registered early sediment peaks at both the Middle Yuba River (11410000) and South Yuba River (11417500) gages. The OBS sediment peaks occurred 2 hours before the streamflow peak at the Middle Yuba River (11410000) gage (fig. 18C) and 5 hours before the streamflow peak at the South Yuba River (11417500) gage (fig. 18D). Suspended-sediment transport during the December 27−30, 2002, storm, estimated using the winter rating curve, was nearly five times higher than that estimated using the OBS data for the Middle Yuba River (11417500) gage, whereas the two methods gave estimates within 13 percent for the South Yuba River (11410000) gage (table 8).
The percent difference ranged from 50 to −369 percent and an average of the four percent-difference values in table 8 is −79 percent. OBS is preferred over rating curves when event-based suspended-sediment transport is assessed because the OBS data provide an independent, continuous time-series dataset with detailed information about the timing of sediment peaks and the duration of sediment loads, whereas the rating curve is dependent on the streamflow dataset. As a result, rating curves may misrepresent sediment transport in situations where the sediment transport does not mimic streamflow. In these situations, calibrated OBS data can provide a more accurate estimate of suspended-sediment transport.
Compared to the OBS data, the rating curves underestimated suspended-sediment discharge during the December 20−23, 2002, storm characterized by lower streamflows and overestimated suspended-sediment discharge during the December 27−30, 2002, storm characterized by higher streamflows (table 8). This could indicate that the slope of the winter rating curves is too steep such that suspended-sediment concentrations are underpredicted at lower streamflows and overpredicted at higher streamflows (table 8). Alternatively, this may indicate a depletion of suspended sediment resulting in lower concentrations during the December 27−30, 2002, storm that were measured using the OBS but could have been misrepresented by the rating curves, which rely on the streamflow dataset.
Table 8
(View this table on a separate page.)
Event-based suspended-sediment discharge at gaging stations on the Middle Yuba and South Yuba Rivers in the upper Yuba River watershed, California.
[Percent difference is the difference between the OBS (optical backscatter sensor) and rating curve estimates divided by the OBS estimate. ft3/s, cubic feet per second]
[Percent difference is the difference between the OBS (optical backscatter sensor) and rating curve estimates divided by the OBS estimate. ft3/s, cubic feet per second]
| Storm events | Event-based suspended-sediment discharge | |||
|---|---|---|---|---|
| Peak streamflow (ft3/s) | Estimated using OBS data1(tons) | Estimated using rating curves2(tons) | Percent difference | |
| Middle Yuba River (MYG, USGS Station ID 11410000) | ||||
| December 20–23, 2002 | 346 | 21 | 18 | 14 |
| December 27–30, 2002 | 995 | 64 | 300 | –369 |
| South Yuba River (SYG, USGS Station ID 11417500) | ||||
| December 20–23, 2002 | 984 | 200 | 100 | 50 |
| December 27–30, 2002 | 1980 | 520 | 590 | –13 |

