


The purpose of these interpretive discussions is to provide a perspective on regional- and national-scale variations in element and mineral distributions in soils and their likely causes. The significant spatial variations shown by most elements and minerals can commonly be attributed to geologic sources in underlying parent materials, but other spatial variations seem clearly related to additional factors such as climate, the age of soils, transported source material, and anthropogenic influences. We attempt to distinguish the influence of these various factors on a regional and national scale. Numerous more local features might similarly be related to these same factors, but these features also have some probability of being an artifact of a random sampling of variable compositions, so that there is some probability of samples with similar compositions occurring in clusters of two or more adjacent sites by chance. Distinguishing such random occurrences from true variability is beyond the scope of the data from which these maps are constructed. Some caution, therefore, is advisable in interpreting the significance of these more local features unless some unique sources or processes can clearly be related to them.
Beryllium (Be) is a metallic trace element used in alloys with copper (Cu) or nickel (Ni) in the manufacture of springs, gyroscopes, electrical contacts, and spot–welding electrodes. Its alloys are also used as structural material for high–speed aircraft, missiles, and spacecraft. Beryllium is also used as a moderator in nuclear reactors. Beryllium and its compounds are toxic and carcinogenic. Inhalation of Be dust can lead to berylliosis, an incurable inflammation of the lungs. More information about the toxicity of Be (or other elements and substances) and its potential negative human health impacts can be found at the Agency for Toxic Substances and Disease Registry (ATSDR) website, or click to download a fact sheet about Be.
The concentration of Be in soils is primarily controlled by the composition of underlying soil parent materials. The average abundance of Be in the Earth's upper continental crust is approximately 1.9 milligrams per kilogram (mg/kg)(Hu and Gao, 2008). Among common rock types, Be is enriched in felsic igneous rocks, such as granite, rhyolite, and especially pegmatite. Beryllium concentrations can be as much as 5 mg/kg in granite. Pegmatite, with even higher Be concentrations, is sometimes mined for gem–quality beryl (Be3Al2(SiO3)6). Beryllium also can have high concentrations in alkalic igneous rocks, in clay–rich sedimentary rocks, such as shale, and, as Be binds to organic carbon, in coals. Unconsolidated materials, such as alluvial, eolian, and glacial deposits, may also contain Be if an original sediment source contained Be. Beryllium released by weathering in soils is quickly absorbed or incorporated into clays.
Mineral deposits containing Be include localized pegmatites and replacement, nonmagmatic deposits, often with tin (Sn), tungsten (W), molybdenum (Mo), or more rare elements such as lithium (Li) (Barton and Young, 2002). The distribution of mineral resource deposits with Be as a commodity (major or minor) in the United States, extracted from the U.S. Geological Survey (USGS) Mineral Resource Data System (MRDS) website, can be seen by hovering the mouse here. Statistics and information on the worldwide supply of, demand for, and flow of Be–containing materials are available through the USGS National Minerals Information Center (NMIC) website.
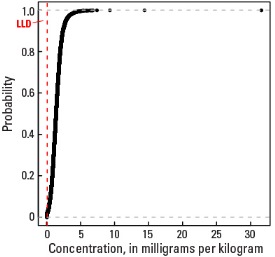
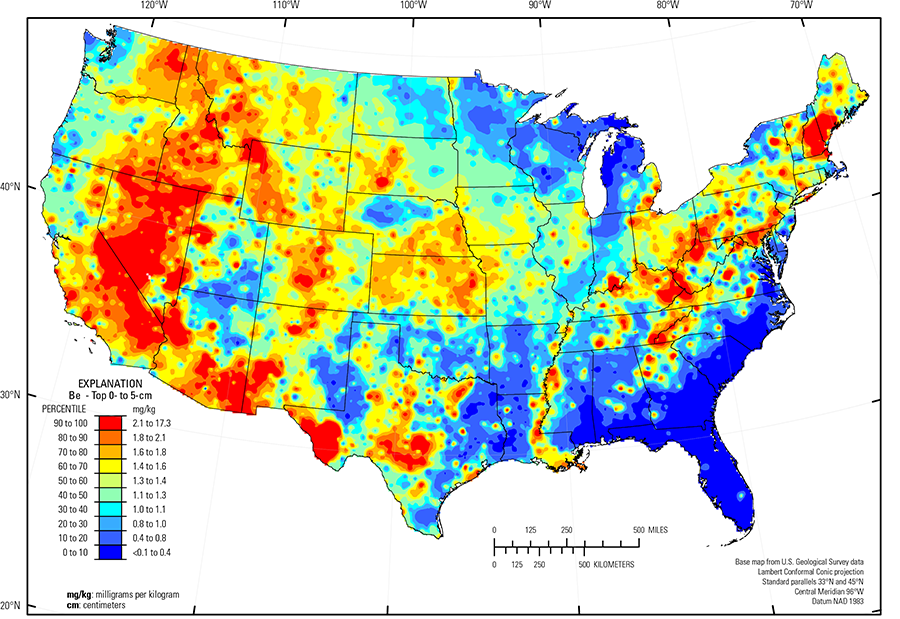
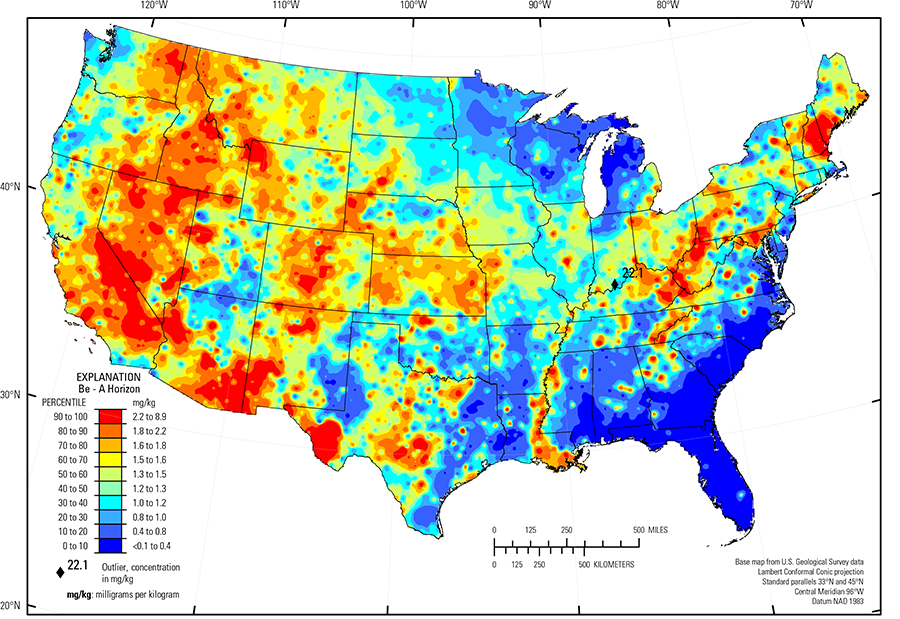
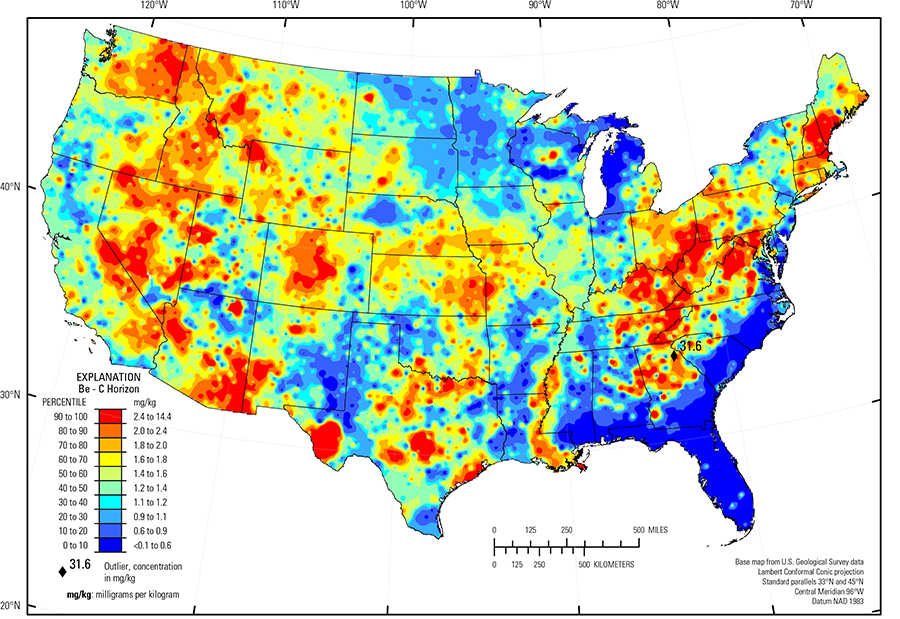
In our data, the median Be concentration is 1.3 mg/kg in the top 0- to 5-cm layer and the soil A horizon, and 1.4 mg/kg in the soil C horizon (see the summary statistics [open in new window]). All but about 2 percent of the samples collected in this study have Be concentrations above the lower limit of determination (0.1 mg/kg). Anomalously high Be concentrations in the soil C horizon (1 site) and in the soil A horizon (1 site) were removed prior to constructing the interpolated maps and are shown as diamond symbols on the maps. Map patterns among the three sample types are regionally consistent, but some marked differences exist for individual sites between topsoils (soil A horizon and top 0- to 5-cm layer) and the soil C horizon.
High Be concentrations occur in soils developed on felsic rocks (granite and rhyolite) and intermediate rocks (alkali basalt or syenite), or unconsolidated materials derived from similar rock types. Many areas with elevated Be concentrations in soils are within mineral districts where Be is (or was) an important commodity. Examples of regions where Be in soils is likely related to felsic rock soil parent materials include:
- Parts of the Central Rocky Mountains and the Southern Rocky Mountains (USDA, 2006), Colorado, Wyoming, Montana, and Idaho (a variety of rock types, including granite and rhyolite);
- Mogollon Transition and Arizona and New Mexico Mountains (USDA, 2006), southwestern Arizona (granite and volcanic rocks);
- West-central Utah (felsic volcanic rocks and related alluvium, area of Spor Mountain, the world's largest economic Be deposit (Barton and Young, 2002);
- Central Sierra Nevada Mountains and Southern Nevada Basin and Range (USDA, 2006), California and Nevada (felsic rocks and related alluvium);
- Trans–Pecos volcanics (Schruben and others, 1997), Texas (rhyolite, alkalic volcanic rocks, and related alluvium);
- Llano Basin, Texas (Precambrian granitic rocks);
- Southern Piedmont and Northern Piedmont (USDA, 2006), from Mississippi to New Jersey (deeply weathered crystalline rock, including granite and felsic metamorphic rocks); and
- Southern Maine and New Hampshire (granite and felsic metamorphic rocks).
In many areas, soils developed on residual shale or alluvium sourced from shale often have elevated Be concentrations. Examples of these areas include:
- Northern Rolling Pierre Shale Plains (USDA, 2006) in western South Dakota;
- Cherokee Prairies (USDA, 2006) in eastern Kansas;
- Much of the east-central part of the country, where soils developed on cyclic beds of sandstone, shale, and coal measures such as the Western and Central Allegheny Plateau (USDA, 2006), Cumberland Plateau (Fenneman and Johnson, 1946) and Southern Appalachian Ridges and Valleys (USDA, 2006).
In the Upper Midwest, melting of glacial ice following late Wisconsinan period advances (16,000 to 12,000 years ago) left the region north of the southern glacial limit (Soller and others, 2012) mantled with a blanket of mixed, immature sediments, from which present day soils developed. Individual ice lobes (Grimley, 2000) created distinct patterns in soil mineralogy and geochemistry because of varying provenance and ice transport paths. Elevated Be concentrations in soils in northern Ohio and southeastern Michigan developed on glacial deposits that incorporated black shale along the ice transport path. A distinct change in Be concentrations is present in soils across the southern glacial limit through Iowa. Soils north of this line with relatively low Be concentrations developed on calcareous till with a carbonate/gray shale provenance. South of the line, soils with somewhat higher Be concentrations are mainly developed on loess.
Large areas of the conterminous United States with low concentrations of Be in soils (and dominant soil parent materials) include:
- Nebraska Sand Hills (USDA, 2006) (quartz–rich, unconsolidated sand dunes and sand sheets);
- Colorado Plateau (USDA, 2006) (quartz–rich sandstone and eolian deposits);
- Southern High Plains (USDA, 2006) in eastern New Mexico and western Texas (quartz–rich eolian sands and alluvial sediments);
- Atlantic and Gulf of Mexico Coastal Plains (Fenneman and Johnson, 1946) (quartz–rich sedimentary rocks and unconsolidated sediments).
The Atlantic and Gulf of Mexico Coastal Plains (Fenneman and Johnson, 1946) are bisected by the Southern Mississippi River Alluvium (USDA, 2006). Alluvial sediments have deposited in the Mississippi River valley as the river flooded in recent geologic time. A pattern of higher Be concentrations in soils developed on these young alluvial sediments reflects long–range transport of Be–bearing material from the upper part of the Mississippi River drainage basin.
The U.S. Environmental Protection Agency (EPA) reports that Be can be atmospherically deposited to surface soils primarily because of coal combustion (download the EPA toxicological review). This may explain the somewhat anomalously high Be concentrations in the soil A horizon and the top 0- to 5-cm layer at a site in southern Indiana.
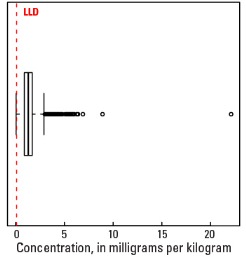
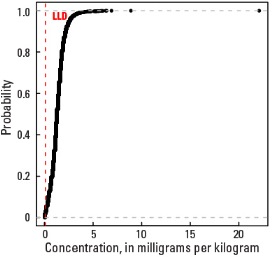
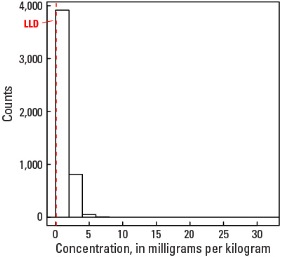
Statistics - 0 TO 5 CM
| Number of samples | 4,841 |
| LLD | 0.1 mg/kg |
| Number below LLD | 97 |
| Minimum | <0.1 mg/kg |
| 5 percentile | 0.2 mg/kg |
| 25 percentile | 0.9 mg/kg |
| 50 percentile | 1.3 mg/kg |
| 75 percentile | 1.7 mg/kg |
| 95 percentile | 2.5 mg/kg |
| Maximum | 17.3 mg/kg |
| MAD | 0.593 mg/kg |
| Robust CV | 45.6% |
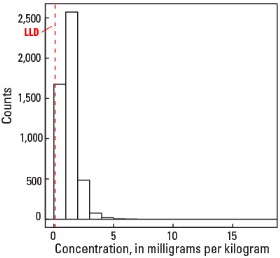
Histogram
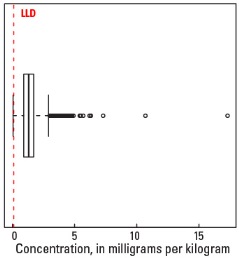
Boxplot
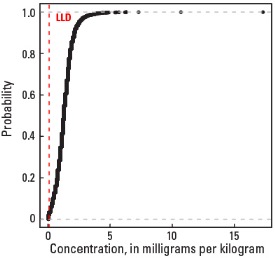
Empirical cumulative distribution function
Statistics - A Horizon
| Number of samples | 4,813 |
| LLD | 0.1 mg/kg |
| Number below LLD | 89 |
| Minimum | <0.1 mg/kg |
| 5 percentile | 0.2 mg/kg |
| 25 percentile | 0.9 mg/kg |
| 50 percentile | 1.3 mg/kg |
| 75 percentile | 1.7 mg/kg |
| 95 percentile | 2.6 mg/kg |
| Maximum | 22.1 mg/kg |
| MAD | 0.593 mg/kg |
| Robust CV | 45.6 % |
Histogram
Boxplot
Empirical cumulative distribution function
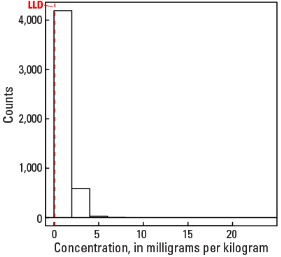
Statistics - C Horizon
| Number of samples | 4,780 |
| LLD | 0.1 mg/kg |
| Number below LLD | 86 |
| Minimum | <0.1 mg/kg |
| 5 percentile | 0.4 mg/kg |
| 25 percentile | 1.0 mg/kg |
| 50 percentile | 1.4 mg/kg |
| 75 percentile | 1.9 mg/kg |
| 95 percentile | 2.8 mg/kg |
| Maximum | 31.6 mg/kg |
| MAD | 0.593 mg/kg |
| Robust CV | 42.4 % |
Histogram
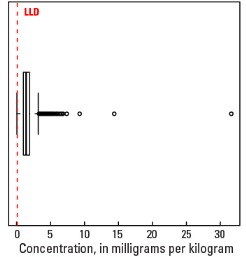
Boxplot