


The purpose of these interpretive discussions is to provide a perspective on regional- and national-scale variations in element and mineral distributions in soils and their likely causes. The significant spatial variations shown by most elements and minerals can commonly be attributed to geologic sources in underlying parent materials, but other spatial variations seem clearly related to additional factors such as climate, the age of soils, transported source material, and anthropogenic influences. We attempt to distinguish the influence of these various factors on a regional and national scale. Numerous more local features might similarly be related to these same factors, but these features also have some probability of being an artifact of a random sampling of variable compositions, so that there is some probability of samples with similar compositions occurring in clusters of two or more adjacent sites by chance. Distinguishing such random occurrences from true variability is beyond the scope of the data from which these maps are constructed. Some caution, therefore, is advisable in interpreting the significance of these more local features unless some unique sources or processes can clearly be related to them.
Indium (In) is a metallic element that occurs in very small concentrations in most natural materials. Its chemical behavior is similar to that of aluminum (Al), gallium (Ga), and thallium (Tl), but In also occurs in more concentrated form in some ores, especially those of zinc (Zn) and tin (Sn). Indium is used in small quantities in a variety of high–tech applications. Most In is used in the manufacture of In–Sn oxide, which is an important component of touch screens, flat–screen TVs, and solar panels. It is produced as a byproduct of Zn mining and refining. It has no known positive or negative health effects, except at extreme exposure levels.
In nature, In often occurs incorporated in common sulfide minerals such as sphalerite ((Zn,Fe)S)), cassiterite (SnO2), and galena (PbS). It also occurs in small concentrations in silicate minerals such as amphibole, biotite, pyroxene, and tourmaline.
The abundance of In in the Earth's upper continental crust is estimated to be about 0.066 milligrams per kilogram (mg/kg) (Hu and Gao, 2008). This is slightly above the lower limit of determination (LLD) of the method used in this survey (0.02 mg/kg)). Most common rock types contain In concentrations between 0.02 and 0.07 mg/kg, with shale, schist, and basalt having the highest concentrations and sandstone, limestone, and ultramafic rocks having the lowest.
The distribution of mineral resource deposits with In as a commodity (major and/or minor) in the United States, extracted from the U.S. Geological Survey (USGS) Mineral Resource Data System (MRDS) website, can be seen by hovering the mouse here. Statistics and information on the worldwide supply of, demand for, and flow of In–bearing materials are available through the USGS National Minerals Information Center (NMIC) website.
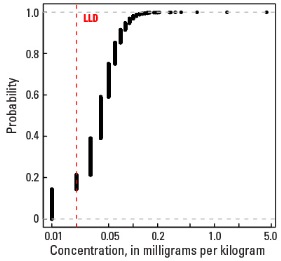
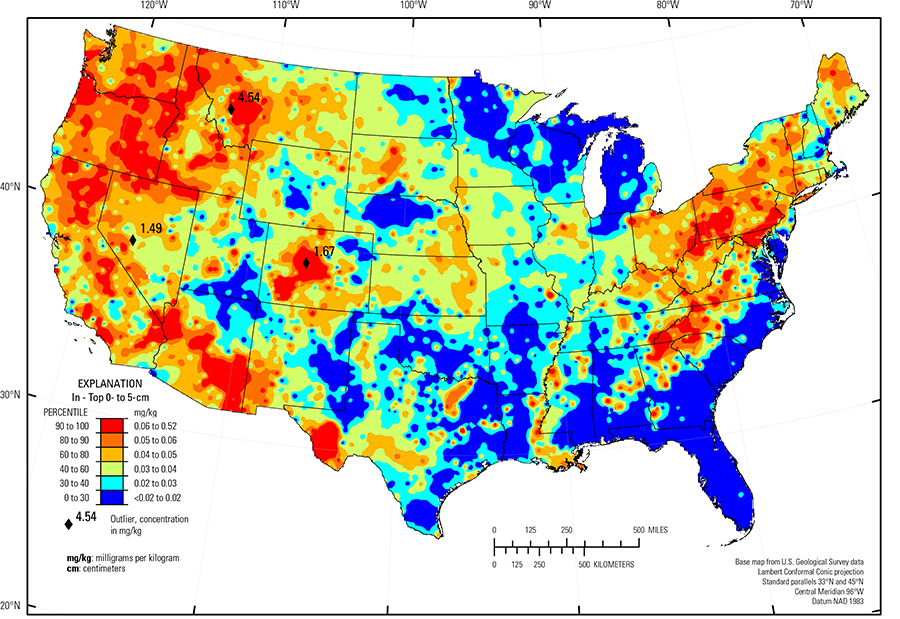
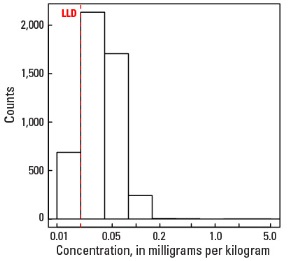
For the soil A horizon and top 0- to 5-cm layer, In concentrations in 21 percent of the samples are less than the LLD. For the soil C horizon, In concentrations in 14 percent of the samples are less than the LLD. The median concentrations of the sample types vary only slightly ranging from 0.03 mg/kg for the soil A horizon and top 0- to 5-cm layer to 0.04 mg/kg for the soil C horizon (see the summary statistics [open in new window]). Because of the large number of samples with concentrations less than the LLD, as well as many other very low concentrations, the maps show only six concentration classes for the top 0- to 5-cm layer and the soil A horizon and seven concentration classes for the soil C horizon rather than the ten classes used for most other elements. It is also important to note that all the color classes except the highest one have a range of only 0.01 mg/kg. This, along with the fact that In concentrations in at least 95 percent of the samples are within five times the LLD, lends caution to the interpretation of the geochemical patterns for all but the highest concentrations.
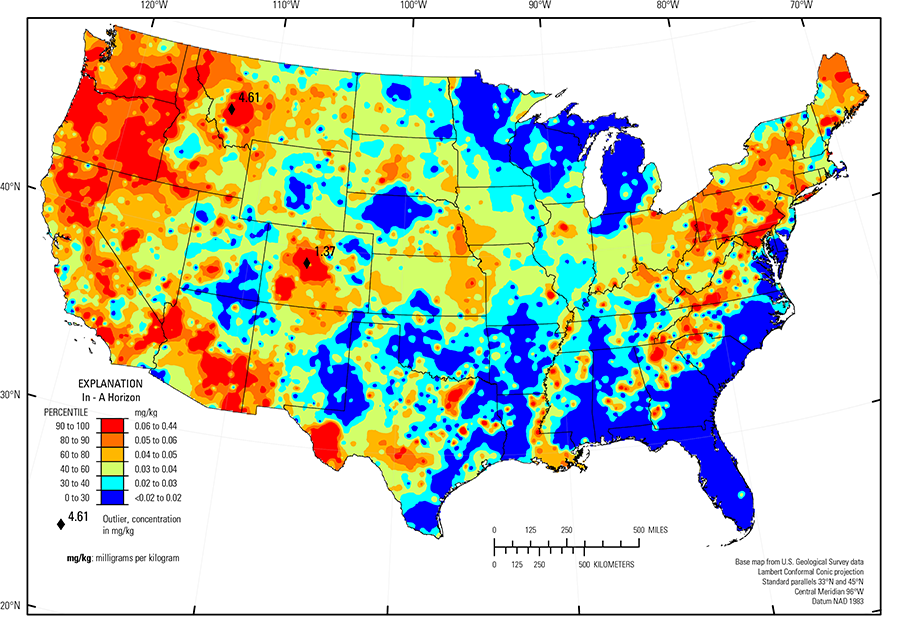
The highest concentrations of In occur in kaolinite–rich soils in the Piedmont and Blue Ridge (Fenneman and Johnson, 1946) physiographic provinces and the Central Allegheny Plateau (USDA, 2006) of the eastern United States. This relationship with clay minerals has also been noted by Ladenberger and others (2015) for European soils. Higher In concentrations in clay–rich soils may be explained by the chemical similarity of In with Al (one of the dominant elements in clay minerals). As In is leached during the weathering process from host minerals such as amphibole, biotite, pyroxene, or tourmaline, it may be incorporated into clay minerals that form during this same time. A second region with elevated In in soils is the Pacific Northwest where relatively high In concentrations occur in soils rich in either kaolinite or plagioclase feldspar. More localized high concentrations in soils occur in:
- Trans–Pecos volcanics (Schruben and others, 1997) in west Texas, underlain by rhyolite, alkali volcanic rocks, and related alluvium;
- Arizona underlain by volcanic rocks;
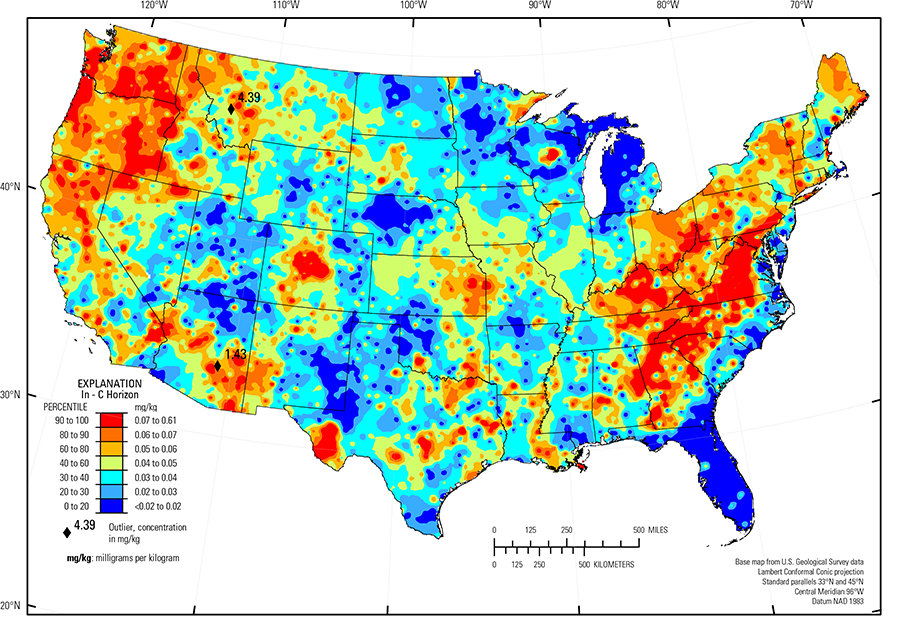
- Duluth Complex, Minnesota (best seen in the map for the soil C horizon); and
- Cherokee Prairies (USDA, 2006) of eastern Kansas and western Missouri, an area where bedrock is sandstone and shale with relatively high Al concentration.
An additional area of elevated In concentrations is in central and southwestern Colorado. This area does not correspond with elevated Al, as is the case with most other In–rich soils, but rather coincides with an area of Zn–rich soils. This is an area containing mineral deposits of several types, many of which contain Zn, suggesting that this area of high In concentrations in Colorado may be an indicator of mineralizing processes that occurred on a regional scale. Another area with elevated In concentrations in soils that may be caused by mineralizing processes is the western Sierra Nevada Mountains (USDA, 2006) and the Sierra Nevada Foothills (USDA, 2006) in California. A belt of high In concentrations corresponds closely with abundant gold deposits throughout that area, which can be seen by hovering the mouse here. Although part of the area also has high kaolinite concentrations, another possible cause of high In concentrations, In–enriched soils correspond more closely to gold mineralization. Indium–rich soils also occur in the Kentucky Bluegrass area (USDA, 2006) and to a lesser degree in the geologically similar Nashville Basin (USDA, 2006) in Tennessee where soils developed on weathered phosphatic limestone. Soils in those areas have low concentrations of both kaolinite and feldspar suggesting that the In is related to some other mineral.
The vertical distribution of In within the soil profile shows a significant enrichment in the soil C horizon throughout the area of the eastern and south–central United States where kaolinite is abundant. As with Al, this may reflect the downward physical transport of fine–grained kaolinite from near the surface to deeper parts of the soil profile.
Statistics - 0 TO 5 CM
| Number of samples | 4,841 |
| LLD | 0.02 mg/kg |
| Number below LLD | 1,017 |
| Minimum | <0.02 mg/kg |
| 5 percentile | <0.02 mg/kg |
| 25 percentile | 0.02 mg/kg |
| 50 percentile | 0.03 mg/kg |
| 75 percentile | 0.05 mg/kg |
| 95 percentile | 0.07 mg/kg |
| Maximum | 4.54 mg/kg |
| MAD | ND |
| Robust CV | ND |
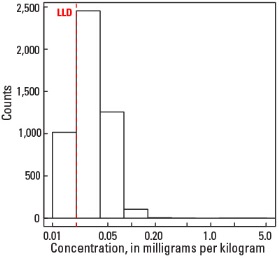
Histogram
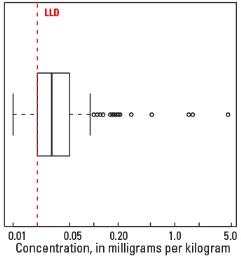
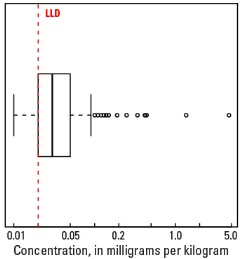
Boxplot
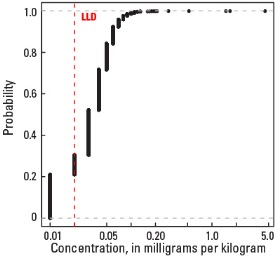
Empirical cumulative distribution function
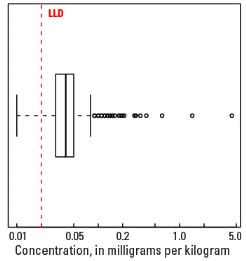
Statistics - A Horizon
| Number of samples | 4,813 |
| LLD | 0.02 mg/kg |
| Number below LLD | 1,017 |
| Minimum | <0.02 mg/kg |
| 5 percentile | <0.02 mg/kg |
| 25 percentile | 0.02 mg/kg |
| 50 percentile | 0.03 mg/kg |
| 75 percentile | 0.05 mg/kg |
| 95 percentile | 0.07 mg/kg |
| Maximum | 4.61 mg/kg |
| MAD | ND |
| Robust CV | ND |
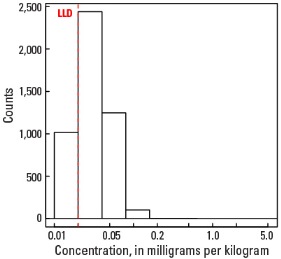
Histogram
Boxplot
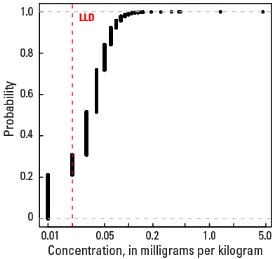
Empirical cumulative distribution function
Statistics - C Horizon
| Number of samples | 4,780 |
| LLD | 0.02 mg/kg |
| Number below LLD | 687 |
| Minimum | <0.02 mg/kg |
| 5 percentile | <0.02 mg/kg |
| 25 percentile | 0.03 mg/kg |
| 50 percentile | 0.04 mg/kg |
| 75 percentile | 0.05 mg/kg |
| 95 percentile | 0.09 mg/kg |
| Maximum | 4.39 mg/kg |
| MAD | ND |
| Robust CV | ND |
Histogram
Boxplot