


The purpose of these interpretive discussions is to provide a perspective on regional- and national-scale variations in element and mineral distributions in soils and their likely causes. The significant spatial variations shown by most elements and minerals can commonly be attributed to geologic sources in underlying parent materials, but other spatial variations seem clearly related to additional factors such as climate, the age of soils, transported source material, and anthropogenic influences. We attempt to distinguish the influence of these various factors on a regional and national scale. Numerous more local features might similarly be related to these same factors, but these features also have some probability of being an artifact of a random sampling of variable compositions, so that there is some probability of samples with similar compositions occurring in clusters of two or more adjacent sites by chance. Distinguishing such random occurrences from true variability is beyond the scope of the data from which these maps are constructed. Some caution, therefore, is advisable in interpreting the significance of these more local features unless some unique sources or processes can clearly be related to them.
Thallium (Tl) is a trace metal that occurs in very low concentrations in many naturally occurring materials. It is used in small quantities in the electronics industry in photoelectric cells. Thallium has no known biological role and is highly toxic. Thallium sulfate was used historically as a rodenticide, but Tl has been banned from household use in the United States since 1974. More information about the toxicity of Tl and its potential negative human health impacts, especially at high occupational levels, can be found at the Agency for Toxic Substances and Disease Registry (ATSDR) website, or click to download a fact sheet about Tl. Thallium is produced as a byproduct of the refining of copper (Cu), lead (Pb), and zinc (Zn) ores. The distribution of mineral resource deposits with Tl as a commodity (major or minor) in the United States, extracted from the U.S. Geological Survey (USGS) Mineral Resource Data System (MRDS) website, can be seen by hovering the mouse here. Statistics and information on the worldwide supply of, demand for, and flow of Tl–bearing materials are available through the USGS National Minerals Information Center (NMIC) website.
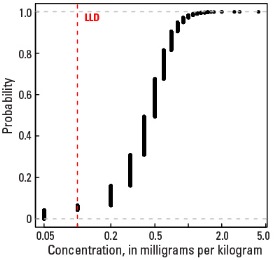
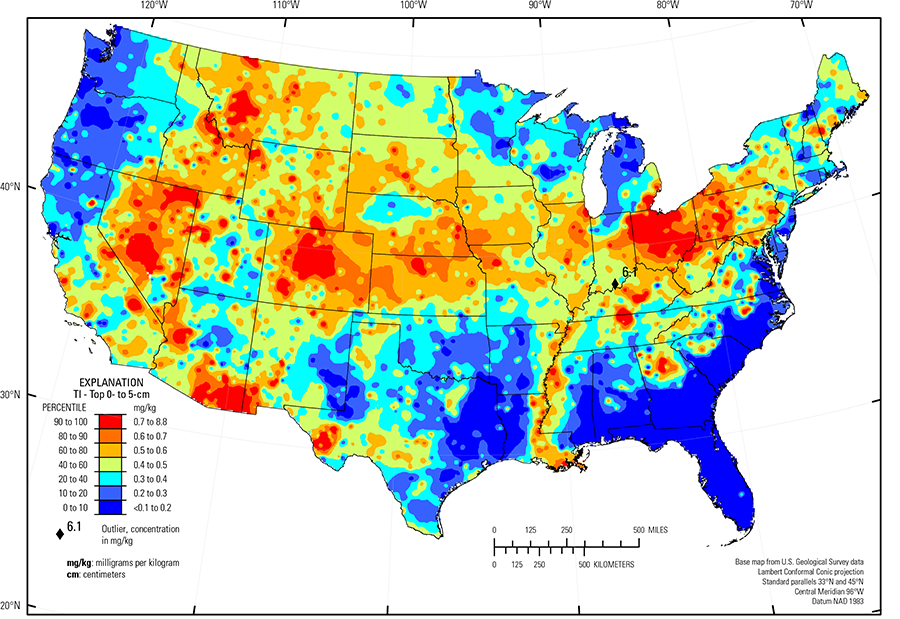
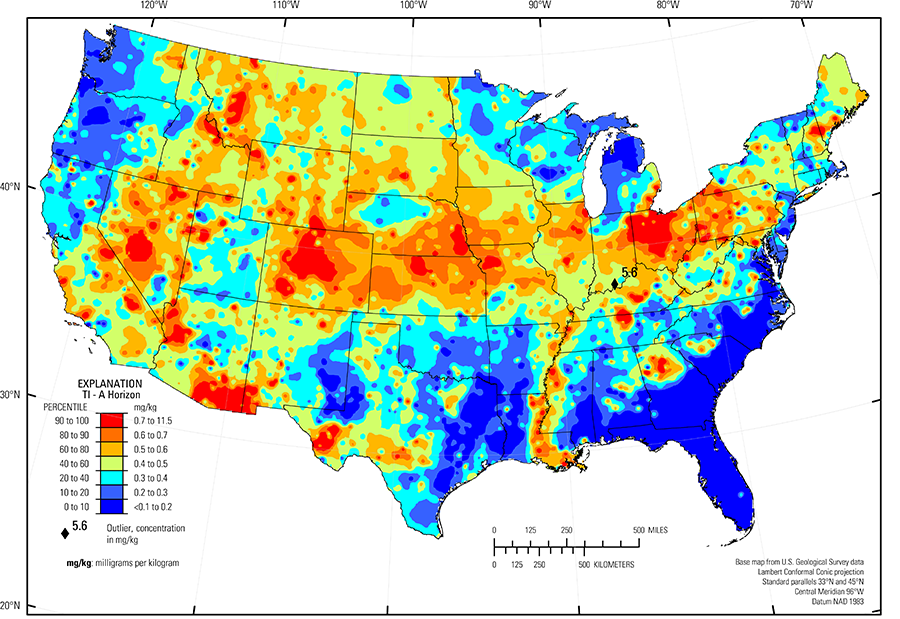
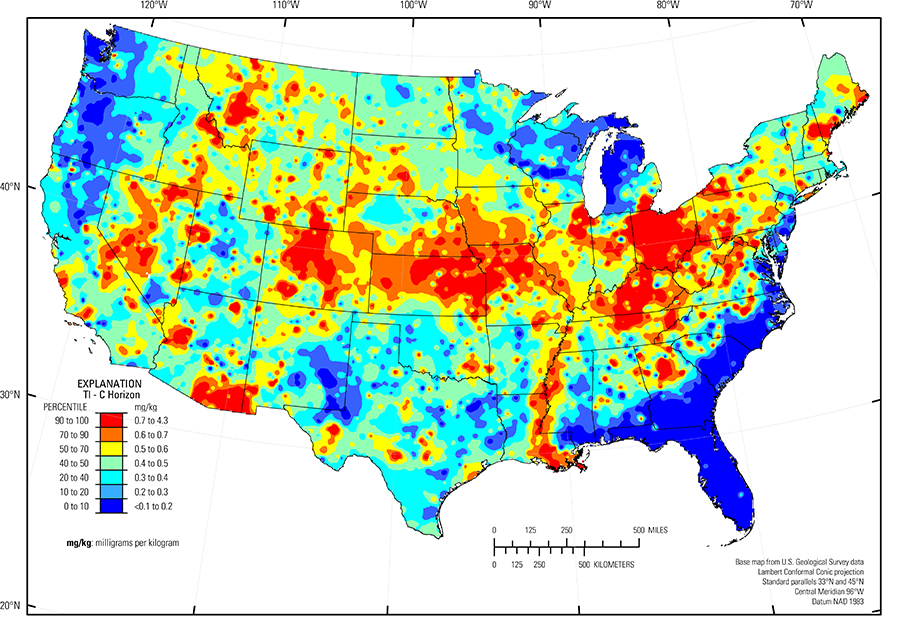
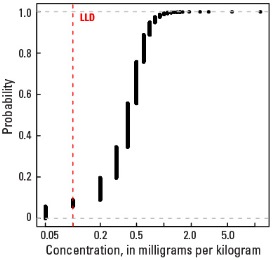
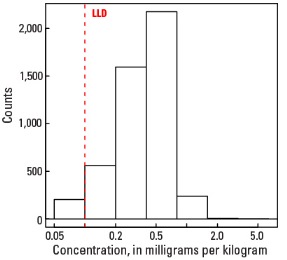
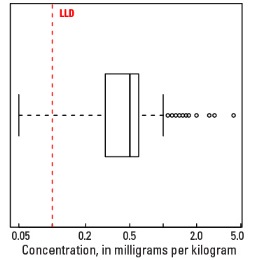
The abundance of Tl in the Earth's upper continental crust is estimated to be approximately 0.55 milligrams per kilogram (mg/kg) (Hu and Gao, 2008). Our data show the median Tl concentration in U.S. soils is 0.4 mg/kg for the soil A horizon and top 0- to 5-cm layer, and 0.5 mg/kg for the soil C horizon (see the summary statistics [open in new window]). Our analytical technique has a lower limit of determination (LLD) of 0.1 mg/kg. Samples from about 300 sites had no detectable Tl at that concentration. Although Tl has a narrow range of concentrations, the data produce a map pattern of higher and lower concentrations that is similar to that of a number of other elements and minerals. Because of this narrow range of concentrations, the maps are classified into 7 intervals rather than 10 intervals used for most other maps.
Thallium has two common oxidation states, +1 and +3, and can exhibit differing chemical behavior depending on its prevalent oxidation state. Thallium in a +1-oxidation state behaves much like the major element potassium (K) and would be expected to occur in K–bearing minerals such as potassium feldspar and 10 Å clays (1 Å (angstrom) = 10-10 meters (m)). In its +3-oxidation state, it can substitute for aluminum (Al) in a variety of aluminosilicate minerals. The distribution of Tl does, in fact, show some similarities to the distribution of K–bearing minerals and to the K content of soils, but little or an antithetic relationship to the Al content, suggesting that most Tl in soils is in the +1-oxidation state and Tl substitutes for K in minerals such as K feldspar and K–rich clays. This is especially evident in areas where soils have low Tl content such as the area dominated by mafic volcanic rocks in the Pacific Northwest, where both K and K feldspar are very sparse. Likewise, the Gulf and Atlantic Coastal Plain (Fenneman and Johnson, 1946), where K feldspars are very sparse, has very low Tl content.
The Gulf and Atlantic Coastal Plain is bisected by the Southern Mississippi River Alluvium and the Southern Mississippi Valley Loess (USDA, 2006). Alluvial sediments have deposited in the Mississippi River valley as the river flooded in recent geologic time. When these sediments dried, winds picked up the fine material and deposited it in thick loess sheets, mainly along the east side of the river valley. The youngest loess sheets are about 10,000 years old. A pattern of higher Tl concentrations in soil developed on these young sediments reflects long–range transport of material from areas containing elevated Tl concentrations in the upper part of the Mississippi River drainage basin.
Thallium is also present in sulfide minerals, especially in pyrite (FeS2). It can also sorb onto iron (Fe) and manganese (Mn) oxides and hydroxides as well as clay and organic matter. Areas with notably higher Tl concentrations are in Ohio and northeastern Illinois. Bedrock in those areas contains significant amounts of shale, including pyrite–bearing black shale, which has likely been dispersed widely because of transport by Pleistocene glaciers. Additional areas of high Tl concentrations are in parts of eastern Montana, South Dakota, Nebraska, Kansas, northern Missouri, and Kentucky, areas where the soil parent material is some combination of shale, loess, and clayey glacial deposits. Other areas of elevated Tl concentration occur in southwestern and central Colorado, western Montana, and southern Arizona where Tl is present as a minor constituent of sulfide–bearing ore in areas of historical or current mining activities.
Statistics - 0 TO 5 CM
| Number of samples | 4,841 |
| LLD | 0.1 mg/kg |
| Number below LLD | 276 |
| Minimum | <0.1 mg/kg |
| 5 percentile | <0.1 mg/kg |
| 25 percentile | 0.3 mg/kg |
| 50 percentile | 0.4 mg/kg |
| 75 percentile | 0.5 mg/kg |
| 95 percentile | 0.8 mg/kg |
| Maximum | 8.8 mg/kg |
| MAD | ND |
| Robust CV | ND |
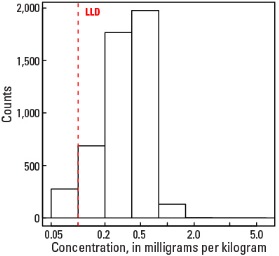
Histogram
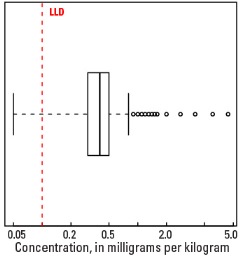
Boxplot
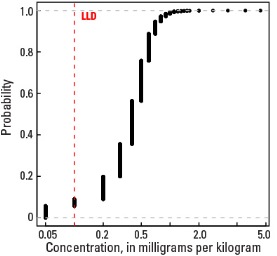
Empirical cumulative distribution function
Statistics - A Horizon
| Number of samples | 4,813 |
| LLD | 0.1 mg/kg |
| Number below LLD | 276 |
| Minimum | <0.1 mg/kg |
| 5 percentile | <0.1 mg/kg |
| 25 percentile | 0.3 mg/kg |
| 50 percentile | 0.4 mg/kg |
| 75 percentile | 0.5 mg/kg |
| 95 percentile | 0.8 mg/kg |
| Maximum | 11.5 mg/kg |
| MAD | ND |
| Robust CV | ND |

Histogram
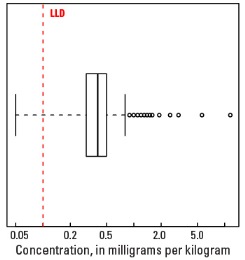
Boxplot
Empirical cumulative distribution function
Statistics - C Horizon
| Number of samples | 4,780 |
| LLD | 0.1 mg/kg |
| Number below LLD | 204 |
| Minimum | <0.1 mg/kg |
| 5 percentile | 0.1 mg/kg |
| 25 percentile | 0.3 mg/kg |
| 50 percentile | 0.5 mg/kg |
| 75 percentile | 0.6 mg/kg |
| 95 percentile | 0.9 mg/kg |
| Maximum | 4.3 mg/kg |
| MAD | 0.148 mg/kg |
| Robust CV | 29.7 % |
Histogram
Boxplot