


The purpose of these interpretive discussions is to provide a perspective on regional- and national-scale variations in element and mineral distributions in soils and their likely causes. The significant spatial variations shown by most elements and minerals can commonly be attributed to geologic sources in underlying parent materials, but other spatial variations seem clearly related to additional factors such as climate, the age of soils, transported source material, and anthropogenic influences. We attempt to distinguish the influence of these various factors on a regional and national scale. Numerous more local features might similarly be related to these same factors, but these features also have some probability of being an artifact of a random sampling of variable compositions, so that there is some probability of samples with similar compositions occurring in clusters of two or more adjacent sites by chance. Distinguishing such random occurrences from true variability is beyond the scope of the data from which these maps are constructed. Some caution, therefore, is advisable in interpreting the significance of these more local features unless some unique sources or processes can clearly be related to them.
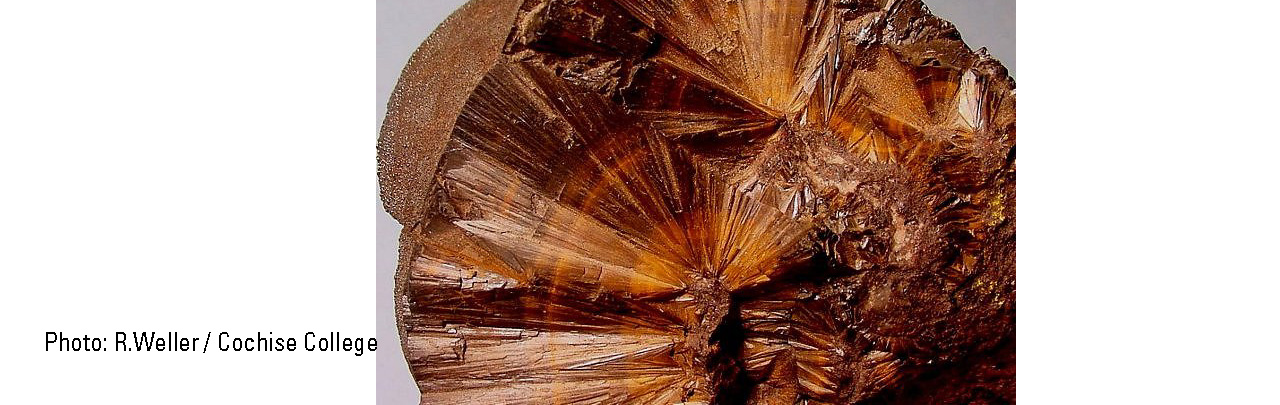
Goethite is a hydrated iron (Fe) oxide mineral (FeO(OH)) that commonly occurs as a weathering product of iron–bearing minerals, such as siderite (FeCO3), magnetite ((Fe,Mg)Fe2O4), or pyrite (FeS2). Goethite is widespread in soils as it can occur wherever weathering of primary Fe–bearing minerals takes place. Iron oxides in soils are strong coloring agents. Oxidized yellow soils are typically dominated by goethite, whereas red soils have a combination of hematite and goethite.
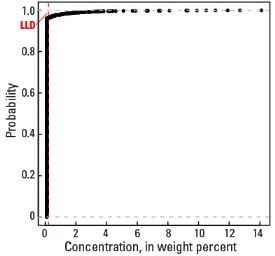
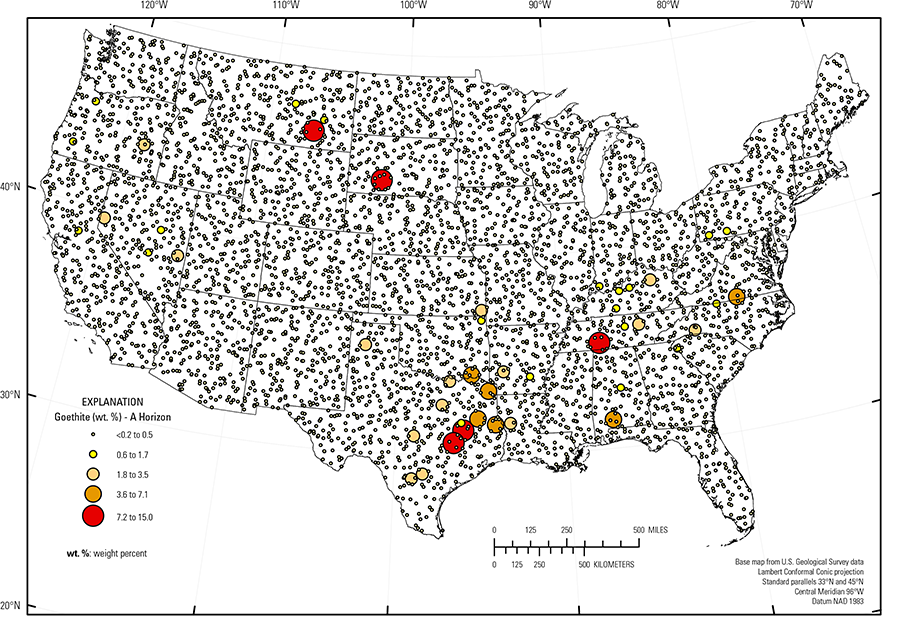
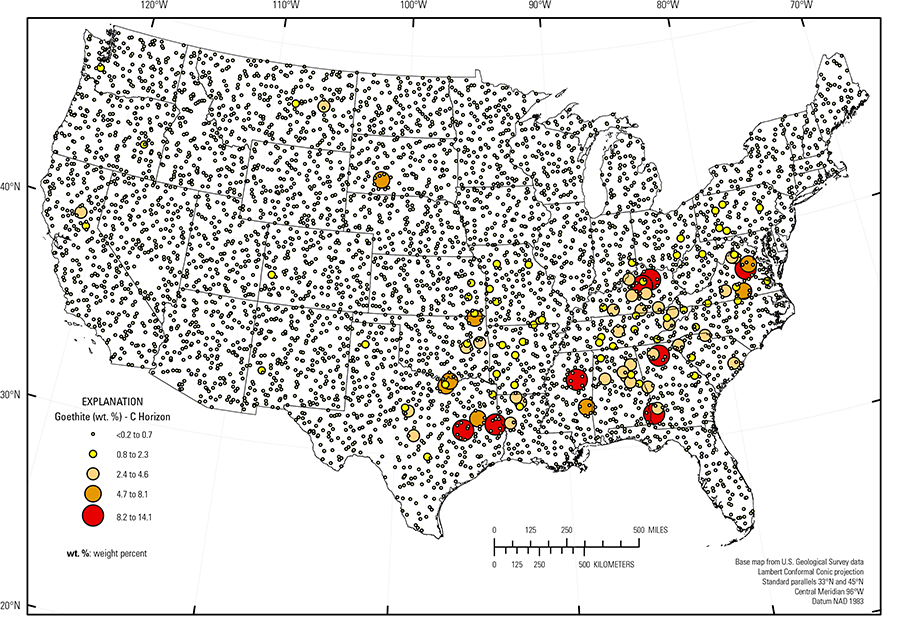
In our data, the detection of goethite is rare. There may be several reasons for this. Compounds with the same chemical formula as goethite tend to be poorly crystalline or amorphous, and thus are not quantified by our method. Also, goethite could be a common component in many soil samples, but at concentrations below the detection limit of 0.2 weight percent (wt. %). Goethite is present in the soil C horizon at 184 sites and in the soil A horizon at 66 sites (see the summary statistics [open in new window]). Because so few samples had goethite concentrations above the detection limit, the spatial distribution is shown as a proportional symbol map rather than an interpolated and smoothed color surface map.
Most goethite occurrences are in the southeastern United States where many soils are highly weathered. It is likely that all goethite in the soil C horizon formed by alteration of primary iron–bearing minerals in the geologic parent materials. Two examples are:
- Two sites in Texas with 12.7 and 14.1 wt. % goethite developed on quartz–rich sands and sandy clays that reportedly contain the mineral glauconite (a potassium (K)–iron silicate mineral); and
- In the Kentucky Bluegrass area (USDA, 2006), soils containing as much as 11.9 wt. % goethite developed on weathered phosphatic limestone that contains reported iron–manganese nodules.
Statistics - 0 TO 5 CM
Statistics - A Horizon
| Number of samples | 4,802 |
| LLD | 0.2 wt. % |
| Number below LLD | 4,736 |
| Minimum | <0.2 wt. % |
| 5 percentile | <0.2 wt. % |
| 25 percentile | <0.2 wt. % |
| 50 percentile | <0.2 wt. % |
| 75 percentile | <0.2 wt. % |
| 95 percentile | <0.2 wt. % |
| Maximum | 15.0 wt. % |
| MAD | |
| Robust CV |
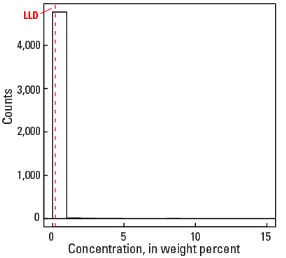
Histogram
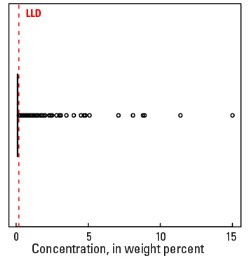
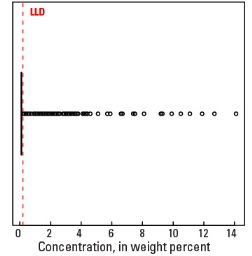
Boxplot
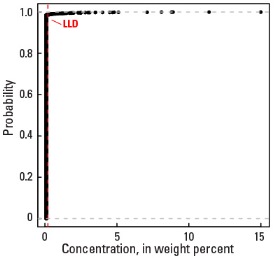
Empirical cumulative distribution function
Statistics - C Horizon
| Number of samples | 4,773 |
| LLD | 0.2 wt. % |
| Number below LLD | 4,589 |
| Minimum | <0.2 wt. % |
| 5 percentile | <0.2 wt. % |
| 25 percentile | <0.2 wt. % |
| 50 percentile | <0.2 wt. % |
| 75 percentile | <0.2 wt. % |
| 95 percentile | <0.2 wt. % |
| Maximum | 14.1 wt. % |
| MAD | |
| Robust CV |
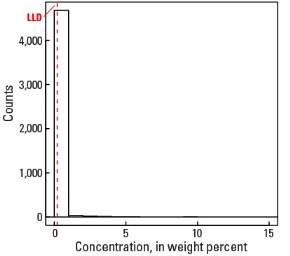
Histogram
Boxplot