1997
1.U.S. Geological Survey
2. Colorado School of Mines
A) Mosaic, Netscape, or other World Wide Web (WWW) network browser software is necessary to view and link the HTML (Hypertext Markup Language) text and GIF (Graphic Interchange Format) images located on this CD-ROM. All computer software on this CD-ROM are present in the "software" directory. Mosaic software are located in the "Mosaic" folder in each of the "mac" (Macintosh), "pcwindows" (PC Windows systems), and "unix" (UNIX) folders. Please refer to the readme files in these folders for information on how to load the software onto your system. Image viewer (such as Lview and JPEGView) software can be used to display the large-scale images. These software programs are commonly accessed by the network browsing software using text and image hooks, an invisible process to users.
B) Movie player software (MoviePlayer, SimplePlayer, Fast Player, Sparkle, and others) is required to open and animate the single-fork stand-alone movies located in the movies directory. Our efforts to get license releases for Apple Computer, Inc. freeware came to naught. Apple QuickTime software for Macintosh and PC/Windows computers is necessary to animate movies. The QuickTime package, which includes MoviePlayer software, is located at the following Web site: http://quicktime.apple.com . An ftp.support.apple.com location is for those of you using File Transfer Protocol. Should these sites change, try searching the WWW using "quicktime software," or similar phrase. Instructions for copying the software from this and other sites are also explained. We recommend copying the packages during evenings or the weekend because of a very limited number of seats. Other movie player software are also available on the WWW. Try searching the web using "movie software" , movieplayer, or other text strings.
C) The home page (homepage.htm) for this document is located in both the root ("USGS_3D") directory and text ("ssx_txt") subdirectory. All HTML text files have ".htm" endings. Non-HTML text files display ".txt" endings.
This CD-ROM publication contains raw and interpreted data, maps, and other graphic displays linked to the geological history and characteristics of the Upper Cretaceous-age Sussex Sandstone of the House Creek oil field, Powder River Basin, Wyoming. Data were statistically analyzed and mapped in 2-D and 3-D, and included as ASCII-formatted, space-delimited data files. Files included on this CD-ROM can be retrieved for use in other applications, including graphics editing and display, mapping, and statistical programs. Graphics are stored as Graphics Interchange Format (GIF) and TARGA (TGA) images (see glossary for explanations of acronyms and words).
World Wide Web (WWW) network browsing software is required to integrate the graphics images and text located on this CD-ROM. While included HTML (Hypertext Markup Language) documents (in the "ssx_txt" directory) can be viewed with standard word-processing software, the interactive capabilities of Web browsing software link text, images, movies, and data. Numerous graphics software programs can view and edit individual GIF and TARGA files which are located in the "ssx_gif," "ssx_tga," and several other directories.
This CD-ROM was produced in accordance with both the ISO 9660 and Macintosh HFS standards. Contained data and text files can be read by platforms supporting either of those standards. Also required is a CD-ROM drive and associated software. Provided graphics and movies are designed for use under DOS/Windows on IBM or 100 percent compatible personal computers (PC's) and the Apple Macintosh family. The stand-alone EarthVision faces file is a 3-D model intended for use on Silicon Graphics Corporation IRIS workstations. This ssxporos.faces file displays porosity distribution and sand-ridge boundaries for the House Creek field. The ssxporos.demo.Z and evview.Z compressed files are located in the "IRIS" subdirectory; these files are intended primarily for archive, but they can be loaded onto an IRIS workstation to create a stand-alone EarthVision 3-D model.
All brand and product names are trademarks or registered trademarks of their respective companies. The tm notation is not appended to these product names, largely because the HTML superscript notation did not work with all World Wide Web (WWW) browsers. The authors primarily use Mosaic as the reference for accessing the information on this CD-ROM. The Mosaic programs located on this CD-ROM are software that are written and upgraded at the National Center for Supercomputer Applications (NCSA) at the University of Illinois in Urbana-Champaign. Included with computer programs located in the "software" directory are general directions to copy Mosaic and other applications for your platform. Other network browsing programs are available and have been used to view this publication.
Mosaic and associated software are available through anonymous FTP (file-transfer protocol) from NCSA. The ftp location is ftp.ncsa.uiuc.edu. Due to the number of people that use, and overload, the network, you may need to make several attempts to access and copy the files from NCSA. We recommend linking with the NCSA network early or late in the day. You are utilizing FTP on UNIX computers; remember that UNIX is case sensitive.
The file-naming convention on this publication is primarily eight dot three. This indicates the file has a maximum of eight characters to the left of and three to the right of the ".". An asterisk (*) is used in this publication as a symbol to match all characters. It commonly indicates a longer file name, for example Mosa*.hqx would access all .hqx files that start with Mosa and end with .hqx, such as Mosaic.hqx.
While this is dependent upon your system and software, stand-alone movies located in the "movie" directory can be opened by 1) starting your movie viewer and opening the movie file, 2) double-clicking on individual movie names or icons, or 3) accessing the movies with imbedded links in the HTML documents, which is the slowest option of the three. The *.MOV movies are designed to run on Macintosh and PC/Windows computers. The movies were created using the QuickTime and GraphicConverter software programs on a Macintosh IIsi. Our experiments with MPEG formatted movies produced lower quality images and are not included with this publication. File names displayed on each movie image are saved as separate GIF and (or) TARGA files; single 3-D images can also be displayed from the "3-D images and movies" subsections of the table of contents.
Files located on this CD-ROM are accessed locally and linked by the WWW browsing software using the File command heading and Open File or Open Local subheadings (generally). For that reason, MacTCP software is not required to view the files. MacTCP v. 2.0.2 (or later) Apple software is needed to connect to a remote host (also known as cruising the Web). MacTCP now comes bundled with System 7.5. Your software needs may be different, depending upon the network browser software utilized.
Each of the below software programs has its own folder(s) within the "mac," "pcwindow," and (or) "unix" subdirectories. Due to the eight-dot-three file-naming convention, most names were shortened. File and software names, and directory locations are listed below. Please refer to the readme files associated with most of the software for information on how to load the programs onto your computer. We recommend opening the readme files using word-processing programs, however, should you access readme files through the below links, return by using arrows, back, or other options on your network browsing software.
GIFConverter 2.3.7 (486 KB) (shareware) - GIFConverter is used to open and read numerous graphic file formats. Formats include GIF, TIFF, RIFF, PICT, JPEG (JFIF), MacPaint and Thunderscan. It can write these formats, as well as black-and-white EPS (encapsulated PostScript). GIFConverter is used to convert files for use in other programs, to view files, and to print them out. The readme.txt file is saved in the "GIFConv" subdirectory as readme.txt. The compressed application program is named GIFConv.SEA .
StuffIt Expander� for Windows expands files compressed in the following formats: StuffIt (.sit), ZIP (.zip), ARC (.arc), Arj (.arj), and gzip (.gz). StuffIt Expander will also decompress files in uuencoded (.uue), BinHex (.hqx) and MacBinary (.bin) formats. Self-extracting archives created by StuffIt, ZIP, and Arj can also be expanded using StuffIt Expander. StuffIt.EXE binary executable is located in the "/software/pcwindow/stuffit" subdirectory.
QuickTime software of Apple Corporation is required to view the movies. Also needed is movie player software, most of which is freeware or shareware. Try searching the WWW using "movie+software" . The current WWW site for information on Apple QuickTime freeware is http://quicktime.apple.com. QuickTime and MoviePlayer software for Macintosh computers and PC/Windows computers can be downloaded from links at http:/www.apple.com, or can be copied using File Transfer Protocol (ftp) with the following command: ftp ftp.support.apple.com . Unfortunately, this anonymous-user ftp site has a small quota, even with an additional ftptoo.support.apple.com site. Because of a limited number of seats, we don't recommend accessing the site during business hours.
Movies can be called up from the text, but access is much quicker directly from the movies folder. Should you have trouble displaying images, try increasing available memory by closing all unnecessary windows and software programs. Shrinking the size of the movies may also aid in their display. We recommend playing with the menu bar located at the top of the movies and the bounding scroll bars; both to improve the image display and to familiarize yourself with program capabilities, including print and file export.
The six movies located in the "movies" folder display 3-D distribution and volumes of porosity and permeability for the Upper Cretaceous age Sussex "B" sandstone across the southern two-thirds of the House Creek oil field, Powder River Basin, eastern Wyoming. Information on data sources, and technical and research methodology are in the techinfo.htm file located in the "ssx_txt" directory. A glossary is included (glossary.htm) in the "ssx_txt" subdirectory for definitions of computer and geologic terms.
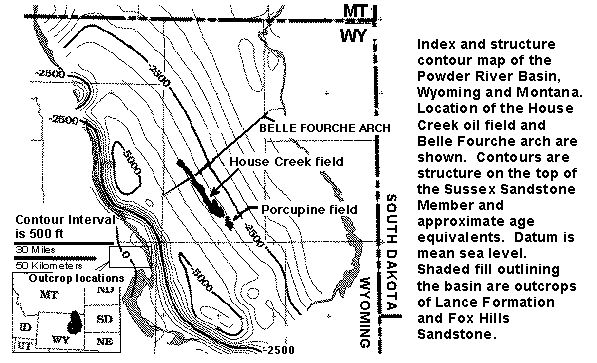
Figure 1. Structure contour map on the top of the Upper Cretaceous Sussex Sandstone Member of the Cody Shale, and approximate age equivalents, Powder River Basin, Wyoming and Montana. Location of the House Creek field is shown. Areal extent of the Sussex "B" sandstones is delineated by black-colored fields. Shaded fill outlining the basin are outcrops of Lance Formation and Fox Hills Sandstone. The rectangle located next to the 30-miles scale bar defines the area of studied outcrops of the Sussex and Shannon Members, much of the Salt Creek anticline, and the towns of Midwest and Edgerton. Contour interval is 500 ft. Datum is mean sea level. A detailed (176 KB) version is named indexfig.gif.
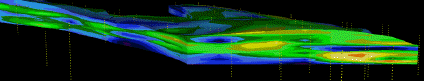
Vertical exaggeration of the 3-D images ranges from 20 to 60 times. The Sussex "B" sandstone is less than 60 ft (18 m) thick and would look like a razor's edge without the exaggeration. The House Creek oil field is about 1 mi (1.6 km) wide and, combined with the small Porcupine field at the southern boundary, is about 36 mi (58 km) long. Reservoir-grade intervals in images are shown on the porosity (left) color bar by green through red (8 to 21 percent porosity); low-porosity non-reservoir intervals are purple and blue (1 to 8 percent porosity). Movies show:
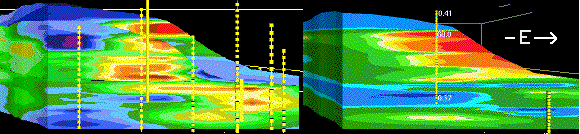
Figure 20. East-west oriented vertical slices of porosity (left, percent) and permeability (right, mD). This image (porpermv.gif) shows the highly variable porosity (left) and permeability (right) using core data. Porosity values/colors are reservoir grade (green through red) of 8 through 21 percent, and below-reservoir-grade low-porosity (blue) of less than 8 percent. Permeability ranges are: purple and blue, up to 5 mD; green, 5 to 16 mD; and yellow through red are greater than 16 mD. Average permeability of Sussex "B" reservoir sandstones is 15 mD. The close-spaced 3-D grid essentially treats each well as a separate set of points for the purpose of showing the variation in porosity and permeability. The various diamond shapes and streaks of low through high porosity and permeability illustrate the interbedding of thin beds of reservoir- and non-reservoir-grade sandstone and mudstone. These diagrams include the eastward and upward increases in porosity and permeability, and stacking of sand ridges shown in previous images. This slice is located in the northwestern half of the field. Yellow dots are (left) core and well-log and (right) core sample locations. Slices are 1.8 mi (2.8 km) wide and 50 ft (15 m) high. Vertical exaggeration is 30x. Respective names of the east-west porosity and permeability slide-image files are 3dew_img.htm and 3dvk_img.htm .
Individual GIF files used to generate the movies are stored in the below directories (bounded by parentheses); GIF files are displayed in the text portion of this publication as single images, and as slide shows using an external viewer, such as JPEGView and LView.
All movies are stored in the movies directory;
This document explains how to access, use, and copy the various software, image, and text files located on this CD-ROM. The following terms and abbreviations are explained in the glossary that is included on the CD-ROM. NCSA (National Center for Supercomputing Applications) Mosaic and other World Wide Web (WWW) software allow the viewer to read and display individual image and HTML text files. Included in the readme1.htm file are directions for copying Mosaic and other software to your PC/Windows, Macintosh, and (or) UNIX platforms. readme1.txt is the standard text version of readme1.htm. Stand-alone movies are linked graphic interchange format (GIF) images for viewing on Macintosh and PC Windows computers. Because the MPEG format movies we created had poor visual quality, we decided not to include them on the CD-ROM. The EarthVision stand-alone model showing 3-D porosity for the Sussex "B" sandstone is designed to run on IRIS workstations. Your computer's ability to view the images may be limited by its random access memory (RAM); it may help to close any unnecessary programs and open windows.
Insert the CD ROM in your CD-ROM reader. Text and images are viewed using network browsing software. Text files are stored in the "ssx_txt" directory; links among these HTML files are shown in the table of contents and included in most displays. While many are saved as text files that can be opened using most word processing software, the WWW browsing display abilities result in much cleaner viewing. The movies, located in the "movie" directory, display 3-D porosity and permeability across the House Creek field. These are animated by clicking on the *.MOV icons or file names. Movies can also be accessed from text hooks in some of the HTML files. The stand-alone 3-D porosity model will only run on IRIS workstations and on SUN workstations that possess a special graphics template. The (zipped) ssxporos.demo.Z 3-D model is located in the "IRIS" directory and can be started by opening the evview.Z file (zipped EarthVison View program).
The Home Page, or start of the Mosaic document (or other network browsing software) can generally be invoked by double-clicking the Mosaic name or icon. Once the browsing software is initiated, start this 3-D CD-ROM publication by opening the homepage.htm file under the open local or other file access command. These are commonly located under the File banner located at the top of your computer screen. We recommend that you peruse these menu items so that you will know your viewing, printing (also under File), and file-saving options. Depending on your computer system, size of the open window can be adjusted using the arrow key.
This CD-ROM contains geologic and geochemical data collected as part of the Reservoir Characterization and 3-D Reservoir/Basin Characterization for CD-ROM Projects of the U.S. Geological Survey. Information presented here is intended to address the national plans of Energy Information Transfer and Energy Environmental Investigations and Assessments. This publication contains raw and interpreted data, maps, and other graphic displays for the Upper Cretaceous Sussex Sandstone in the House Creek oil field, Powder River Basin, Wyoming. Location and geologic explanations are included in the Geology of the Sussex Sandstone and other sections.
Data sources include 1) core data from Kerr-McGee, Meridian Oil, and Woods Petroleum Corporations, 2) bore-hole history and lease and field production information from Petroleum Information Corporation, and 3) geologic, geophysical, and geochemical data generated and interpreted by USGS scientists.
This publication is intended to serve a broad audience. An important purpose is to explain geologic and geochemical factors that control petroleum production from the House Creek field. This information may serve as an analog for other marine-ridge sandstone reservoirs. The 3-D slide and movie images are tied to explanations and 2-D geologic and geochemical images to 1) visualize geologic structures in three dimensions, 2) explain the geologic significance of porosity/permeability distribution across the sandstone bodies, and 3) tie this to petroleum-production characteristics in the oil field. Digital publications are an important medium to archive maps, figures, and large volumes of geologic and geochemical data that would otherwise be lost. Movies, text, images including scanning electron photomicrographs (SEM), thin-section photomicrographs, and data files can be copied from the CD-ROM for use in external mapping, statistical, and other applications.
Data has been statistically analyzed and mapped in 2-D and 3-D and included in the "data_set" directory as ASCII-formatted, row- and column-delimited data files. Files located on this CD-ROM can be read on UNIX, Macintosh, and PC/Windows computers. Information on how to access and read the contents is located in the following files: readme1.htm and .txt (readme first), and techinfo.htm (technical information on data sources).
The Upper Cretaceous Sussex "B" sandstone was deposited as a probable transgressive-marine sand-ridge complex in a mid-shelf position. The "B" sandstone is bounded by upper and basal disconformities and encased in mudstones and low-porosity and low-permeability sandstones of the Cody Shale. Reservoir characteristics are controlled primarily by depositional and diagenetic heterogeneity at megascopic (field), macroscopic (well), and microscopic (rock sample) levels. To simplify, this means production of oil is controlled by stacking and interbedding of sandstone and mudstone beds and by geochemical changes through time that affect flow of fluids through the rock.
More than 24.8 million barrels of oil (MMBO) have been produced from the Sussex "B" sandstone in the House Creek field, Powder River Basin, Wyoming. Greatest oil production, porosity, and permeability, the thickest reservoir sandstone intervals, and best lateral continuity of the primary reservoir facies are all located parallel and proximal to field axes. Decrease in reservoir quality west of the axes is due to greater heterogeneity from interbedding of low- and moderate-depositional-energy facies, with associated drop in porosity and permeability. Decrease in production east of the axes results primarily from a combination of seaward thinning of the primary reservoir facies and non-deposition of sand ridges.
The House Creek field has two axis orientations; these are related to depositional patterns of the four sand ridges. Deposition of the "B" sandstone began in the southeastern corner of the field with sand ridge 1; axis orientation is about north 20 degrees west. Later-deposited sand ridges 2 through 4 are located west and north of sand ridge 1; their axis orientations are approximately north 32 degrees west. Progressive northward deposition of later sand ridges is probably concurrent with uplift of the northeast-trending Belle Fourche arch. Movement along the arch and of lineaments may have caused topographic highs that localized Sussex and Shannon deposition proximal to the arch.
Three-dimensional images and stand-alone movies reveal porosity and permeability distribution within, and stacking patterns of sand ridges. These models show:
Images and movies displaying 3-D slices of the porosity and permeability models of the Sussex "B" sandstone are tied to descriptions of Powder River Basin and Sussex "B" sandstone geology, statistics on porosity and permeability distribution across the field, and images of core, outcrops, and thin-section and SEM photomicrographs. The purposes are to characterize relative influence of depositional and diagenetic processes on distribution of hydrocarbons in the House Creek field and to visualize these processes. Technical information on geologic, geochemical, and computer geologic methods of analysis are detailed in Technical information on data sources (techinfo.htm). Diagenetic and depositional environment research (Higley, 1994) is based on petrographic analysis of about 60 thin sections, carbon and oxygen isotopic analysis of about 20 samples of carbonates, cathodoluminescence, SEM, and X-ray diffraction studies, and core, outcrop, and well-log studies. Well-logs for approximately 500 boreholes in the field area and 120 within the House Creek and Porcupine oil fields were used to map locations of the Ardmore bentonite, tops and bases of the Sussex "B" sandstone and included sand ridges, and well-history data. Sussex and Shannon Sandstones Members core porosity and permeability data was derived for 37 wells; this information for 13 Sussex "B" sandstone intervals augmented well-log porosity data for an additional about 90 wells.
As detailed in readme First (readme1.htm), links among text, images, and movies are accomplished with pointing and clicking with computer mouse buttons. An asterisk (*) indicates a longer or variable file name. Most image files are saved in separate directories in Targa (*.tga and *.TGA) and GIF (*.gif and *.GIF) graphic formats. Images within this Geology of the Sussex Sandstone section and subsections are located in the "ssx_gif" and "ssx_tga" directories and are generally saved as full-size and scaled-down images. The "scaled down" images are half or less the dimensions and file size of the full-scale ones; they are accessed more quickly on this CD-ROM then are the large images. File names and sizes accompany figures.
The Powder River Basin of Wyoming and Montana is an asymmetric Laramide-age structural basin with a steeply dipping western flank and a gently dipping eastern flank. The Upper Cretaceous Cody Shale, including the Sussex Sandstone Member and its age equivalents, underlies most of the Powder River Basin and outcrops along the western flank, west of the outcrops of Lance Formation and Fox Hills Sandstone shown as shaded fill on figure 1. The informally named Sussex "B" sandstone unit of the Sussex Sandstone Member has a limited areal extent that is approximated by the outlines of the House Creek and Porcupine oil fields shown on figure 1.
The House Creek field is located on the gently-dipping eastern flank of the Powder River Basin in Wyoming. The field trends about N. 40 degrees W., approximately parallel to present-day basin structure contours. It is about 1 mi (1.6 km) wide and, combined with the small Porcupine field at the southern boundary, is about 36 mi (58 km) long. A narrow zone of non-oil-productive, low-permeability marine mudstone separates these two fields. Oil from both fields is produced from the Upper Cretaceous Sussex "B" sandstone. Depths of the Sussex "B" sandstone in the fields ranges from about 7,000 to 9,000 ft (2,100 to 2,700 m), and in thickness up to 52 ft (16 m); average thickness of the reservoir interval totals about 20 ft (6 m).
Figure 1. Structure contour map on the top of the Upper Cretaceous Sussex Sandstone Member of the Cody Shale, and approximate age equivalents, Powder River Basin, Wyoming and Montana. Location of the House Creek field is shown. Areal extent of the Sussex "B" sandstones is delineated by black-colored fields. Shaded fill outlining the basin are outcrops of Lance Formation and Fox Hills Sandstone. The rectangle located next to the 30-miles scale bar defines the area of studied outcrops of the Sussex and Shannon Members, much of the Salt Creek anticline, and the towns of Midwest and Edgerton. Contour interval is 500 ft. Datum is mean sea level. A detailed (176 KB) version is named indexfig.gif.
This reservoir characterization of the House Creek oil field integrates depositional energy and environments, facies distribution, and burial diagenesis. These factors influence petroleum production by controlling;
The informally named Sussex "B" sandstone is one of as many as 12 separate sandstone bodies that are located at different vertical and lateral positions within the Sussex Sandstone Member (Anderman, 1976; Crews and others, 1976). Figure 2 is a generalized stratigraphic section for Cretaceous and Tertiary sediments in the basin, including major unconformities.
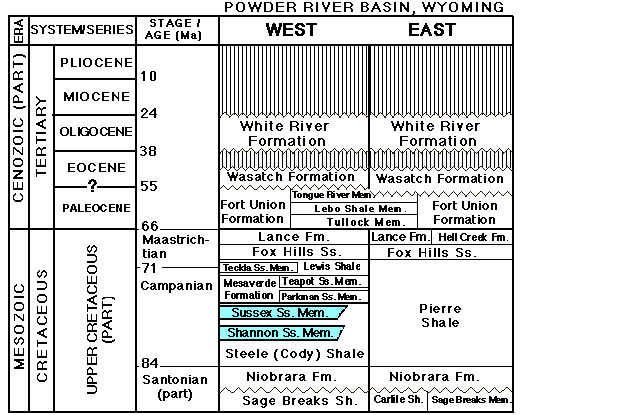
Figure 2. Stratigraphic nomenclature for Late Cretaceous and Tertiary rocks, Powder River Basin (stratprb.gif, 32 KB).
The Cretaceous epicontinental seaway connected the Gulf of Mexico with the Arctic Ocean during deposition of the Upper Cretaceous Cody Shale, as shown on figure 3 (Brenner, 1978, Gill and Cobban, 1973). The western margin of the seaway was marked by a tectonically active thrust belt that extended from Alberta to southern Nevada and included the actively growing Rocky Mountains. The eastern margin of the region was a relatively stable cratonic hinge zone that extended from Minnesota to eastern Kansas (Witzke and others, 1983).
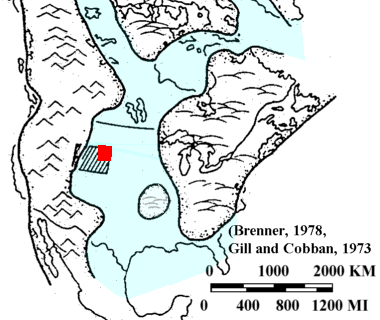
Figure 3. Map showing Cretaceous epicontinental seaway paleogeography during Campanian time (Late Cretaceous) (modified from Brenner, 1978, reprinted by permission, Gill and Cobban, 1973) (wseaways.gif). The large rectangle is Wyoming, the small one shows location of the Powder River Basin.
Late Cretaceous time was marked by episodic transgression and regression of the Cretaceous epicontinental sea (Weimer, 1984), which resulted in deposition of primarily marine sediments in the northern part of the seaway. Kauffman (1977) lists as many as 10 transgressive-regressive cycles for the Western Interior during Cretaceous time. This list includes marine transgression during the time of deposition of the Sussex Sandstone Member, followed by regression of the sea. These cycles are correlative around the world and were based on biostratigraphy and radiometry (Vail and others, 1977).
Distinct eastward changes in shelf, slope, and basin morphology have been mapped in the Powder River Basin by Loutit and others (1988), who believe that a eustatic sea level rise in latest Maastrichtian time, about 67 million years ago (Ma), significantly affected sedimentation patterns on continental margins; this event roughly correlates with the start of the Laramide orogeny (Tweto, 1975, 1980). Lillegraven and Ostresh (1990), however, postulate that Upper Cretaceous time in the seaway is marked by a very slow regional regression of the shoreline that is consistent with global lowering of sea level for this time period; their data are based largely on mapping and analysis of ammonite zones. Their evidence indicates that shoreline position during Late Cretaceous time was relatively static and considerably west of Sussex "B" sandstone deposition.
During Campanian time (74-84 Ma) most of the Powder River Basin was part of a broad muddy shelf. Pierre and Cody Shales deposition is characterized by mainly marine muds punctuated with relatively thin sands (Brenner, 1979). During deposition of the Cody Shale, regional morphology consisted of a distinct shelf, slope, and basin configuration; relief on the shelf may have been about 1,000 ft (300 m) in the eastern part of the Powder River Basin (Asquith, 1970). The abrupt eastern termination of the Sussex Sandstone corresponds with thinning and eventual pinchout of the Sussex interval (Brenner, 1979).
The Upper Cretaceous Sussex "B" sandstone was deposited in a probable mid-shelf position in the Cretaceous epicontinental seaway (Higley, 1994). Basin morphology during deposition of Sussex and Shannon shelf sandstone beds in the Powder River Basin is illustrated on figure 4 (shelfmod.gif) (Tillman and Martinsen, 1984).
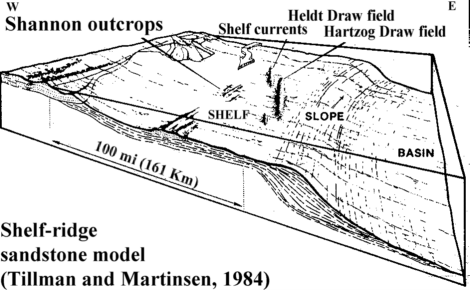
Figure 4. Basin morphology during deposition of shelf sandstone beds in the Powder River Basin (Tillman and Martinsen, 1984 reprinted by permission). The House Creek field is located about 10 miles (16 km) east of and approximately parallel to Hartzog Draw field. Oil in the Hartzog Draw and Heldt Draw fields is produced from the Upper Cretaceous Shannon Sandstone.
Actual proximity of the Sussex "B" sandstone relative to shoreline is unknown. The difficulty with sand-ridge models lies with transporting and reworking sediments this far from shore. This Sussex "B" and other Sussex and Shannon Sandstone mid-shelf sand ridges had the following sources of sand and sediment transport:
One source of sand for the Sussex Member and underlying Shannon Member is erosion of precursor marine and possible nonmarine strata during transgression, with redeposition in shoreface to mid-shelf environments as marine-ridge sandstones.
Deposition of shelf sands may also result from local and regional tectonic activity in the region. Kauffman (1977) believed the eastern platform of the Powder River Basin showed minimal localized tectonic activity, as reflected in a broad uniform pattern of marine sedimentation. Topographic highs on the Cretaceous shelf could have developed as a result of;
An ordered sand-ridge field, such as the Shannon Sandstone in the Hartzog Draw area (figure 4), located about 10 mi (16 km) west of the House Creek field, develops from an initial, low-relief, highly variable topography (Gaynor and Swift, 1988). Tillman and Martinsen (1984), stated that "Detailed subsurface correlations of the Shannon sand ridges throughout the Powder River Basin, using well-developed bentonite markers, show the reservoir facies to "rise and fall" parallel to their elongation, indicating that the ridges were not deposited in layer-cake fashion." Sandstone ridges in the Sussex "B" sandstone rise to the north and to the west. These stratigraphic patterns of development of the higher energy shelf-ridge facies are interpreted to reflect sea-floor topography during their deposition. If basin structural features resulted in topographic highs during deposition of the Sussex "B" and other offshore sandstones, they could have resulted in concentration of sand and (or) sand ridges on the muddy shelf.
Holocene shelf sand ridges on the Texas shelf and the Georges Bank - Nova Scotia - Newfoundland - Labrador shelf system (Slatt, 1984) were examined and compared to sand-ridge deposits from the Cretaceous epicontinental seaway. Ridges in the transgressive Holocene sand sheets are associated with topographically high banks. Sediments here are derived from reworking of underlying substrates with contemporaneous deposition of mud in adjacent low areas. Oceanic currents play a strong role in localizing sand ridges, in grain sorting efficiency, and in areal distribution and stacking patterns of sands and muds.
Lithostratigraphic and biostratigraphic data suggest Sussex Sandstone depositional intervals east of the House Creek field are compressed rather than missing (Gill and Cobban, 1966; Asquith, 1970; Brenner, 1979). This indicates a reduced sediment accumulation rate east of the field and greater rates of compaction for mudstone than sandstone. This also indicates the area of the House Creek field was a paleo-topographic high. Thickness of the "B" sandstone ranges from several feet along and east of the seaward margins of the field to almost 60 ft (18 m) along the western margin; this is a lateral distance of 1 to 1.5 miles. Sediments along the western field margin consist mainly of moderate- to low-depositional energy sandstone and mudstone. This wedge shape also indicates oceanic currents which sculpted the Sussex "B" sandstone were a fractionation mill. Sediments were eroded from the front of the marine ridges and re-deposited landward (westward). This is illustrated by figure 5. This north-south-oriented vertical slice of the Sussex "B" sandstone is located near the northern boundary of the study area. It was mapped using the basal disconformity surface at the datum; the actual shape of the "B" sandstone is probably wedge-shaped with a lower surface that curves downward to the left (landward). This is an oblique slice across the field, the wedge shape is even more pronounced when cut perpendicular to the field axes.
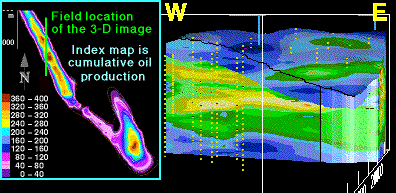
Figure 5. This north-south-oriented vertical slice of the 3-D porosity model (3dns_img.htm) shows upward and westward (landward) increase in sediment thickness, and progressive westward deposition of later sands in the Sussex "B" sandstone (wedgessx.gif). Blue on the 3-D model is primarily mudstone and sandstones containing less than 8 percent porosity, green is mainly fine- to medium-grained sandstones exhibiting 8 to 12 percent porosity, and yellow contours are mainly medium-grained trough-cross-bedded sandstones that contain greater than 12 percent porosity. Respective average porosity of the "B" sandstone and of reservoir intervals are about 8 percent and 12 percent. Slice width and thickness are about 2.5 mi (4 km) and 50 ft (15 m). Vertical exaggeration is 60x. Yellow dots are well sample locations. Index contour map shows cumulative oil production per well; contour interval is 40,000 barrels.
Tectonic influences may have altered sea floor relief and slope of the shelf during deposition of the Sussex "B" sandstone. This would provide sources of sediment through changes in relative sea level and oceanic currents, and influence areas of sediment deposition. Slack (1981) believes the Belle Fourche arch ( fig. 1), and other associated northeast-trending structural lineaments in the northern two-thirds of the Powder River Basin controlled localization of all significant Shannon and Sussex productive sandstones. Sussex and Shannon production is concentrated along the arch in this area of the basin. The axis of the arch crosses the northern quarter of the House Creek field. Location of the arch is based on gravity data; structures are difficult to identify from conventional subsurface structure maps. Uplift and erosion throughout Wyoming prior to deposition of the Teapot Sandstone Member of the Mesaverde Formation (72 Ma) (fig. 2) probably obliterated evidence of additional transgressive and regressive phases of deposition during the latter part of the Late Cretaceous (Gill and Cobban, 1966).
The Belle Fourche arch probably formed from subtle variations in regional structural patterns which are precursors to the Laramide orogeny (Slack, 1981). Subtle uplift along the arch occurred from Lower Cretaceous Muddy through Upper Cretaceous Sussex deposition, a period of about 35 m.y. The Belle Fourche arch was slightly positive during deposition of the Sussex Sandstone (Slack, 1981), and marine ridge deposition over structural highs may have generated topographic highs along the arch.
Other suggestions of greater topographic relief and subtle uplift in the House Creek field area are 1) deposition of the Sussex "B" sandstone began in the southeastern corner of the field and progressed to the north, toward the arch, 2) the thickest section of the Sussex "B" sandstone, and many intervals of Shannon Sandstone, are located near the axis of the arch, 3) in fact, most of the productive Sussex and Shannon intervals are along this trend, and 4) the thin, areally discontinuous Sussex "A" sandstone overlies the "B" sandstone along the western field boundary. The "A" sandstone, located just below the Ardmore bentonite, produces oil from the Triangle U field. This field is located on the axis of the Belle Fourche arch in T. 46 N., R. 75 W.
The House Creek and Porcupine oil fields are delineated by a major marine-ridge system that is composed of complexly interbedded thin-bedded mudstone and sandstone of the Sussex "B" sandstone. The informally named Sussex "B" sandstone is one of as many as 12 separate sandstone bodies that are located at different vertical and lateral positions within the Sussex Sandstone Member (Anderman, 1976; Crews and others, 1976). Core and outcrop studies were combined with well log and analytical data, plus published research, to assign depositional environments for the Sussex "B" sandstone. Sandstones and mudstones were mapped across the study area to evaluate scales, types, and timing of reservoir heterogeneities, including lateral and vertical continuity and extent of bedforms, interbedding of reservoir and non-reservoir (seal) units, and depositional changes across the field related to variations in facies thickness, depth, and distribution of permeability boundaries.
The "B" sandstone was deposited in a probable mid-shelf position in the Cretaceous Epicontinental seaway. Four separate sand ridges comprise the "B" sandstone in the field area. Transgression during deposition created westward (landward) backstepping of later deposited sand ridges. Sand-ridge development began in the southeastern corner of the field and progressed to the northwest, based on stacking patterns and correlation of sand-ridges and contained mudstone-sandstone beds, Sussex "B" upper and basal disconformities, and the overlying Ardmore bentonite.
Figure 6 shows thickness (in feet) of the Sussex "B" interval between the upper and basal disconformities. Landward stacking of sandstones is evident from the westward increase in sediment thickness. When mapped using either the overlying Ardmore bentonite or the bounding disconformities as datums, the Sussex "B" sandstone is wedge-shaped. The Cody Shale interval between the bentonite and "B" sandstone also is wedge-shaped; however, the open end is toward the ocean. The bentonite is a time-equivalent layer of volcanic ash that was chemically altered to clays during burial. While this trend is clear within the House Creek and Porcupine fields, each reservoir must be evaluated separately for stacking patterns. The top of the Sussex "B" reservoir sandstone in the study area is located approximately 20 to 60 ft (6 to 18 m) below the Ardmore bentonite, based on correlation of well-logs and core studies (Higley, 1994). Variation in thickness of the Ardmore-Sussex "B" interval results from 1) influence of depositional environment, depositional energy, and sediment supply on localization of sediments, 2) greater rates of compaction for shale-rich versus sandstone beds, and 3) local or basinal structural movement and its association with rates of deposition.
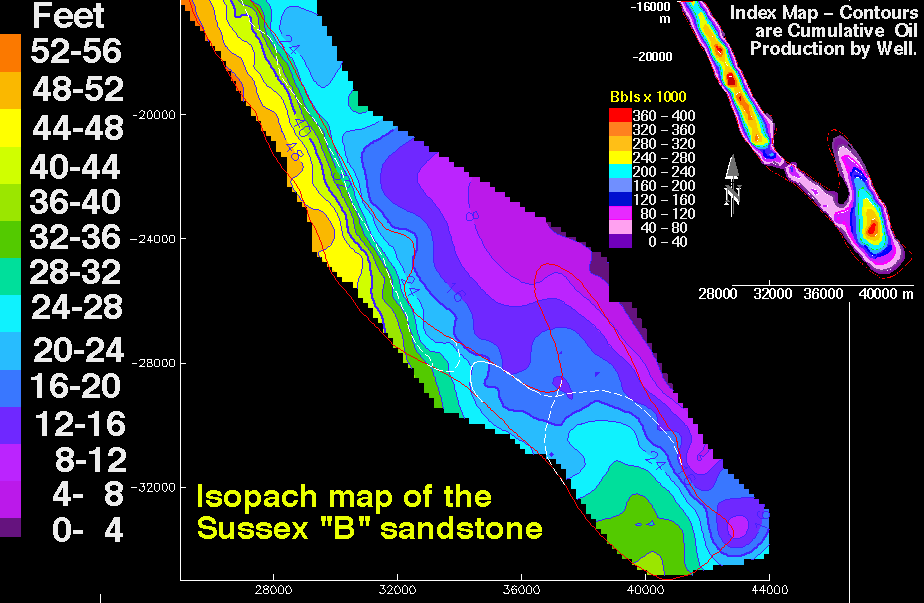
Figure 6. Isopach map of the Sussex "B" sandstone showing thickness in feet of the interval between bounding disconformities; contour interval is 4 ft (1.2 m). Map scales are meters. The small index contour map is cumulative oil production; contour interval is 40,000 barrels. The thin red line outlines the boundary of the House Creek field. Thin white lines in the southern half of the field are limits of sand-ridge 1 and overlying sand-ridge 2. The large-scale 64 KB image is named ssxiso.gif .
Based on thin-section, core, outcrop, well-log, and production data, the highest quality Sussex "B" reservoir intervals are fine- to medium-grained, glauconitic, thinly bedded, trough- and planar cross-bedded sandstones. These facies contain greater reserves, porosity, and permeability and exhibit fewer laterally continuous permeability barriers and baffles than the fine-grained massive, ripple-laminated, and wavy-bedded sandstones that also produce oil.
Transport of shoreface and shelf sediments across this seaway resulted from complex interaction of oscillatory and unidirectional currents, created primarily by intermittent along-shelf, southerly storm flows (Gaynor, 1991). Sandstone ridges are aligned obliquely to the prevailing transport direction, as is shown on figure 7. Figure 8 is an idealized vertical slice across three stacked sand ridges. Due to the great spatial scales (width and length) of Shannon and Sussex sand ridges, the ridges must be obliquely oriented with respect to fluid flows (Gaynor and Swift, 1988), as opposed to the flows being perpendicular to ridge boundaries. Cross-ridge flow accelerates on the up-current flank of the ridge; consequently, it is the up-current flank that undergoes erosion (Gaynor and Swift, 1988). This cross-ridge acceleration and down-ridge frictional deceleration results in a rotation of flow over the ridge that causes erosion of the up-current flank, aggradation of the crest of the ridge, and growth of the sand ridge (Gaynor and Swift, 1988).
This model also explains thinning of the Sussex "B" sand ridges proximal to the open ocean, aggradation of the reservoir intervals along the crests of the sand ridges, and decrease in grain size, sorting efficiency, and associated porosity and permeability of sandstones west of axes of individual sand ridges and for the entire "B" sandstone. Directions of maximum fluid flow for this sand-ridge model are parallel to the axes of each trough-cross-bedded bedform and also parallel to field axes. These flow directions result from depositional patterns of the trough-cross-bedded sandstones, and concentration along field axes of the thickest and most porous and permeable units.
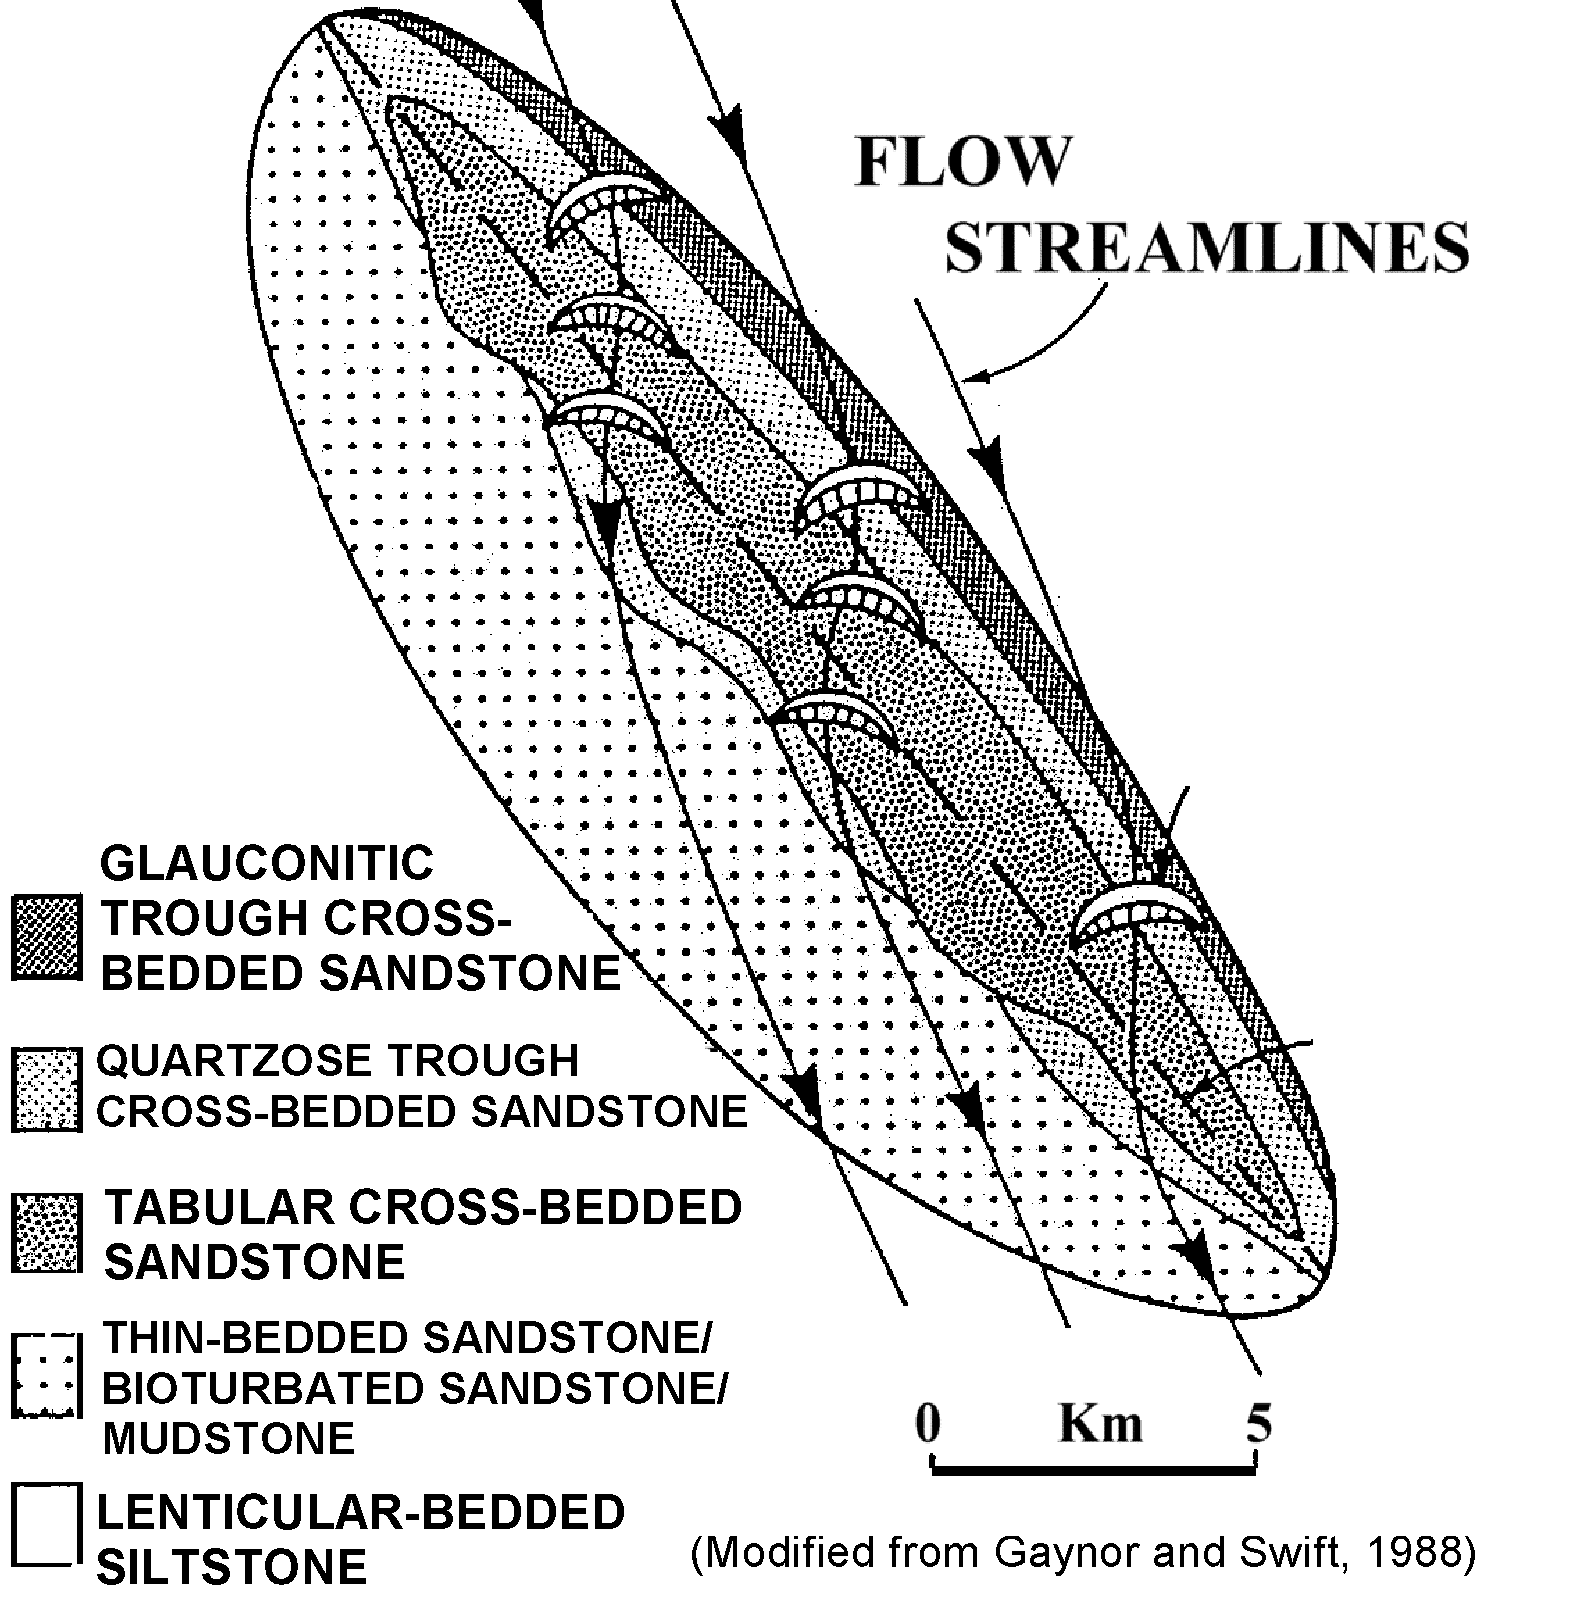
Figure 7. Plan view of lithofacies distribution on a sand ridge, and generalized flow streamlines (srplanvs.gif). Flow streamline arrows are the directions of currents over the sand ridge. Scale is approximate. Click sand Ridge - plan view (modified from Gaynor and Swift, 1988, reprinted by permission) to see the detailed (srplanvw.gif) image (208 KB).
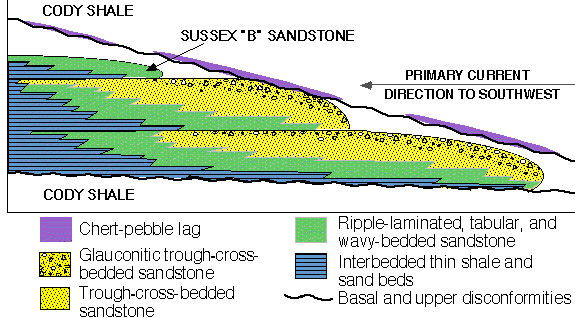
Figure 8. Idealized east-west-oriented vertical section across three stacked sand ridges (ssxflowu.gif). General facies types are listed. No vertical or horizontal scales.
Figure 8 shows upward and seaward increase in depositional energy (yellow dotted and green areas), which is tied to increases in porosity and permeability. The basal disconformity (wavy line) is the horizontal datum for the 3-D porosity and permeability models. The wedge shape of the Sussex "B" interval results from reworking by currents of seaward margins of sand ridges, and landward redeposition of sediment. The blue-lined areas are basal and landward low-depositional-energy facies; these exhibit low porosity, permeability, and petroleum production.
The disconformity at the top of the Sussex "B" sandstone is generally marked by a thin chert-pebble sandstone (figure 9A). Shading variation of the quartz (figure 9B) results from fracturing of the grain in this cross-nicols photomicrograph view (light is transmitted differently due to rotation of the crystal axes). Quartz grains that were incorporated from underlying sand-ridge sediments commonly exhibit early stages of diagenesis within marine environments, primarily chamosite overgrowths under the quartz overgrowths. Grain-to-grain contacts within this facies are mainly point with lesser long-straight contacts.
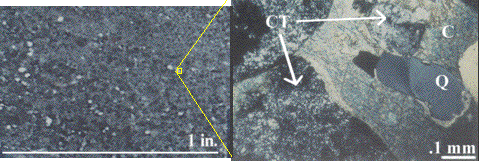
Figure 9. A. Chert-pebble-lag core photograph, and B. crossed-nicols photomicrograph of a chert-pebble lag, No. 14-9 Federal well. Chert pebble lag core links the detailed (576 KB) ctlagc.gif core image. The bimodal grain distribution (mix of large and small grains) is visible on both images. Chert pebble thin section shows the large-scale (736 KB) ctlagts.gif photomicrograph image. Labels are Q quartz, CT chert, and C calcite. Quartz grains incorporated from underlying central-ridge facies sandstones commonly "float" in a matrix of (blue stained) ferroan carbonate cement.
Figures 10, 11, and 12 are thin-section, outcrop, and core photographs of trough-cross-bedded sandstones. These sandstones are the primary reservoir facies; facies are further divided based on relative decrease in depositional energy into central ridge, high-energy ridge margin, and low-energy-ridge margin (Tillman and others, 1985).
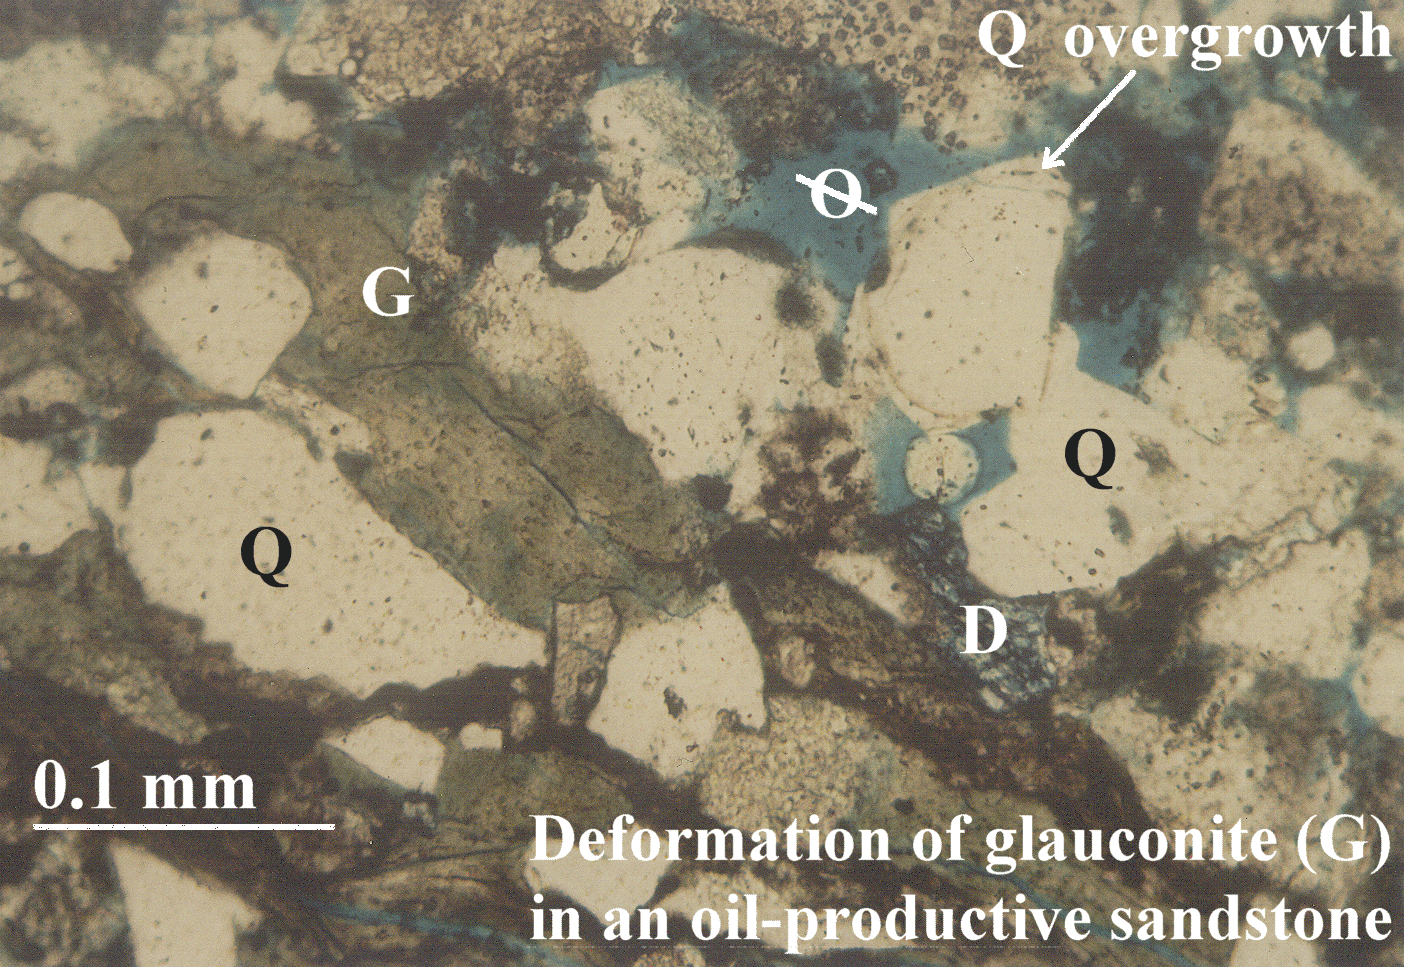
Figure 10. This transmitted-light thin-section image is from 8,014 ft (2,443 m) depth in the Empire-Federal "C" oil well. Deformation of glauconite (G) pellets and other soft sediments in trough-cross-bedded sandstones form microscopic and macroscopic permeability baffles to fluid flow. Note also that quartz (Q) grains surrounded by glauconite do not exhibit the later diagenetic quartz cementation. Mudstone (brown) and glauconite (green) are concentrated along the lower depositional energy laminae of trough-cross-bedded sandstones. Late-diagenetic dolomite cement is stained dark blue (D). Medium-blue epoxy fills pore spaces (ellipse with a line through it). Glauconite is 1.4 MB thin section (glauts.gif) image.

Figure 11. Photograph of an outcrop of Sussex Sandstone Member low-energy-ridge-margin (LRM) sandstone; outcrop is located in NW. corner of sec. 7, T. 40 N., R. 78 W., Natrona Co., Wyoming. LRM thickness is about 1 ft (0.5 m). Greater dispersal of glauconite, clays, and mud in lower depositional energy facies decreases porosity and permeability. This thin trough-cross-bedded sandstone, and the bounding burrowed and bioturbated sandstone/mudstone facies, contain mudstone and glauconite laminae and beds that are preferentially eroded, causing greater relief. Blue and purple lines in this small-scale image separate bedding planes. Trough-cross-bedded sandstone 1 MB (ssxcrp2.gif) outcrop image.
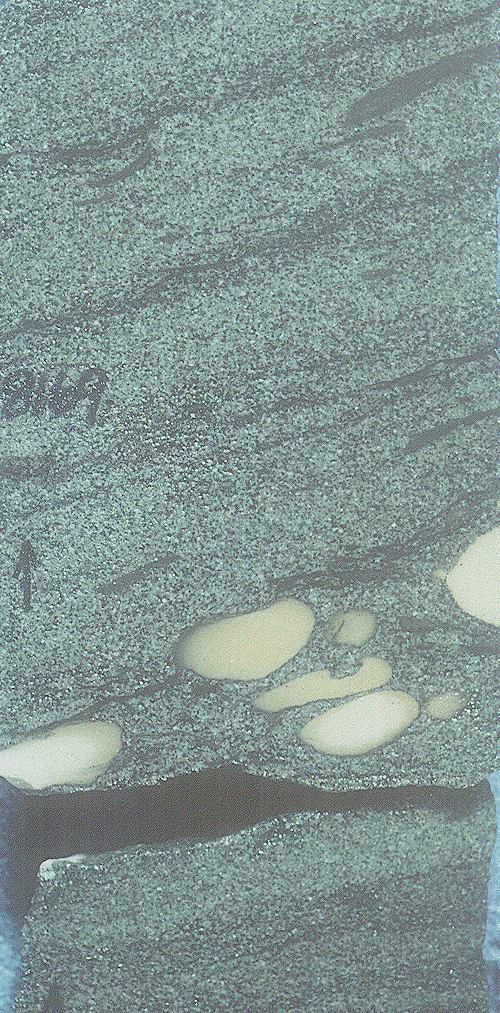
Figure 12. Core photograph of trough-cross-bedded medium-grained sandstone from 8,169-ft depth in the No. 1 Mandel-Federal well. Depths are in feet. Arrow points up. Siderite (S) clasts are concentrated on the bedding planes. Trough-cross-bedded sandstone 512 KB (trs8169.gif) core image.
Figures 13 and 14 show inter-ridge depositional environments that consist mainly of burrowed and intact mudstone laminae, and interbedding of mudstone with fine-grained sandstone. Abundant permeability barriers result in low levels of petroleum production. These facies, concentrated toward the base of sand ridges, compartmentalize the reservoir intervals.
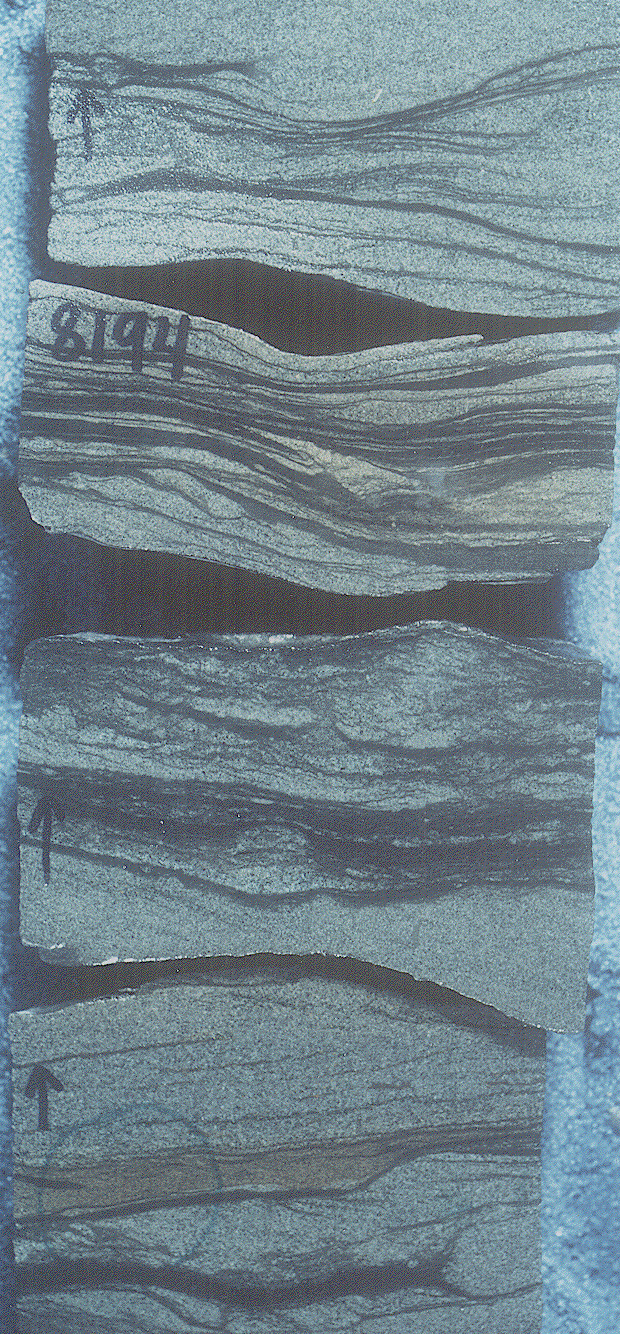
Figure 13. Core photograph of wavy-bedded fine-grained sandstone from 8,194-ft depth in the No. 1 Mandel-Federal well. Dark lines are mudstone laminae that segregate the thin, discontinuous sandstone beds. A siderite drape (arrow) is located on a ripple reactivation surface. Core width is 3.5 inches (9 cm). Arrows within core point up-hole. Wavy-bedded sandstone - 688 KB core (wss8194.gif) image.
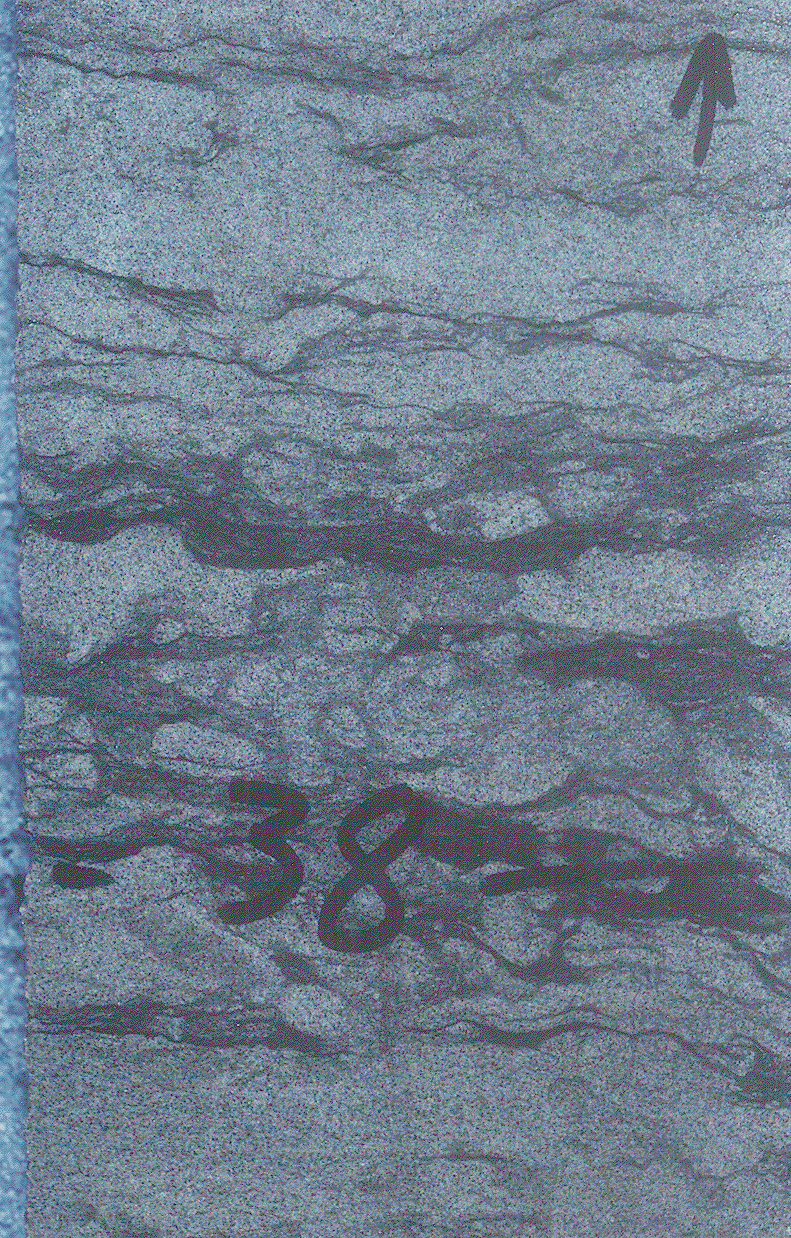
Figure 14. Core photograph of a bioturbated very fine grained sandstone from 8,038-ft depth in the No. 1 Empire Federal well. This facies exhibits very low porosity and low permeability and is a reservoir seal. Black arrow points to a mudstone lamina. Gold arrow shows a burrow trace. Core width is 2 inches. Bioturbated siltstone - 800 KB core (bss8038.gif) image.
Heterogeneity (essentially nonuniformity) in sandstone reservoirs is controlled by the following factors; (modified from Weber, 1986; Schenk, 1988, 1992):
Reservoir quality in the Sussex "B" sandstone is a function of sedimentologic and petrologic heterogeneity. This and the following section discuss the relative influences of the above factors on porosity and permeability distribution and development. Faulting, aside from minor fracturing as viewed in core, is undocumented for the Sussex "B" sandstone.
Initial porosity in the Sussex "B" sandstone in the basin was probably 35-40 percent by volume for trough- and planar-cross-bedded facies. Because of poor sorting (more clay and mud) finer grained sandstones exhibit lower initial porosity and permeability. The porosity range is based on examination of 54 thin sections and is tied to analogs. Pryor (1973) analyzed distribution of porosity and permeability in unconsolidated beach sands in the Gulf Coast; he found that initial porosity of 39 to 56 percent decreased rapidly with burial. Wilson and Sibley (1978) determined that the Cambrian Galesville Sandstone, of Wisconsin, exhibited initial porosity of 45 to 50 percent; this decreased during burial to about 33 percent. This decrease resulted mainly from rearrangement of grains during early burial. Further reduction to 24 to 33 percent was due to later quartz pressure solution (dissolution of quartz grains and associated closer packing of grains), and emplacement in pores of dissolved quartz, kaolinite (clay), iron hydroxide, and adularia (a feldspar mineral).
Sussex "B" sandstone porosity and permeability range up to about 21 volume percent and 200 millidarcies (mD), respectively, for core tests from 15 widely scattered boreholes. Geometric mean of permeability for this 791 core-plug data set is 0.62 mD.
Core plus well-log average porosity is 8.8 percent for the entire interval of the Sussex "B" sandstone, and about 13 percent for reservoir intervals. These 2,600 core plus well-log points have median porosity of 8.4 percent. Porosity values were calculated from bulk density well-log traces for approximately 100 wells; values were recalibrated to a specific grain density of 2.68 g/cm3 (Higley, 1994). Sonic log traces were used for porosity calculations for several wells. These porosity/permeability data files are located in the data_set directory.
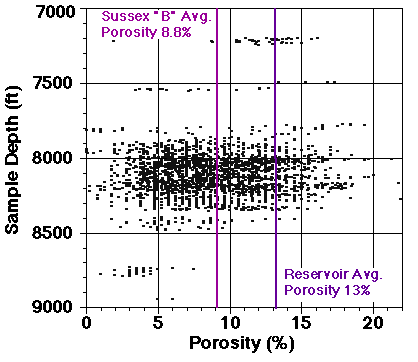
Figure 15. Graph of core and well-log porosity versus depth for 2,600 Sussex Sandstone Member points. The average 8.8 percent porosity of the Sussex "B" sandstone and of reservoir intervals (13 percent) is also plotted. Scatter in data is considerable.
Published reports of reservoir permeability and porosity in the House Creek field vary; Bauder (1981) listed a geometric average permeability of 6.9 mD for the Sussex "B" sandstone. Sabel (1985) reported mean porosity and permeability of 13 percent and 15 mD, respectively, for reservoir sandstones in the House Creek field.
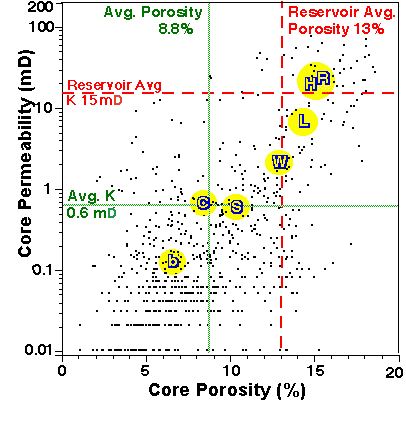
Figure 16. Volume percent porosity and permeability for 791 core plug samples for 30 wells, Sussex Sandstone Member (Higley, 1994). Greater porosity correlates with permeability increase. Scatter in data is considerable. Dotted green lines are geometric averages for this data of 8.8 percent porosity and 0.62 mD permeability. Dashed red lines represent average porosity and permeability of 13 percent and 15 mD for reservoir intervals of the "B" sandstone. Yellow circles surround average porosity and permeability values for sand-ridge facies determined from core examination of 8 wells. Sandstone facies are: chert-pebble lag, C; central-ridge, R; high-energy ridge-margin, H; low-energy ridge-margin, L; wavy-bedded, W; inter-ridge sandstone, S; and burrowed inter-ridge sandstone and mudstone, b.
Sussex "B" sandstone facies and mineralogy vary greatly at megascopic (field scale), and even more so at macroscopic (well and rock), and microscopic (thin-section) scales. The most porous, permeable strata are the moderate- to high-depositional energy trough-cross-bedded medium-grained sandstones; these are primarily concentrated towards the tops of sand ridges. Increase in porosity and permeability is tied to increase in depositional energy. This results from:
Amounts of calcite cements in 17 trough-cross-bedded (H, R, and L in the above porosity/permeability figure) sandstone samples range from 2.3 to 34 percent, and average 8.8 percent. Conversely, 7 samples of inter-ridge burrowed mudstone to fine-grained sandstone (b, S, W) only averaged 4.2 percent calcite cement. Resulting average minus-cement porosity is calculated at only 18 percent. Extensive loss of porosity and permeability due to compaction and prior to calcite cementation, is indicated by the low percentage of calcite cement and large volume of mudstone and other soft sediments (about 27 percent).
Percent volumes of calcite cement and intergranular porosity for 54 thin sections are shown on figure 17; microporosity within clays and grains is not recorded. Thirteen percent porosity is average for reservoir intervals; 8.8 percent is average for the entire Sussex "B" sandstone, based on core porosity/permeability of 791 points. Intervals of greatest porosity generally contain less than 3 percent calcite cement; calcite cement in this mainly trough-cross-bedded-sandstone facies is commonly spotty in thin sections, with evidence of extensive dissolution of cements.
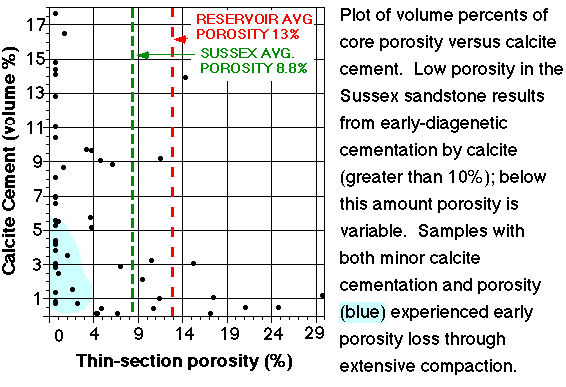
Figure 17. Plot showing volume percentages of core porosity and calcite cement for the Sussex "B" sandstone. Low-porosity sandstones associated with greater than 10 percent calcite cement commonly contain no effective porosity. This occurs mainly during the earliest stage of calcite cementation. The region with low porosity and minimal calcite cementation results from early diagenetic compaction. These samples are primarily burrowed and bioturbated sandstone and mudstone.
Flow units are reservoir zones that exhibit similar fluid flow, porosity/permeability, reservoir potential, and production characteristics. Ebanks (1987) defined flow units as "volume of rock subdivided according to geological and petrophysical properties that influence the flow of fluids through it." Flow unit characteristics of the various Sussex "B" sandstone facies are assigned and detailed in Higley (1994); they are included below to show porosity/permeability/facies types for each reservoir and non-reservoir group of rock types.
Sussex "B" sandstone fluid flow potential is rated E(xcellent), G(ood), F(air), and P(oor). These categories are general indicators of the reservoir favorability. Divisions are based on porosity and permeability characteristics of central ridge and other facies, probable directions of maximum fluid flow in the field, vertical and lateral continuity of reservoir and non-reservoir flow units (based on core, outcrop, and geophysical well-log examination), presence and number of permeability barriers and baffles, and petroleum production characteristics of wells. Table 3 lists six flow units; these consist of three reservoir (E, G, F) and three low-permeability, non-reservoir (P5, P6, P7) units. Flow unit E exhibits excellent reservoir and fluid flow properties; G contains good reservoir properties, F exhibits marginal to fair reservoir properties, and the non-reservoir P units (P5, P6, P7) are permeability baffles and barriers bounding and interbedded with E, G, and F flow units. Determination of thickness and distribution of flow units across the field was based on examination of core from 20 wells, well-log data for more than 120 bore holes, and on outcrop studies.
FLOW-UNIT RATING, PERMEABILITY (mD), POROSITY (PERCENT), AND PETROLOGIC CHARACTERISTICS
An example of a Good to Excellent flow unit is the trough-cross-bedded medium-grained sandstone shown in figure 18 (bedding planes are outlined in blue and purple in this snncrp1s.gif image). This is a non-productive probable lower-shoreface (near the beach) sandstone of the Shannon Sandstone Member. Even though this is a very porous sandstone, porosity, permeability, and fluid flow are all decreased by the thin sandstone beds (bounded by purple) that are highly cemented by quartz. Flow is influenced by orientations of trough-cross-bedding planes. Primary direction of maximum fluid flow is perpendicular to this image, and along the bedding planes of the individual cross-bedding laminae. Note also (for future reference) that individual beds have general lensate and tabular forms. The thin, highly cemented, low-permeability sandstone layers are massive in appearance, compared to the porous cross-bedded intervals that erode more readily.
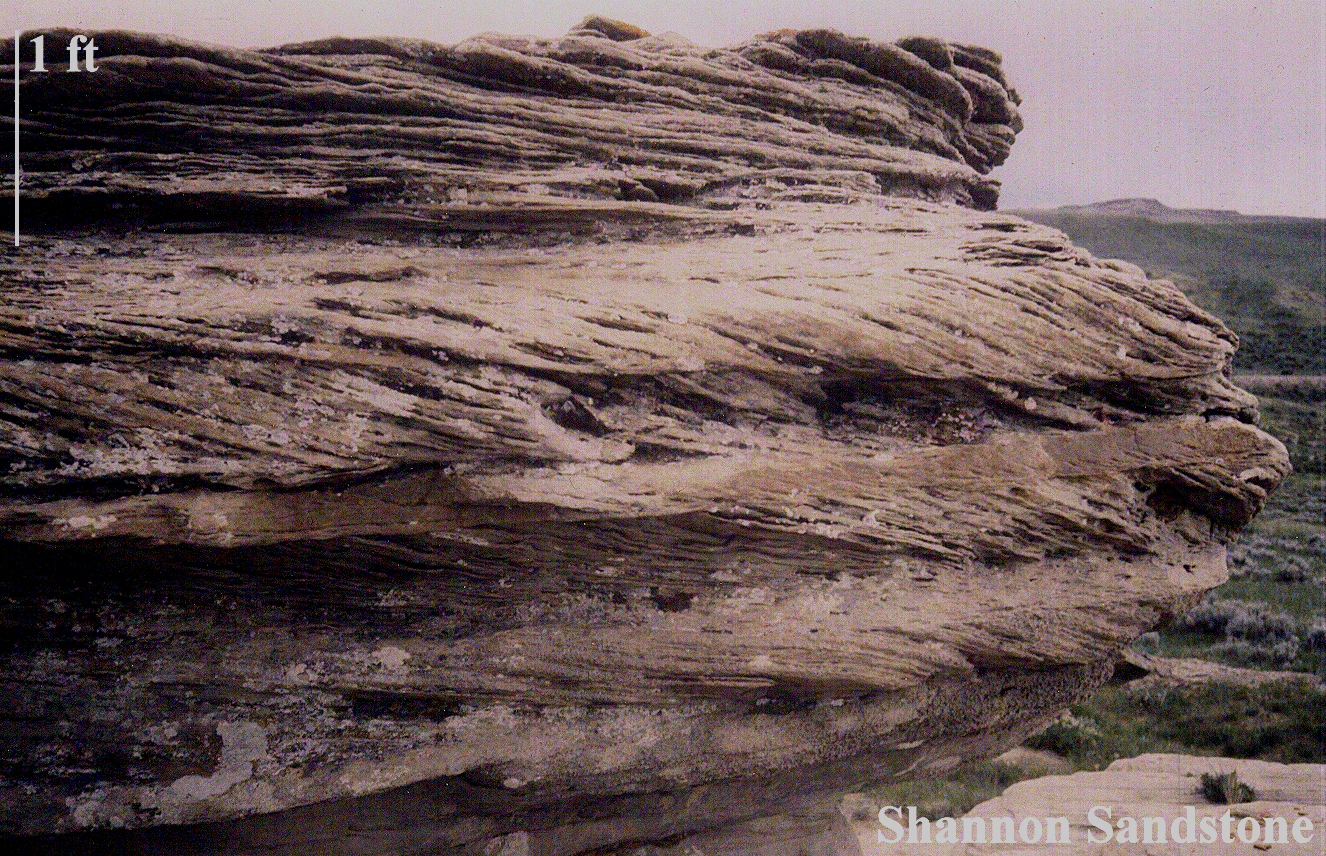
Figure 18. This outcrop of a Shannon Sandstone Member trough-cross-bedded sandstone is located at Shepperson Ranch, west of Midwest and Edgerton, Wyoming (figure 1). The thin, low-porosity, quartz-cemented beds are outlined in purple in this small-scale view. Porous and permeable intervals are bounded by a blue line. The 1.2 MB image is named snncrp1.gif .
Sussex "B" sandstone heterogeneity in the House Creek field results mainly from the following factors. Many of these factors are discussed in other sections, for example, the interbedding characteristics at macroscopic scales are detailed in the Depositional Model section.
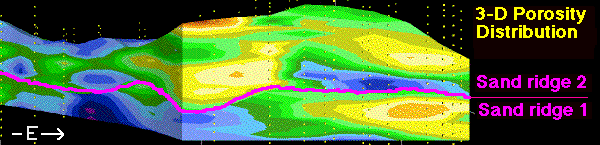
Figure 19. Illustrated are the lensate form of the reservoir, and of individual reservoir sandstones, in this vertical east-west slice showing 3-D distribution of porosity across sand ridge 1 and overlying sand ridge 2. Yellow dots are locations of well-log porosity measurements. Blue and purple areas are primarily non-reservoir intervals. These are basal and landward low-depositional-energy sandstones and mudstones of individual sand ridges (porosity ranges up to 8 percent). Green areas are reservoir-grade porosity of 8 to 12 percent. The breakover point between green and yellow is 12 percent; this approximates the 13 percent average porosity of reservoir intervals; yellow through red (20 percent porosity) are the best quality reservoir intervals. These are largely the medium-grained trough-cross-bedded sandstones, although even here there is considerable interbedding of low- through high-depositional-energy facies. Width of the reservoir at this slice is about 2 mi (4 km). Vertical exaggeration is 60x. This is 3dewlens.gif, slice 10 of the 3-D distribution of porosity model, as shown in the ewporosv.MOV movie.
The reservoir sandstone intervals (green, yellow, orange, and red) are essentially lens shaped. These are composed of many thin, laterally discontinuous, interbedded sandstone and mudstone beds. The sandstone intervals pinch out along the eastern (seaward) margin and grade into non-reservoir (blue) and lower quality reservoir facies along the western field boundary. Datum is the basal disconformity (erosional surface). Using the overlying Ardmore bentonite as the datum, the field actually has a wedge shaped base and top. The same bulge (lens) is visible along the field axis, and reservoir intervals pinch-out to the east. A thin interval of high porosity (red) capping the field in some images is a remnant of the gridding process; a thin, areally discontinuous porous zone is located in several geophysical well logs at the top of the "B" sandstone.
This 3-D distribution of porosity slice (figure 19) reveals;
Core porosity represents point sources, whereas well-log porosity is commonly smoothed over intervals of a few feet. Illustrating the high variability in porosity and permeability over short horizontal and vertical distances requires 3-D images of core data, rather than porosity and permeability calculated from geophysical well logs (data sources and analytical procedures are detailed in the Technical information on data sources section of the Table of Contents).
Figure 20. East-west oriented vertical slices of porosity (left, percent) and permeability (right, mD). This image (porpermv.gif) shows the highly variable porosity (left) and permeability (right) using core data. Porosity values/colors are reservoir grade (green through red) of 8 through 21 percent, and below-reservoir-grade low-porosity (blue) of less than 8 percent. Permeability ranges are: purple and blue, up to 5 mD; green, 5 to 16 mD; and yellow through red are greater than 16 mD. Average permeability of Sussex "B" reservoir sandstones is 15 mD. The close-spaced 3-D grid essentially treats each well as a separate set of points for the purpose of showing the variation in porosity and permeability. The various diamond shapes and streaks of low through high porosity and permeability illustrate the interbedding of thin beds of reservoir- and non-reservoir-grade sandstone and mudstone. These diagrams include the eastward and upward increases in porosity and permeability, and stacking of sand ridges shown in previous images. This slice is located in the northwestern half of the field. Yellow dots are (left) core and well-log and (right) core sample locations. Slices are 1.8 mi (2.8 km) wide and 50 ft (15 m) high. Vertical exaggeration is 30x. Respective names of the east-west porosity and permeability slide-image files are 3dew_img.htm and 3dvk_img.htm .
Variable distribution of porous zones is illustrated in figure 21 A. and B. Shown are the respective 3-D distribution and volumes of porosity for 8 to 21 percent, and 12 to 21 percent porosity. These views were chosen along the eastern margin of the field because deposition of the Sussex "B" sandstone began here, and upward and landward (westward) backstepping of later-deposited sand ridges is better displayed with this view than for other orientations. Average porosity of the Sussex "B" sandstone is about 8.8 percent; average porosity of reservoir intervals is about 13 percent. 3-D distribution of intervals of porosity are explained and illustrated in the text (volporf.mov) sections of the table of contents.
A. 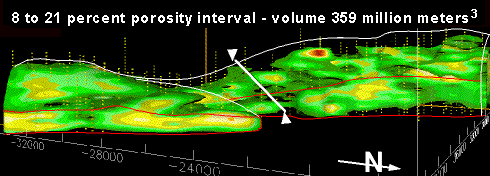
B. 
Figure 21. A. This (por8vol.gif) 3-D view of 8 to 21 percent porosity exhibits a total volume of 358.6 million cubic meters. This is about 70 percent of the total volume of 525.5 million cubic meters of the Sussex "B" sandstone within the field boundaries. The 64 KB full-size image is named eside10f.gif . B. This (por12vol.gif) 3-D image of 12 to 21 percent porosity has a total volume of 115.9 million cubic meters, which comprises less than 25 percent of the total volume of the "B" sandstone in the field. In comparison, the 13 to 21 percent porosity range is about 62.2 million cubic meters; this is about 12 percent of the field volume. The 64 KB full-size image is named eside10j.gif . Green on the figures is 8 to 12 percent porosity. Yellow through red are 12 to 21 percent porosity. Blue arrow marks the boundary between sand ridge 1 and 2. The thin white line marks the upper disconformity surface of the "B" sandstone, except for the seaward margin of the House Creek field, which is outlined in red. The white arrows and line separate the northwestern and southeastern ridge systems; the gap in reservoir-grade porosity units is apparent. X and Y scales are shown in meters around the base of the block. Maximum thickness of the "B" sandstone is about 60 ft (18 m). North arrow is included. Vertical exaggeration is 80x.
Macroscopic and Microscopic (Well and Sample) Scales
Processes of porosity and permeability destruction from pervasive early cementation by calcite and (or) quartz, precipitation of clays, or by compaction are shown in figure 22 (cmts4sm.gif).
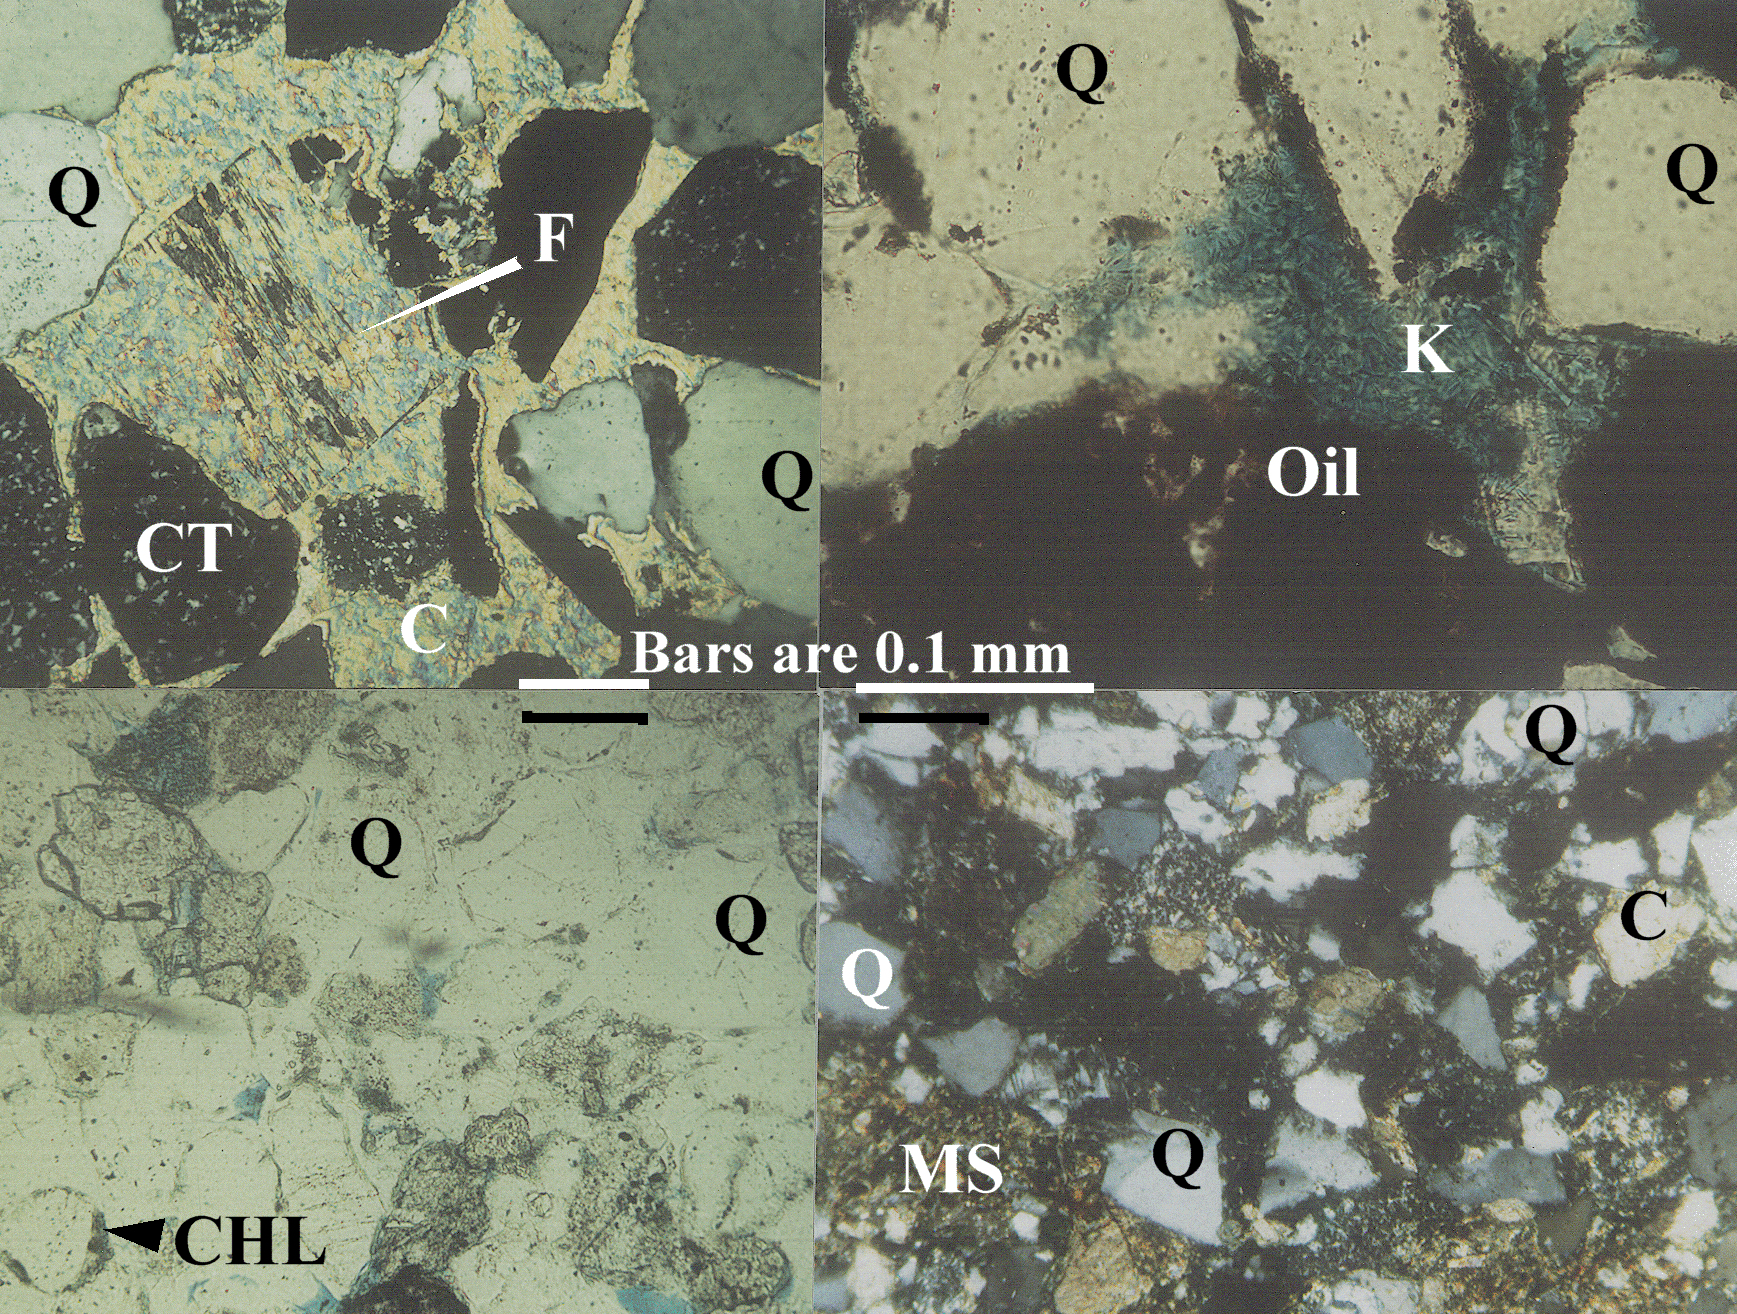
Figure 22. Thin-section photomicrographs of four samples of the Sussex "B" sandstone. Q is quartz, CT shows the chert grains, K is kaolinite, C is calcite, F shows feldspar grain (gray in the crossed-nicols view), MS are mudstone pore-fill and clasts, Oil coats grains and fills pores. Blue epoxy fills pore spaces. cmts4.gif is the full large-scale 2.4 MB image. Clockwise from upper left, images show;
The 3-D computer model images, including figures 21 and 22, show reservoir heterogeneity at megascopic (field) and macroscopic (well and rock) scales. Macroscopic heterogeneity includes stacking of sand ridges, lateral and vertical variation in porosity and permeability, upward and seaward increase in these properties, the lensate and tabular shapes of sandstone beds, and interbedding of high- and low-depositional energy facies. Microscopic heterogeneity, as shown by thin-section and SEM photomicrographs, results mainly from highly variable amounts and distributions of cements and authigenic and detrital clays; this porosity and permeability signature is highly facies related.
Porosity in the Sussex "B" sandstone is mainly primary intergranular (pore volumes remaining from the time of deposition; intergranular means located between the grains). Secondary porosity results from corroded and dissolved feldspar and other lithic grains, which enhances porosity and permeability. Microporosity is present within pore-filling clays, largely kaolinite, and within some corroded chert and other grains. Microporosity is not effective porosity because the small pores are poorly connected. Intergranular plus intragranular porosity in thin sections is as much as 17.5 percent. Average porosity for all thin sections is 5.2 percent; 3.4 percent of this is primary intergranular and as much as 1.9 percent is secondary and intragranular porosity. Average thin-section porosity values for Sussex "B" facies are listed in table 2; this is also located in the ssx_txt directory as the Ssxtable2.txt file. Format is tab-delimited, file is saved as an Microsoft Word text document. Tables located within the HTML documents are ASCII file formats.
Thin-section porosity values are lower than core and average reservoir porosity for two main reasons. First, microporosity is not included in thin-section estimates but is measured during core analysis. The amount of microporosity may be considerable since clays comprise an average 12 percent by volume of the Sussex "B;" clays are the primary permeability barrier at a microscopic scale. The percentage of microporosity should decrease up-section because the amounts of suspended-load sediment and most authigenic and detrital clays decreases upward. Second, three-dimensional effects of thin sections influence point-count results. These 3-D effects include Sussex "B" grain-size sorting and distribution (which are rarely homogenous in sandstones), presence of horizontal laminae and drapes of glauconite and mudstone, orientation of grains and clasts, and other factors that influence heterogeneity.
Sussex "B" sandstone primary and secondary porosity, and microporosity are shown on the following thin-section photomicrograph and SEM images. Pore spaces in all photomicrographs are filled with blue epoxy. Ferroan carbonates are stained blue (ferroan dolomite has dark blue crystals). Unless otherwise indicated, photomicrographs are with transmitted light. Scale bars on most images are 0.1 mm. Porosity in the thin section is partially decreased by early diagenetic cementation of quartz grains. The original rounded quartz grains are outlined by green-colored chlorite crystals. Early diagenetic cementation preserves porosity and permeability in the Sussex "B" sandstone by supporting the grain framework and decreasing porosity loss through compaction.
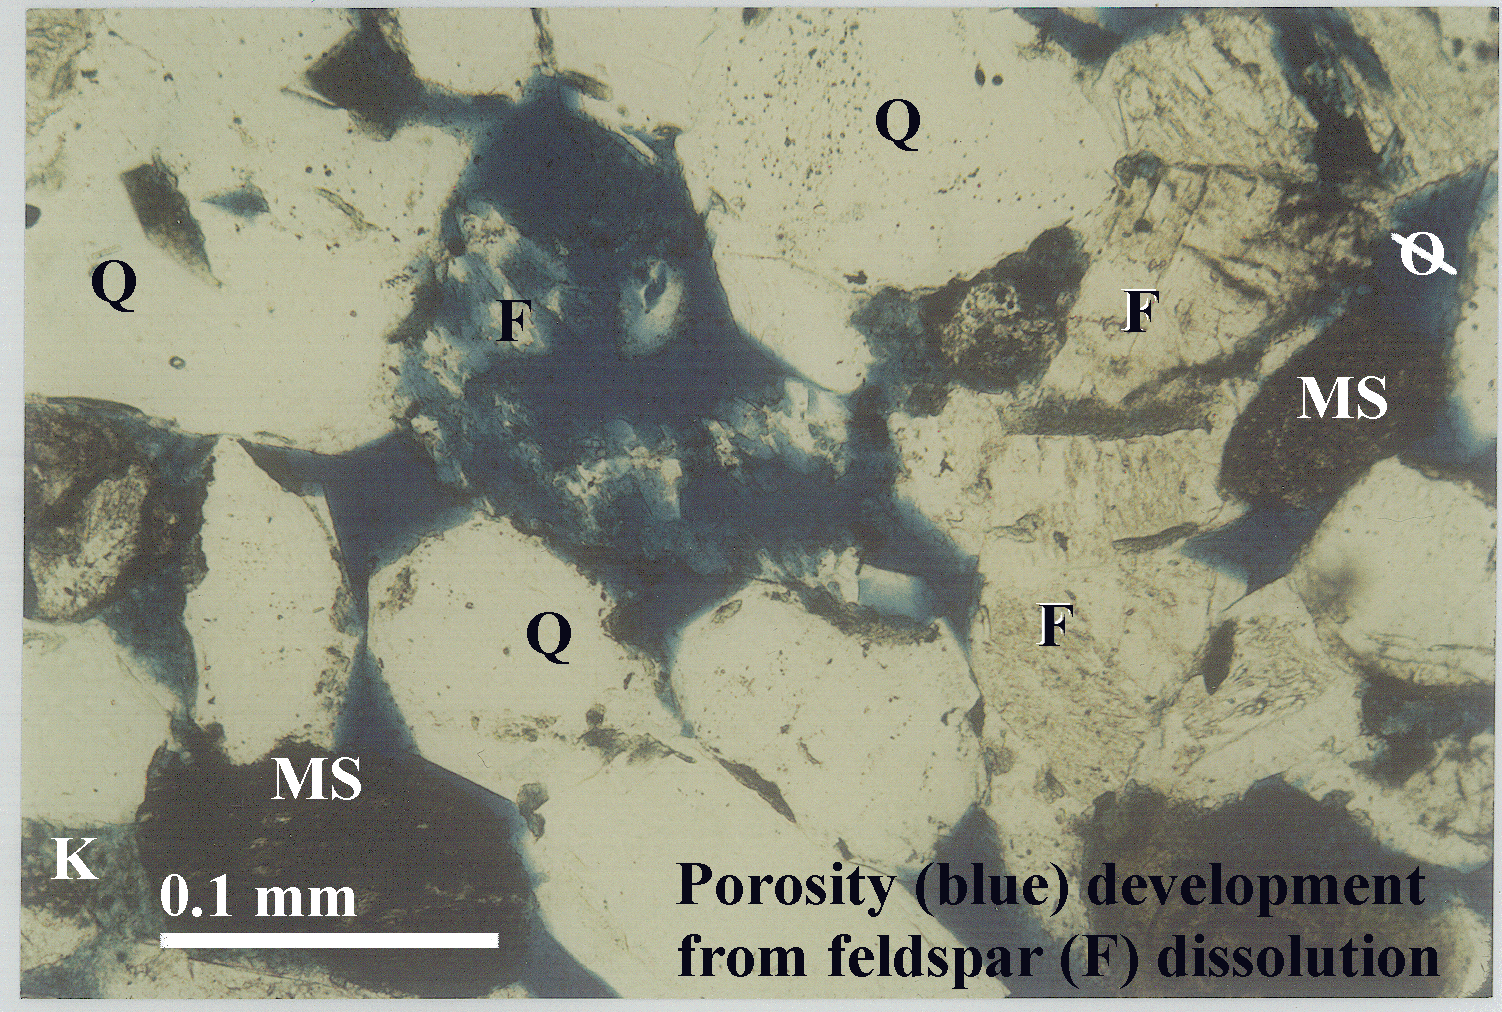
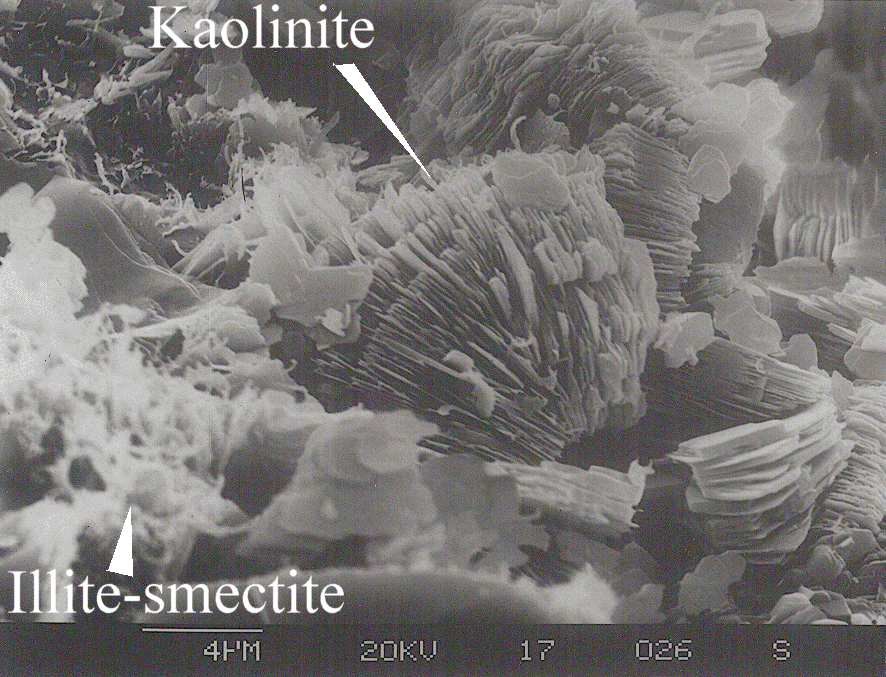
Figure 23. A. Thin-section photomicrograph from 8,012 ft (2,442 m) depth, No. 1 Empire Federal "C" well (fdissols.gif). Dissolution of the large feldspar (F) grain, located near the center of the image, results in secondary porosity. The crystal structure and outline of the feldspar grain is still apparent. Primary (depositional) porosity borders this and other grains. Quartz grains are labeled Q. Microporosity results primarily from breakdown of feldspar into kaolinite (K on large-scale view) and other clay minerals; this causes a mottled appearance of the blue epoxy that fills pore spaces. MS is a mudstone clast. Scale bar is 0.1 mm. The full-scale 1.5 MB thin-section photomicrograph of feldspar dissolution is fdissol.gif. B. Scanning electron microscope (SEM) image of kaolinite shows partings between booklets and minor amounts of "wispy" illite-smectite clay from the No. 1-23 House Creek Federal well (semkaosm.gif). Scale bar, below the illite-smectite label, is 4 micrometers. The 656 KB SEM full-scale image of kaolinite booklets is semkao.gif.
The Sussex "B" sandstone exhibits a complex diagenetic history that strongly influenced porosity and permeability preservation, loss, and enhancement. These factors in turn affect emplacement, trapping, and production of petroleum. The Sussex "B" sandstone is a litharenite to feldspathic litharenite, based on the classification of Folk (1970). The early, middle, and late diagenetic stages are shown in the following figure 24. High initial rates of compaction occur mainly in muds, and in sands that were not lithified, or supported, by early quartz and (or) calcite cementation. Rates of compaction decrease with time. The dashed lines are time periods of dissolution of grains and cements, which develops secondary porosity and permeability. Diagenetic stages were derived from examining the following; 1) cores of 10 wells, 2) 54 thin sections (including cathodoluminescent thin sections), 3) numerous SEM images, and 4) X-ray fluorescence (XRF) and diffraction (XRD) charts.
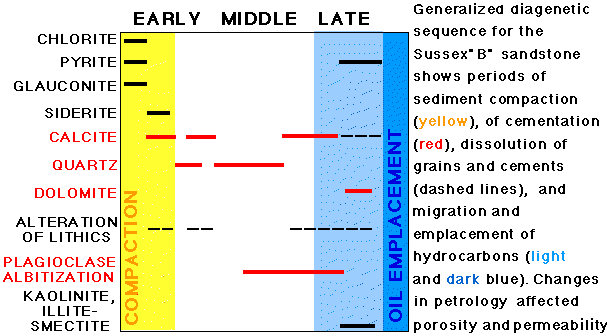
Figure 24. Generalized paragenetic sequence of the Sussex "B" sandstone (diagenes.gif). Dashed lines indicate times of dissolution of cements or grains. Yellow zone is period of sediment compaction. Medium blue zone is period of migration of hydrocarbons from shale source rocks. Dark blue zone is time of oil emplacement into the House Creek and Porcupine fields.
Precipitation of chlorite, pyrite, and alteration of fecal pellets to glauconite results from reducing conditions in marine pore fluids; this occurs soon after burial. Accumulation of bacterial end-products in pore fluids often results in precipitation of carbonate minerals and iron sulfides (Clayton, 1992). These end products affect pore water pH, Eh, and ionic strength.
The earliest diagenetic event is compaction. This is most significant for sediments with a high mud content; sand-sized grains floating in the mudstone matrix exhibit few and minor diagenetic changes. This results from isolation of these grains from pore fluids that affected cementation and dissolution. Rate of compaction of sediments decreases through time; later diagenetic cementation of sandstones by calcite and quartz stabilizes the grain framework; this decreases porosity and permeability loss through rearrangement of grains.
Even though three periods of calcite cementation are shown on figure 24, there is actually an additional stage of very early diagenetic calcite cementation. Because it is very limited in scope and distribution, it was not added to the figure. The following transmitted (rfca1sm.gif) and plane-polarized (rfcasm.gif) light images are radial-fibrous ferroan calcite. Radial-fibrous and planar-laminar calcite precipitates rapidly from pore fluids that are highly supersaturated in the carbonate ion. Bounding quartz grains exhibit peripheral dissolution but do not contain the later diagenetic chlorite rims or quartz overgrowths.
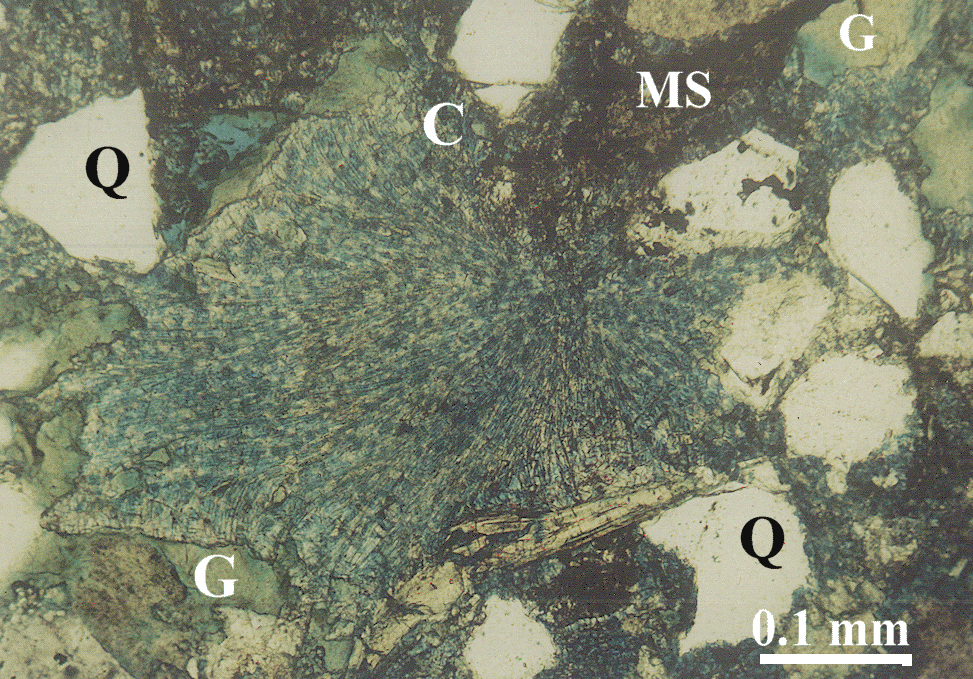
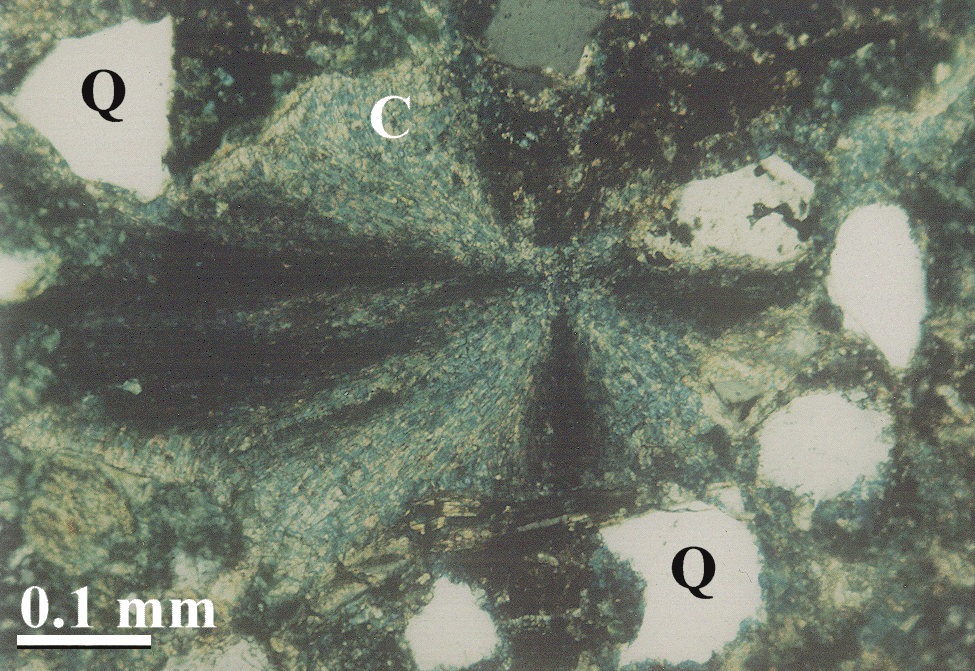
Figure 25. A. Transmitted-light view of very early diagenetic radial-fibrous calcite (C) that displaced quartz (Q) grains and glauconite. Calcite precipitated within the glauconite pellet and blasted it apart. Grains float in the matrix of calcite cement and mudstone (MS). Rfca1.gif is the full 752 KB transmitted-light image. B. The star-pattern of the calcite is apparent on this plane-polarized view. Rfca.gif is the full 736 KB plane-polarized image. Blue color results from staining the thin section for ferroan calcite.
An early-diagenetic stage of grain dissolution and replacement by calcite cement (alteration of lithics on figure 24) is indicated by standard and cathodoluminescent (CL) examination of several thin sections. The Figure 26 (clumcmts.gif) photomicroscope image of a chert-pebble lag shows the following: 1) Chert, quartz, and feldspar float in a matrix of ferroan calcite (orange) cement, 2) the "bright" spots or ghosts on the sample are not grains; they are calcite cement that is optically continuous with surrounding calcite cement. These are called ghosts because they show locations of grains that were replaced by the calcite. Ghosts are invisible using standard petrographic methods, except when floating grains and fragments suggest their origin. Because they are invisible, calculated minus-cement porosity volumes would be too great for these samples (sediment porosity near the time of deposition). Visual estimation of volume of grains and fragments removed during this stage is 1 to 5 percent.
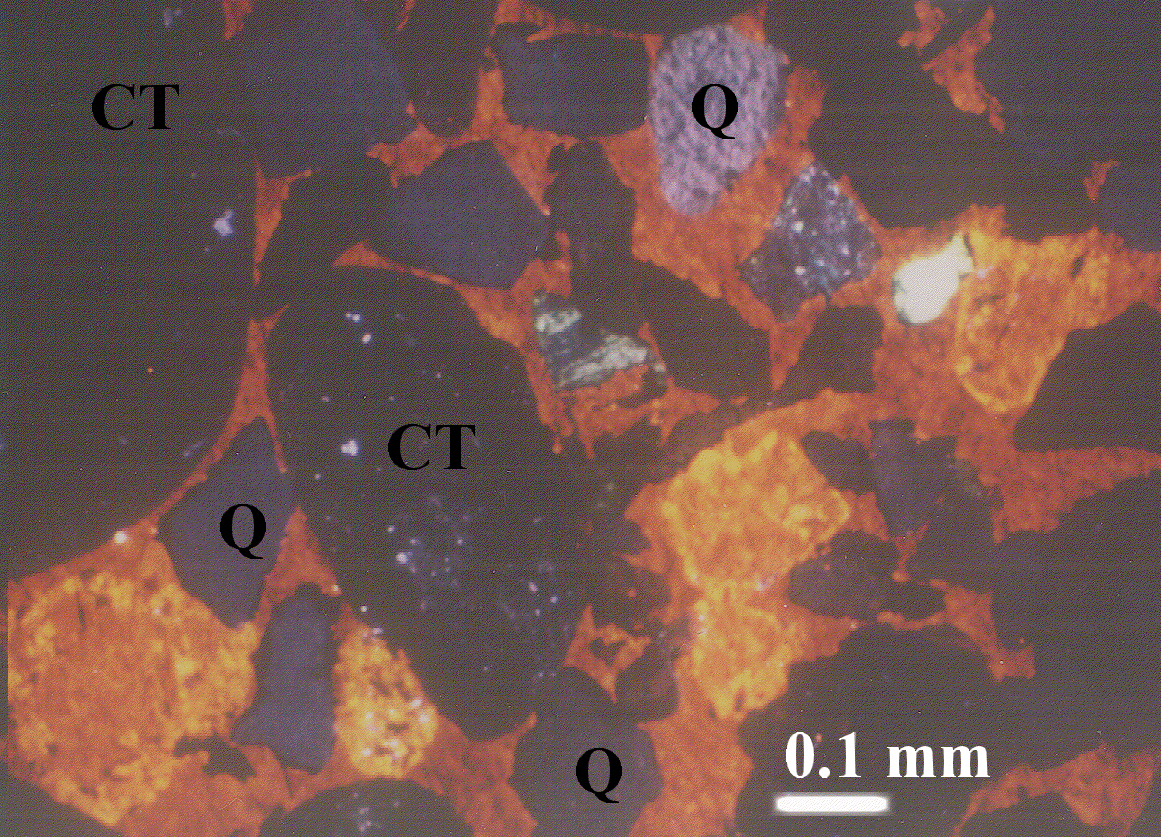
Figure 26. Cathodoluminescent photomicrograph of ferroan calcite cement (orange and bright orange) within a chert-pebble lag. Calcite is optically continuous across this view. Grains of chert (CT), quartz (Q), and feldspar (striped grain) float in a matrix of calcite cement. The feldspar grain is partially replaced by this very early diagenetic calcite. Bimodal grain distribution and point contacts between grains are also shown. clumcmt.gif is the full-scale 736 KB image. Quartz overgrowths are black (visible on the full-scale image). Scale bar is 0.1 mm.
Bimodal grain distribution results from erosion of underlying ridge sediments and incorporation of grains into the chert lag. Quartz grains exhibit very minor (meniscal in appearance) quartz cementation, that in turn has peripheral dissolution by the early diagenetic calcite cement. Quartz grains commonly have coatings of early-diagenetic chamosite. The style of early diagenesis represented in this lag and the underlying sandstone is characteristic for marine pore fluids; the sediments were probably not exposed to fluctuating ground water in a vadose zone. The meniscal (concavo-convex) occurrence of authigenic quartz results mainly from peripheral dissolution of the poorly developed overgrowths.
Rims of chlorite grow perpendicular to quartz grain surfaces and appear to be intergrown with the quartz cement, as shown on the figure 27 SEM image (semchlsm.gif). Quartz displays well-developed overgrowths. X-ray diffraction analysis (Higley, 1994) indicates that most of the Sussex "B" chlorite is ferroan chlorite, or chamosite. Fuchtbauer (1983) postulates that chlorite, chamosite, and glauconite are found almost exclusively in marine environments.
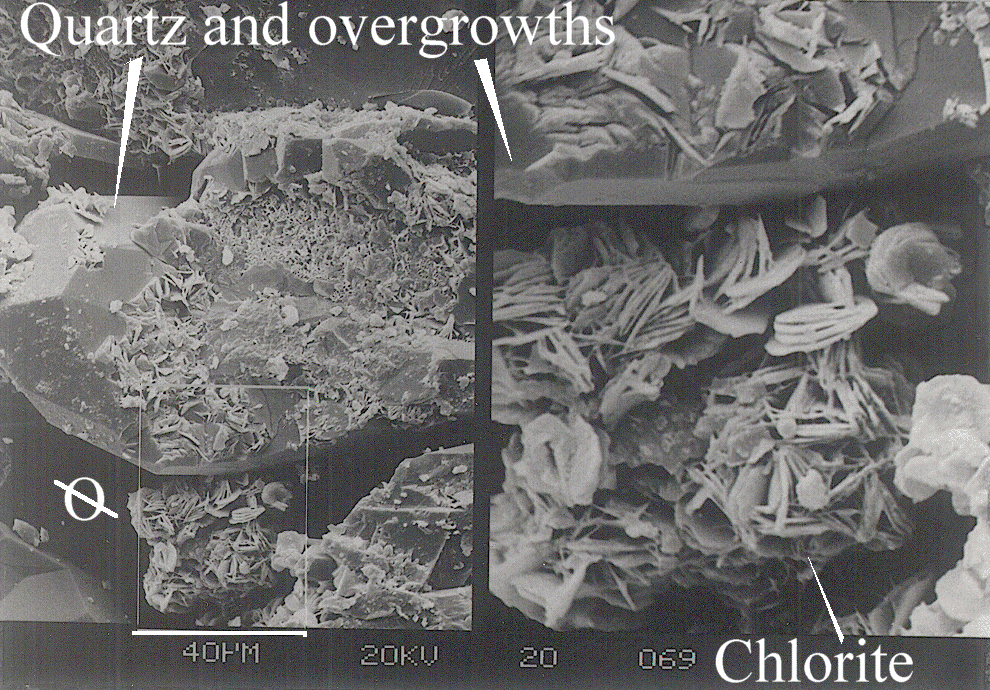
Figure 27. Scanning electron microscope (SEM) images of early-diagenetic chlorite rims (bladed crystals) that coat quartz grains and are intergrown with quartz overgrowths, No. 14-9 Federal well. Brown box shows location of the zoomed-in image. A pore space is labeled (ellipse with a line through it). Semchl.gif is the full-scale 768 KB image.
Precipitation of (middle diagenesis) calcite cement prior to cementation by quartz is illustrated by the figure 28 cross-plot of depth in feet from surface versus volumes of a) calcite cement, b) quartz cement, and c) core porosity and d) permeability. Sussex "B" sandstone average porosity and permeablity of 13 percent and 15 mD are shown, as well as Sussex core and Shannon outcrop exposures that approximate core facies described in Higley (1988, 1994). Porosity and permeability exhibit general upward increase, which correlates with increase in depositional energy (trough-cross-bedded sandstone), and decrease in amounts of calcite cements. Twin spikes of about 13 percent quartz cement are mirrored by low percentage of calcite cement.
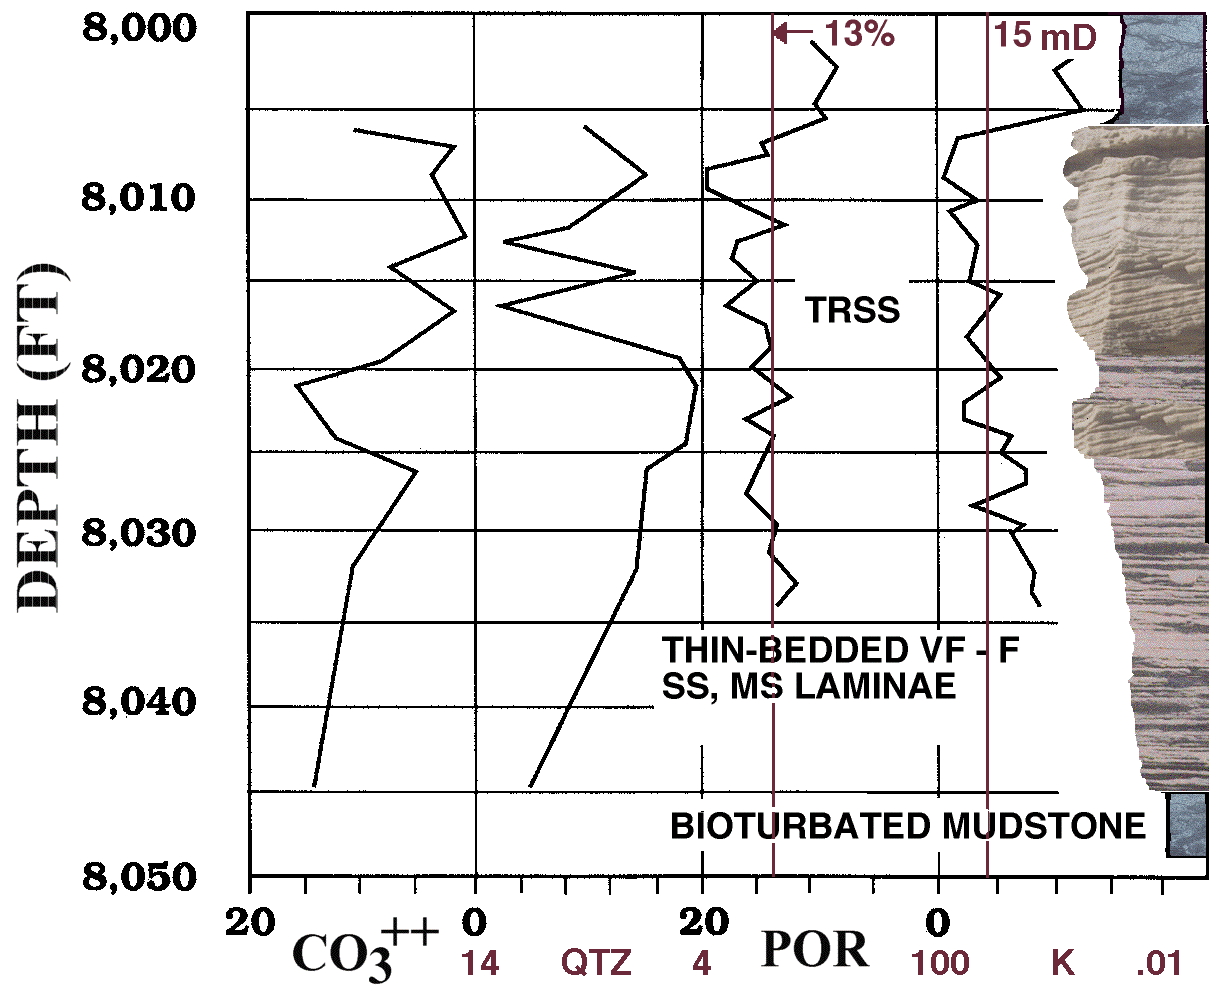
Figure 28. Shown are 1) 20 to 0 percent calcite (CO3++) and 14 to 4 percent quartz (QTZ) cements, 2) 20 to 0 percent core porosity (POR), 3) 100 to 0.01 mD permeability (K), and 4) photographs showing facies for the Sussex "B" sandstone, Empire Federal "C" oil well. TRSS is trough-cross-bedded sandstone intervals; these are concentrated near the top of the "B" sandstone and are the primary reservoir facies. "THIN-BEDDED VF-F SS, MS LAMINAE" refers to the thin-bedded horizontally stratified fine-grained sandstone and interbedded mudstone. Bioturbated mudstone is the blue-gray-colored rock located mainly at the base and top of this section. Heavy vertical bar on the right side of the figure is the perforated zone. The full-scale 144 KB image is empfedsr.gif.
Early diagenetic alteration of the hash is indicated by presence of the competent siderite clasts on Sussex "B" trough-cross-bedded sandstones (figure 29). The initial stage of calcite cementation in the Sussex "B" sandstone is probably contemporaneous with alteration to siderite of foraminiferal tests and other depositional carbonate hash (figure 30).
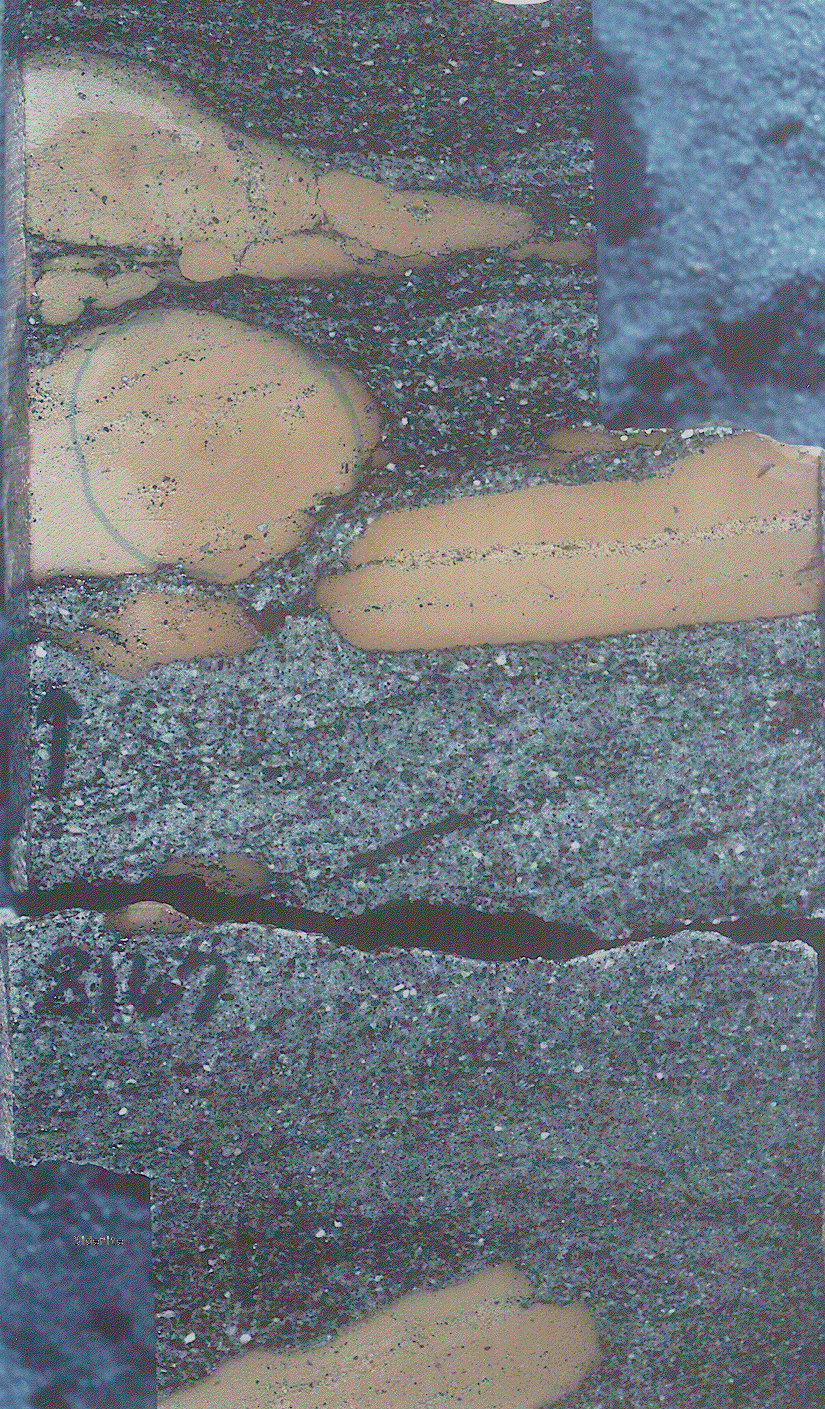
Figure 29. Core photograph (trs8167s.gif) from 8,167-ft depth in the Mandel Federal "C" well shows siderite clasts that were ripped up by high-energy currents and redeposited on the trough-cross-bedded sands of submarine dunes. Original horizontal bedding is shown in clasts by the stringers of quartz grains. The full-scale trs8167.gif image is 992 KB.

Figure 30. Thin-section photomicrograph of a siderite clast in a chert-pebble lag, No. 14-1 Federal well, Porcupine field (foramsm.gif). Foraminifera tests in the clast have been partially replaced by siderite (brown). Evidence for the marine origin of the siderite clasts includes alteration to siderite of Haplophragmoides and Reophax foraminiferal tests. The full-size foram.gif image is 768 KB.
A number of diagenetic stages are shown on the figure 31A, B transmitted-light and crossed-nicols photomicrographs (pyrca1sm.gif, pyrca2sm.gif). Pyrite (P) framboids (similar in appearance to raspberries) are black in transmitted-light and crossed-nicols views. These late-diagenetic pyrite crystals are commonly associated with the dolomite and may result from changes in chemical composition of pore fluids resulting from migration of hydrocarbons into the Sussex "B" sandstone.
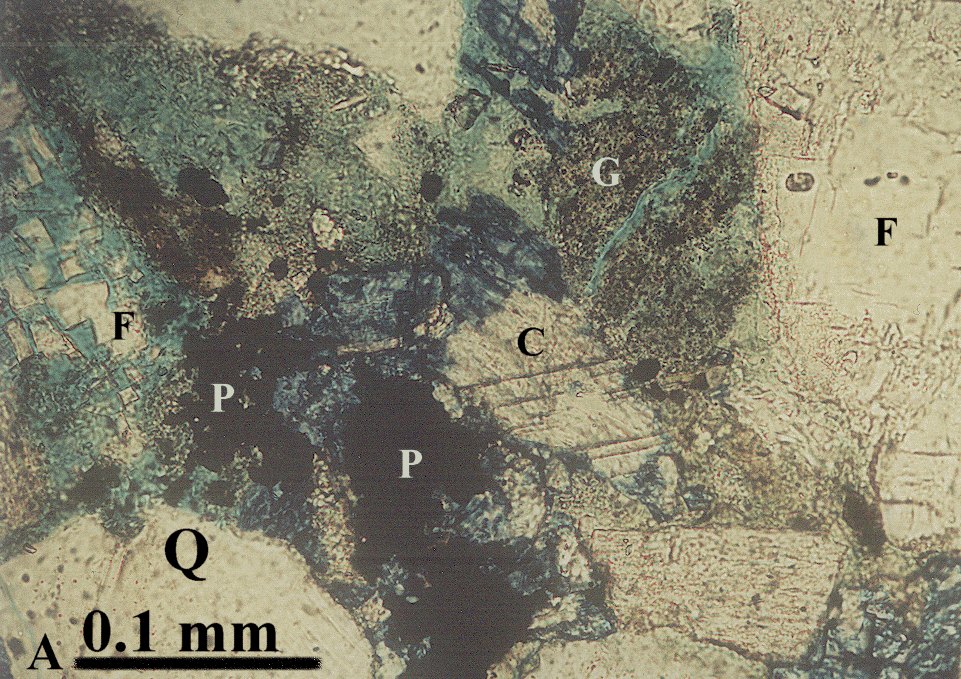
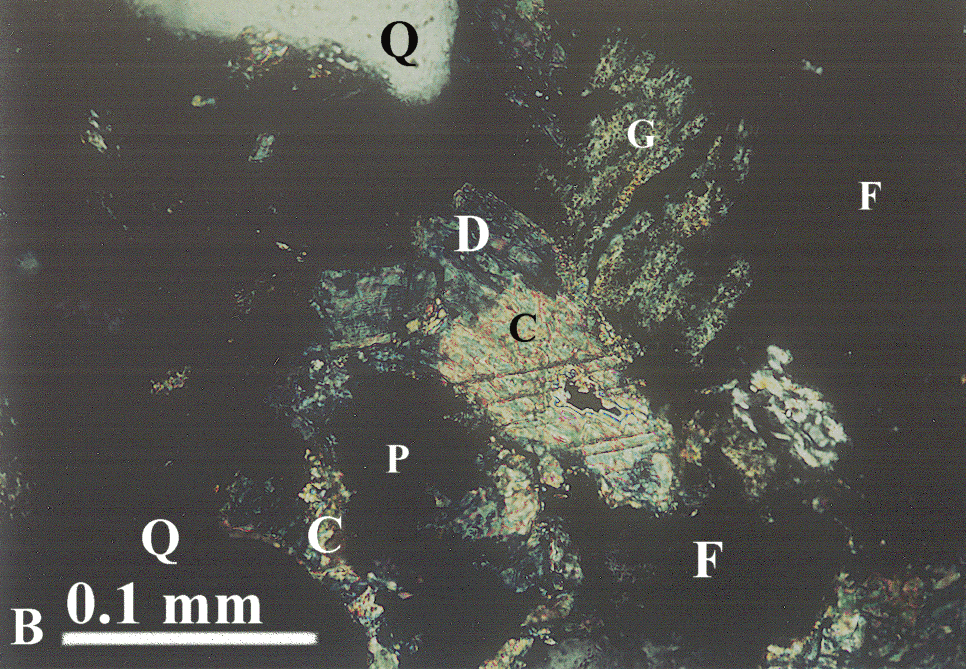
Figure 31. A. Transmitted-light and B. crossed-nicols thin-section photomicrographs of pyrite framboids (P) within ferroan dolomite (D) from a trough-cross-bedded sandstone at 8,014-ft (2,443 m) depth in the Empire Federal "C" oil well. Quartz (Q) and feldspar (F) grains bound optically-continuous calcite (C) cement. G is a glauconite pellet. Medium blue is epoxy and mottled blue results from kaolinite clay (transmitted light view), dark blue on both views is the late-diagenetic ferroan dolomite. Full-size transmitted-light image is 752 KB pyrca1.gif. Full-size crossed-nicols view is 784 KB pyrca2.gif.
Quartz and feldspar grains in the figure 31 thin section display well-developed overgrowths. Overgrowth formation was followed by precipitation of optically continuous, non-ferroan, poikilotopic, zoned calcite cement (C). Figure 31B reveals subsequent spotty dissolution of the calcite cement by distribution of optically continuous fragments. This was followed by filling of the secondary pore by ferroan dolomite and pyrite. Also visible are a glauconite pellet (G) that has been slightly altered to illite (bright speckles under crossed nicols), and plagioclase feldspar (F, left border of images) that underwent extensive late-diagenetic dissolution and recrystallization. Original grain outline is indicated by brown dead oil (latest diagenetic emplacement).
Dissolution of the ferroan calcite cements resulted mainly from changes in pore fluid chemistry, primarily organic and carbonic acids associated with hydrocarbon generation and migration into the reservoir. This created secondary porosity, and provided the primary source of chemically reduced iron for pyrite and ferroan dolomite. Migration also resulted in dissolution of feldspar and subsequent precipitation of kaolinite in pores.
Late-stage influx of oil into the field area is indicated by both petrologic analysis of thin sections and burial history reconstructions. Thin sections that are oil saturated generally exhibit well-developed quartz overgrowths, dissolution of unstable lithics, and other stages characteristic of middle to late diagenesis. The time of oil generation for source rocks of the Sussex "B" sandstone is within the time range of 40 Ma to possibly 10 Ma (Higley, 1994). Cody Shale samples from six wells in and near the House Creek field are marginally mature for oil generation and migration; mean random vitrinite reflectance (Rm) for nine samples ranges from 0.51 to 0.56 percent Rm at current depths of 7,700 to 9,800 ft (2,300 to 3,000 m). This Rm range is lower than the 0.6 percent to 0.65 percent Rm onset of oil generation for types II and III kerogen (Waples, 1985) that characterize these marine shales. Absence (currently) of faulting, and encasement of the reservoir in low-permeability shales of the Cody Shale suggest that the oil was generated in place, or at least did not experience long-distance migration. Suppression of vitrinite is also a possibility, with this scenario the Rm values would be slightly greater than recorded. A possible source of oil within the House Creek field is more thermally mature Cody Shale that is located deeper in the basin (Higley, 1994)
The Powder River Basin is an asymmetric Laramide-age structural basin with a steeply dipping western flank and a gently dipping eastern flank. The Upper Cretaceous Cody Shale, including the Sussex Sandstone Member and its equivalents, underlies most of the Powder River Basin and outcrops along the western flank, west of the Lance Formation and Fox Hills Sandstone outcrops shown as stippled patterns on figure 1 (indexfsm.gif).
The areal extent of the Sussex "B" sandstone is also indicated on figure 1; the eastern boundaries of the House Creek and Porcupine fields approximate the eastern limit of the "B" sandstone. While the western margin of the fields does not define the western limit of the "B" sandstone, it does show the limit of reservoir-grade facies. There is a probable upper sandstone of the "B" located along the northwestern margin of the House Creek field, although well data is insufficient to determine whether reservoir-grade facies are present. Sussex "B" sandstone facies west of the field margins are mainly low-porosity and low-permeability mudstones and interbedded thin sandstones.
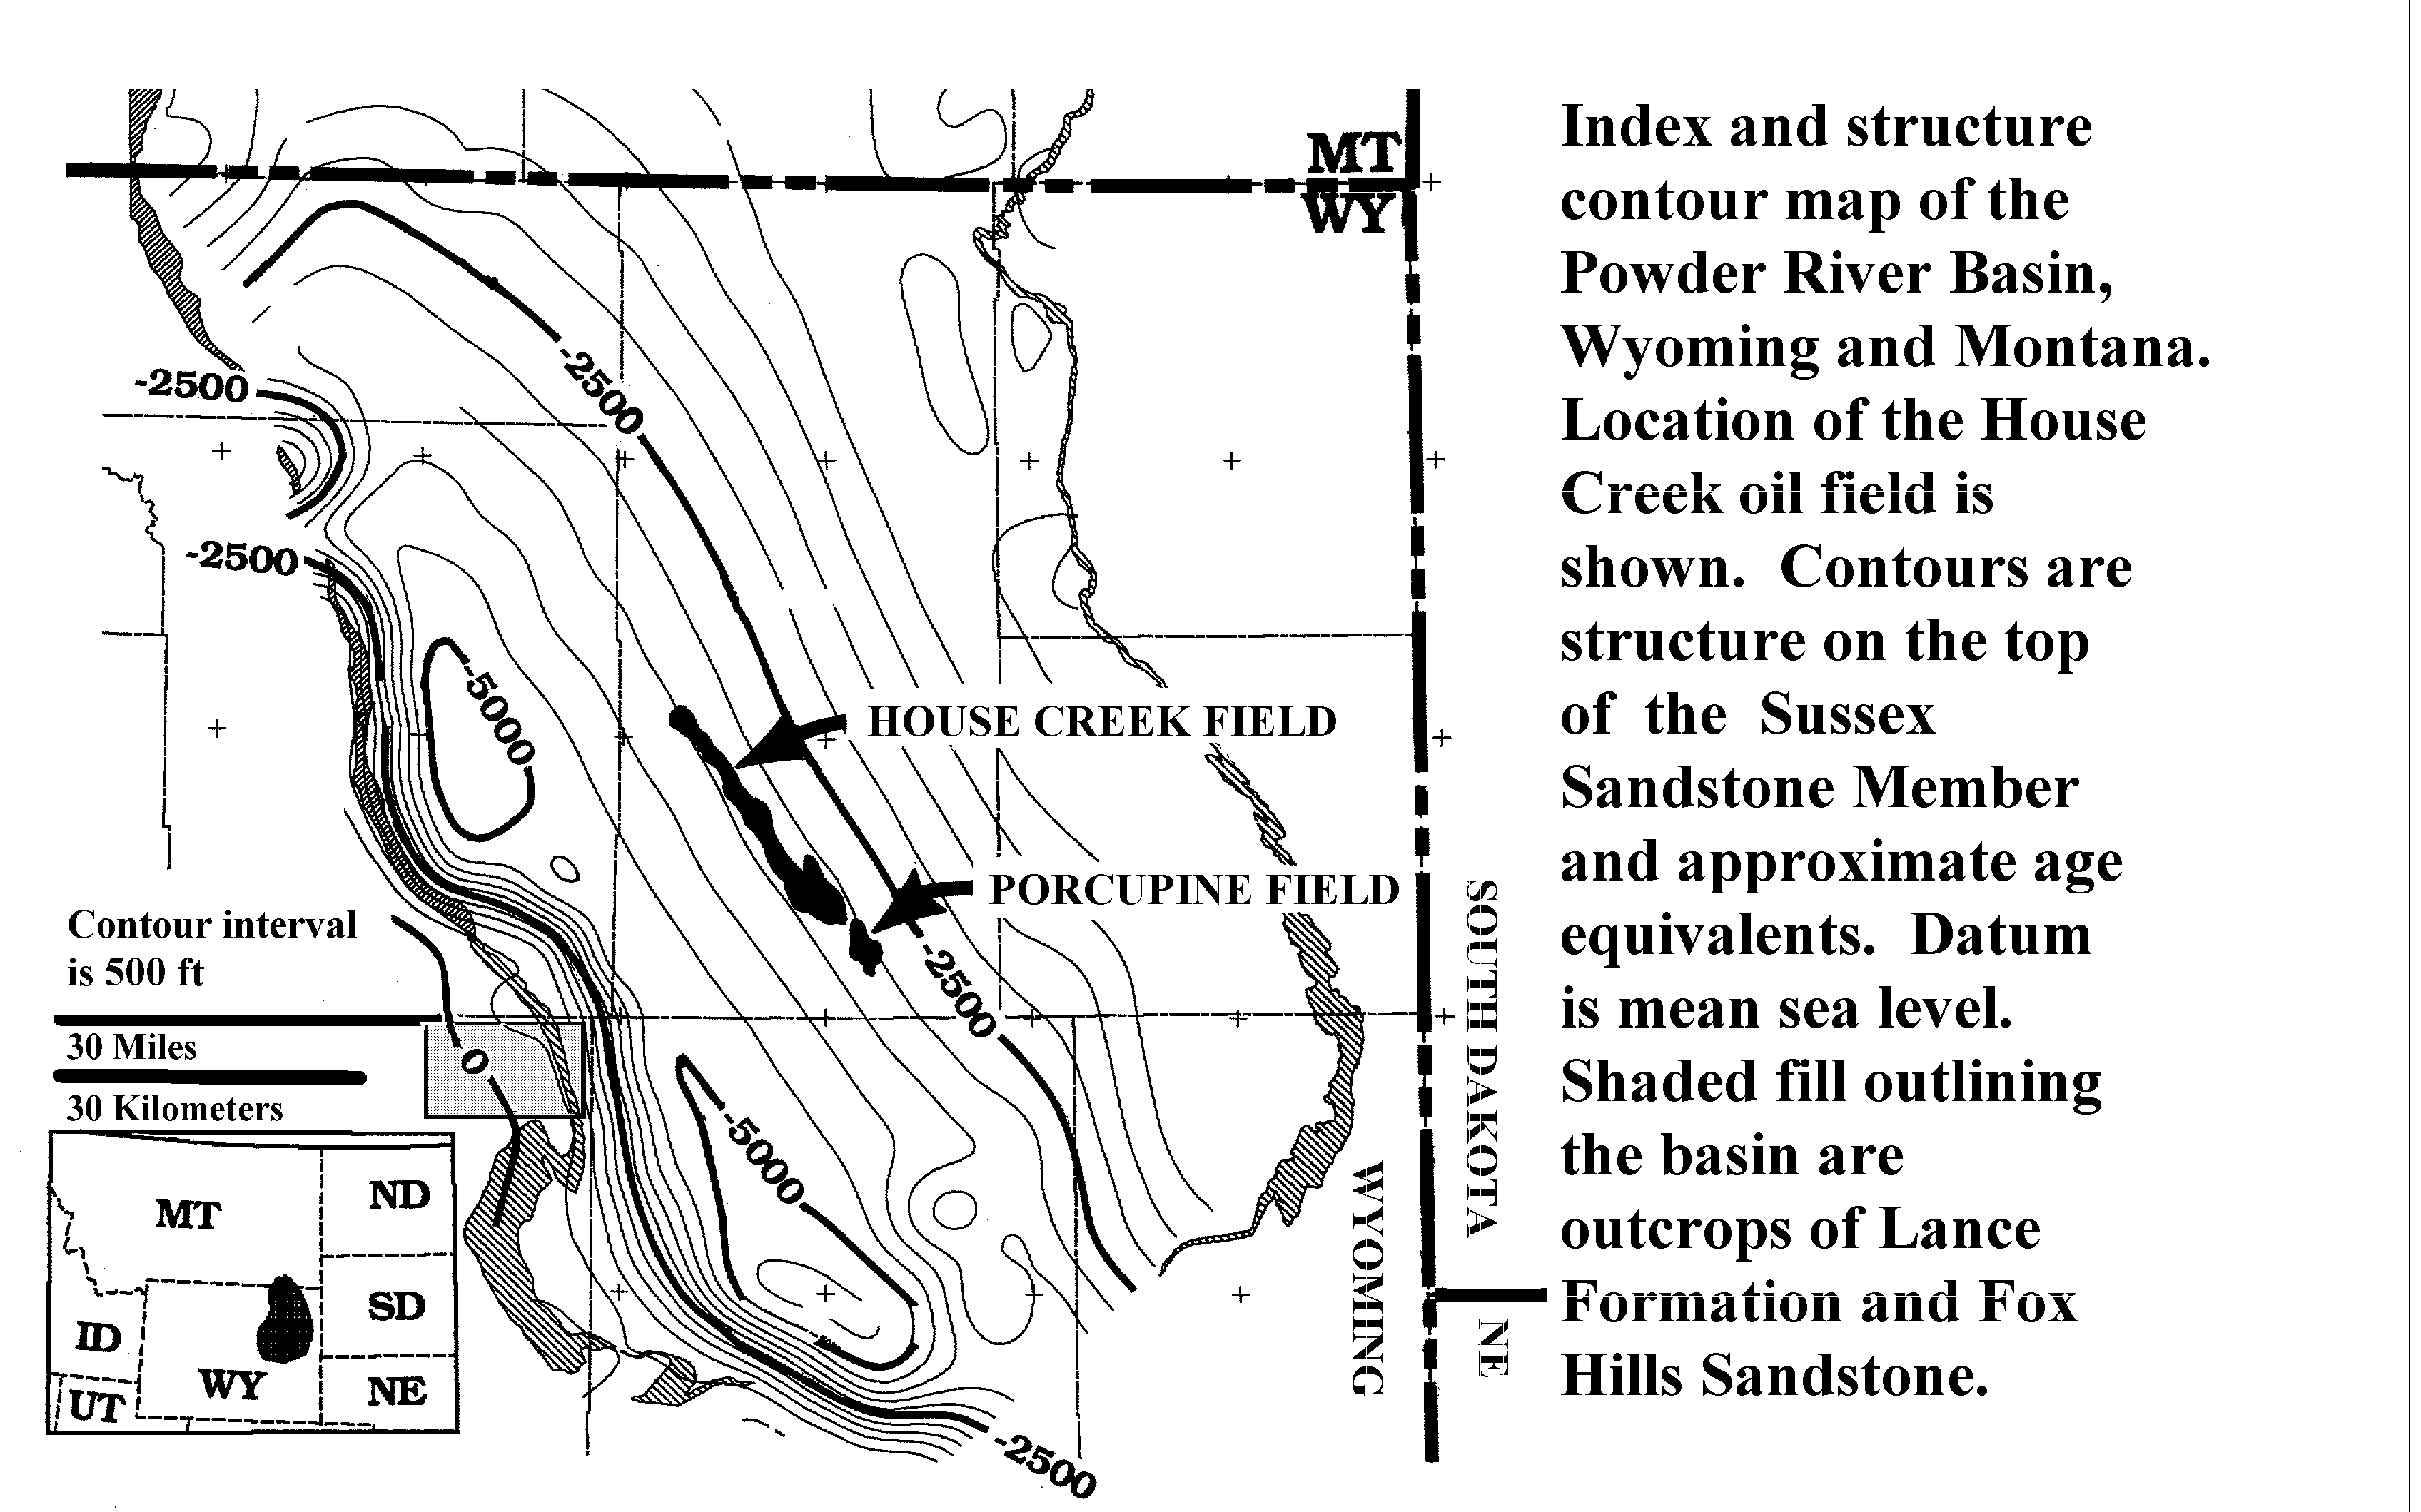
Figure 1. Structure contour map on the top of the Upper Cretaceous Sussex Sandstone Member of the Cody Shale and approximate age equivalents, Powder River Basin, Wyoming and Montana. Location of the House Creek field is shown. Areal extent of the Sussex "B" sandstones is delineated by black-colored fields. Shaded fill outlining the basin are outcrops of Lance Formation and Fox Hills Sandstone. The rectangle located to the right of 30-miles scale bar defines the area of studied outcrops of the Sussex and Shannon Members, much of the Salt Creek anticline, and the towns of Midwest and Edgerton. Contour interval is 500 ft. Datum is mean sea level. A detailed (176 KB) version is named indexfig.gif.
Most oil production in the Sussex "B" sandstone is from the House Creek field with only minor production from the Porcupine field. More than 24.8 million barrels of oil (MMBO), 21.2 million cubic feet of gas (MMCFG) and 1.6 MM barrels of water have been produced from the Sussex "B" sandstone in the House Creek field (PI Production data through December, 1996). Concentrated along field axes are greatest oil production, and the most porous, permeable, laterally continuous, and thickest sandstone beds; combination of these factors indicates the Sussex "B" sandstone and similar reservoirs would be good candidates for horizontal drilling. The figure 32 (oilprod.gif) contour map of cumulative oil production across the field area shows concentration of greatest production along the southeastern and northwestern ridge systems. Estimated original oil in place (OOIP) was 159 million barrels (Sabel, 1985). Ultimate recovery is estimated at about 45 MMBO and 40 MMCFG, less than 30 percent of the OOIP. The Porcupine field is located at the southern margin of the House Creek field. More than 3 MMBO and 5 MMCFG have been produced from all reservoirs within the Porcupine field; production is commingled for the Sussex "B" sandstone, the Muddy Sandstone Member of the Early Cretaceous Thermopolis Shale, and the Turner Sandy Member of the Upper Cretaceous Carlile Shale (Lawyer and others, 1981).
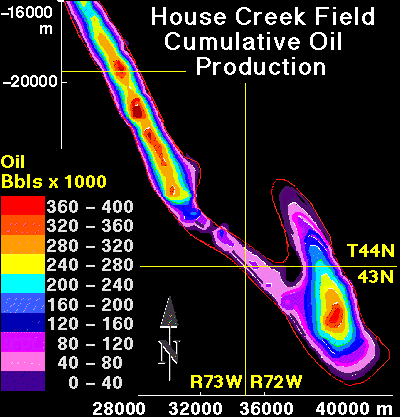
Figure 32. Contour map of cumulative oil production across the House Creek field area. Field is delineated by the red line. Contour interval is 40,000 barrels of oil. Map scale, in meters, is shown around the margin. Township and range line intersections are also drawn. Greatest production is proximal to field axes; these are also areas of stacked sand ridges; oil is commonly produced from 2 sandstone bodies separated by a permeability barrier. Porosity and permeability generally decrease west of the eastern margins of the field, so increase in production along the field axes is a function of thickest intervals of stacked sandstones with greatest porosity and permeability.
The House Creek field has two axis orientations; these result from depositional patterns of the four sand ridges. Deposition of the "B" sandstone began in the southeastern corner of the field with sand ridge 1; axis orientation of this sand ridge is about north 20 degrees west. Overlying and later deposited sand ridges 2 through 4 are located west and north of sand ridge 1; their axis orientations are approximately north 32 degrees west. Progressive northward deposition of later sand ridges is probably associated with contemporaneous uplift of the northeast-trending Belle Fourche arch, which cuts across the northern boundary of the field in figure 1. The arch orientation is perpendicular to the field. Movement along the arch and lineaments may have caused topographic highs that localized Sussex and Shannon deposition along the arch (Higley, 1994).
Reservoir intervals exhibit upward and seaward increases in grain size, porosity, and permeability, both across sand ridges 1-4, and for the individual stacked thin-bedded reservoir sandstones that comprise the sand ridges. Individual thin trough-cross-bedded sandstones commonly coarsen downward. Greatest oil production, porosity, permeability, thickest reservoir sandstone intervals, and best lateral continuity of the primary reservoir facies are all located parallel and proximal to field axes.
Oil is stratigraphically trapped in the Sussex "B" sandstone by an updip and overlying change from porous and permeable sandstone to relatively impermeable mudstone, and by an areally discontinuous capping chert-pebble sandstone; there is no oil-water contact in the field. Rapid decline in porosity and permeability at the upper contact of the Sussex "B" sandstone is visible on well log traces, core and core data, and vertical slices of 3-D porosity and permeability. Sussex "B" facies west and east of the field boundaries are non-oil-productive, low porosity and permeability sandstones and bioturbated mudstones. These are the low-depositional-energy facies. "Correlation of electric logs across the fields (in the area) shows that a thick section of relatively low-permeability sandstone or siltstone is present in dry holes down dip from the (House Creek) field on the southwest" (Berg, 1975).
Primary, secondary, and tertiary recovery of oil is strongly affected by reservoir heterogeneities. House Creek field heterogeneity includes concentration parallel and proximal to field axes of greatest oil production, porosity, permeability, and greatest thickness and stacking of reservoir sandstones. Production is adversely affected by complex interbedding of thin-bedded reservoir sandstones with low-permeability sandstones and mudstones. These numerous permeability barriers and baffles cause field- and well-scale compartmentalization. Production is also decreased by pore-filling kaolinite and ferroan-calcite cements. Thickness of the permeability barriers that separate and compartmentalize upper from lower sand ridges is variable across the field. These low-energy facies were sometimes removed by erosion prior to or during deposition of overlying sandstones. This is particularly common in the northwestern half of the field area.
The following two figures are plan-view contour maps of the entire thickness of Sussex "B" sandstone in the House Creek field (figure 6, ssxisos.gif), and of the reservoir sandstone interval (figure 33, resisos.gif).
Figure 6. Isopach map of the Sussex "B" sandstone showing thickness in feet of the interval between bounding disconformities; contour interval is 4 ft (1.2 m). Map scales are meters. The small index contour map is cumulative oil production; contour interval is 40,000 barrels. The thin red line outlines the boundary of the House Creek field. Thin white lines in the southern half of the field are limits of sand ridge 1 and overlying sand ridge 2. The large-scale 64 KB image is named ssxiso.gif .
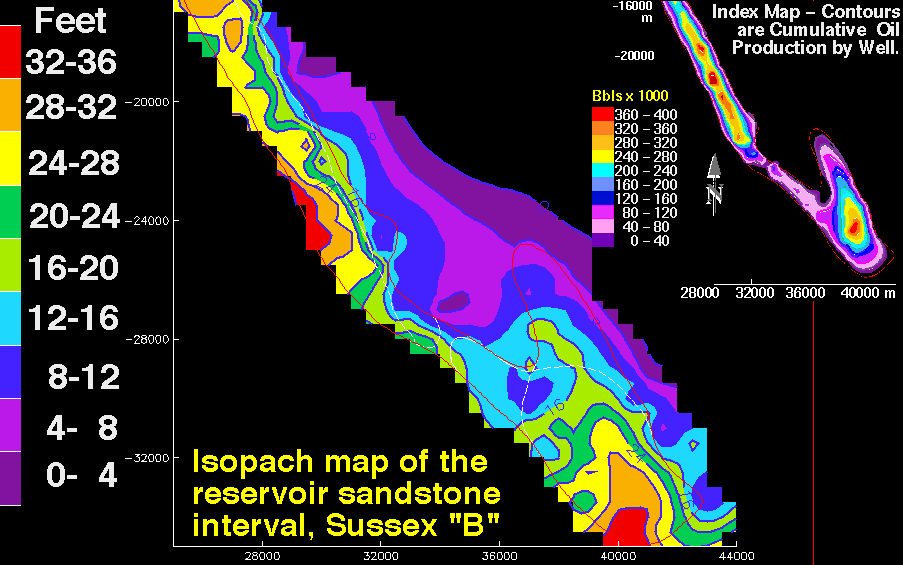
Figure 33. Sussex "B" sandstone isopach showing thickness in feet of the reservoir-grade sandstone interval. The House Creek field is delineated by red lines; the faint white lines outline sand ridge boundaries. Contour interval is 4 ft (1.2 m). Map scales are meters. In some areas, contours are extrapolated outside of data control. Reservoir sandstone intervals were determined by examining well-log traces of about 120 wells, as well as core and petroleum production data; boundaries correspond to a cut-off of about 8.5 percent porosity. This interval includes lower porosity sandstone and mudstone located within and between sand ridges. Index map is cumulative oil production across the field; contour interval is 40,000 barrels of oil (BO) for the range 0 to 400,000 BO. Resiso.gif is the large-scale 64 KB contour map of reservoir intervals.
Illustrated by the figures 6 and 33 contour maps are:
The House Creek field was discovered by Woods Petroleum in 1968 (Berg, 1975; Sabel, 1985). Low initial production of 90 barrels of oil per day (BOPD) for the No. 1 State 1319 discovery well resulted in low rates of early drilling for the field. The well is located in sec. 36, T. 44 N., R. 73 W. within the "shadow zone" of low-depositional-energy facies that lies between the northwestern and southeastern ridge systems. The well is situated between sand ridges 2 and 3 on the following plan-view image of the top of the Sussex "B" sandstone (figure 34, ewhslics.gif).
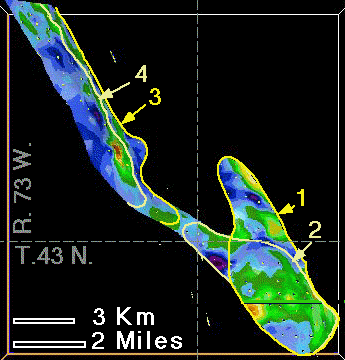
Figure 34. Plan-view map on the upper disconformity surface of the Sussex "B" sandstone within the House Creek field. Reservoir-grade intervals are shown by green through red (8 to 21 percent porosity); low-porosity non-reservoir intervals are purple through blue (1 to 8 percent porosity). Sand ridges 1 through 4 and field boundaries are delineated by yellow and tan; dashed lines separate townships and ranges. Basal sand ridges are 1 and 3.
The following House Creek field production decline curve (figure 35, declines.gif), for the period from January 1976 through August 1992, shows gradual decrease in barrels of oil recovered, mirrored by increasing gas production and associated increase in gas-oil ratio (GOR). GOR on the chart is multiplied by 100,000 to better show the curve. Increases in gas production are primarily due to decrease in reservoir pressure as oil is pumped out. Original GOR was 341 and initial field pressure was 3,220 psi (Bauder, 1981). Pronounced dips in the curves result mainly from periods of non-production due to maintenance and (or) economics.
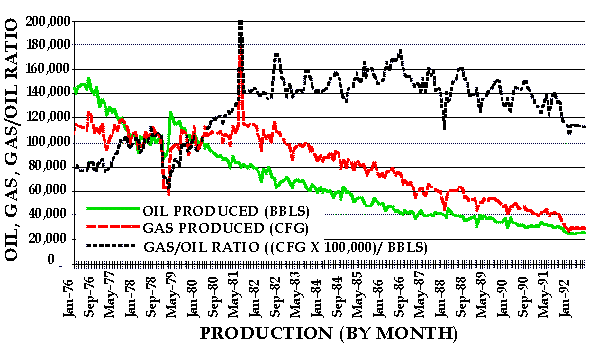
Figure 35. Production decline curve for monthly intervals from 1976 through August 1992 in the House Creek field. Oil (BBL), gas (CFG) and gas/oil ratio (GOR) curves are shown. GOR is multiplied by 100,000 to better view increase in through time of gas production relative to oil. Water production is not shown due to small volumes. Cumulative production to January 1976 was 8.73 MMB of oil and 4.06 MMCF of gas (Petroleum Information Corp. production data).
Average cumulative oil production per well for 111 wells (through July 1993) in the House Creek field is 120,000 barrels; average cumulative gas production is 110,000 cubic feet. Initial production averaged 154 barrels of oil per day (BOPD) for 108 wells within the field boundaries. Average perforated thickness is 14 ft (4.3 m). Most wells perforate both upper and lower sand ridges, and production is commingled (not separated out by upper or lower sandstones). The thickest perforated intervals are located in wells near the southwestern tip of the field, and along and west of the field axis in the northwestern half of the field.
A combination of liquid expansion and solution was the original drive mechanism of the House Creek reservoir; pump production was necessary from the 1968 discovery date (Sabel, 1985). Completion practices consist primarily of casing, perforating, hydraulic fracturing, and, in some instances, acid treatment to increase productivity. "A secondary recovery waterflood, scheduled to start in early 1986, is expected to increase production from 12.5 to 21.5 percent of the original oil in place" (Sabel, 1985). Production to 1995 is 14 percent of original oil in place (OOIP).
Woods Petroleum operated a secondary recovery unit from section 12 of T. 45 N. to the southern boundary of the field, and Inexco Oil operated the recovery unit for the rest of the field. A 3-to-1 line drive flood was originally planned in order to minimize additional drilling. Woods predicted secondary recovery of 83 percent of primary recovery; testing of residual oil in core samples indicates residual oil content of 40 percent in water-swept areas (Sabel, 1985).
The southern half of the House Creek field is owned and operated by Kerr-McGee Corp. of Oklahoma, which took over the property from Sonat Exploration Co. in 1991 (Lyle, 1992). Kerr-McGee adjusted Sonat's 3-to-1 line drive water-flood program to a 1-to-1 pattern to increase recovery of oil. The 1-to-1 pattern has one row of producers for one row of injectors (Lyle, 1992). Increase in production will result from minimizing bypass of oil that would have occurred using the 3-to-1 pattern because of a more even sweep of injected fluids parallel to field axes. Primary flow unit orientation for the most porous and permeable sandstones is parallel to field axes (Higley, 1994). Kerr-McGee will convert 28 wells from producers to injectors (Lyle, 1992). With the new pattern, Kerr-McGee is planning about 15 new wells, including 4 injector wells, for a total of 130 (Lyle, 1992).
The project is currently a polymer flood and qualifies for tertiary recovery status. Potassium hydroxide (KOH) is added to injected water to decrease swelling of clays and resulting loss of injected water through high-permeability stringers. Clays are primarily kaolinite (0.8 percent based on thin-section analysis) with trace amounts of illite, illite-smectite, and ferroan chlorite (chamosite) minerals. Quartz overgrowths isolate most chlorite from injected fluids. KOH removes oil near well bores thereby increasing formation permeability to injected water (Lyle, 1992).
The following thin-section photomicrograph (figure 36, oilstnsm.gif) is an oil-productive, medium-grained trough-cross-bedded sandstone. Oil (dark brown) coats grains and fills voids. The large pore in the upper left quarter of the image is mainly secondary, resulting from dissolution of a (now-absent) probable feldspar (F) grain. This late-stage dissolution resulted in precipitation of kaolinite (K); associated microporosity causes decrease in permeability. The feldspar grain located below the labeled kaolinite exhibits intragranular porosity resulting from grain erosion; this enhances oil emplacement by creating secondary pore spaces. Other grains exhibit peripheral dissolution; this primarily improves permeability by improving interconnections between pores. Kaolinite resulted mainly from late-diagenetic migration of organic acids into the Sussex "B" sandstone and other chemical changes associated with oil generation and migration (Higley, 1994). The large pores are void of oil because it drained out during coring and thin-section preparation.
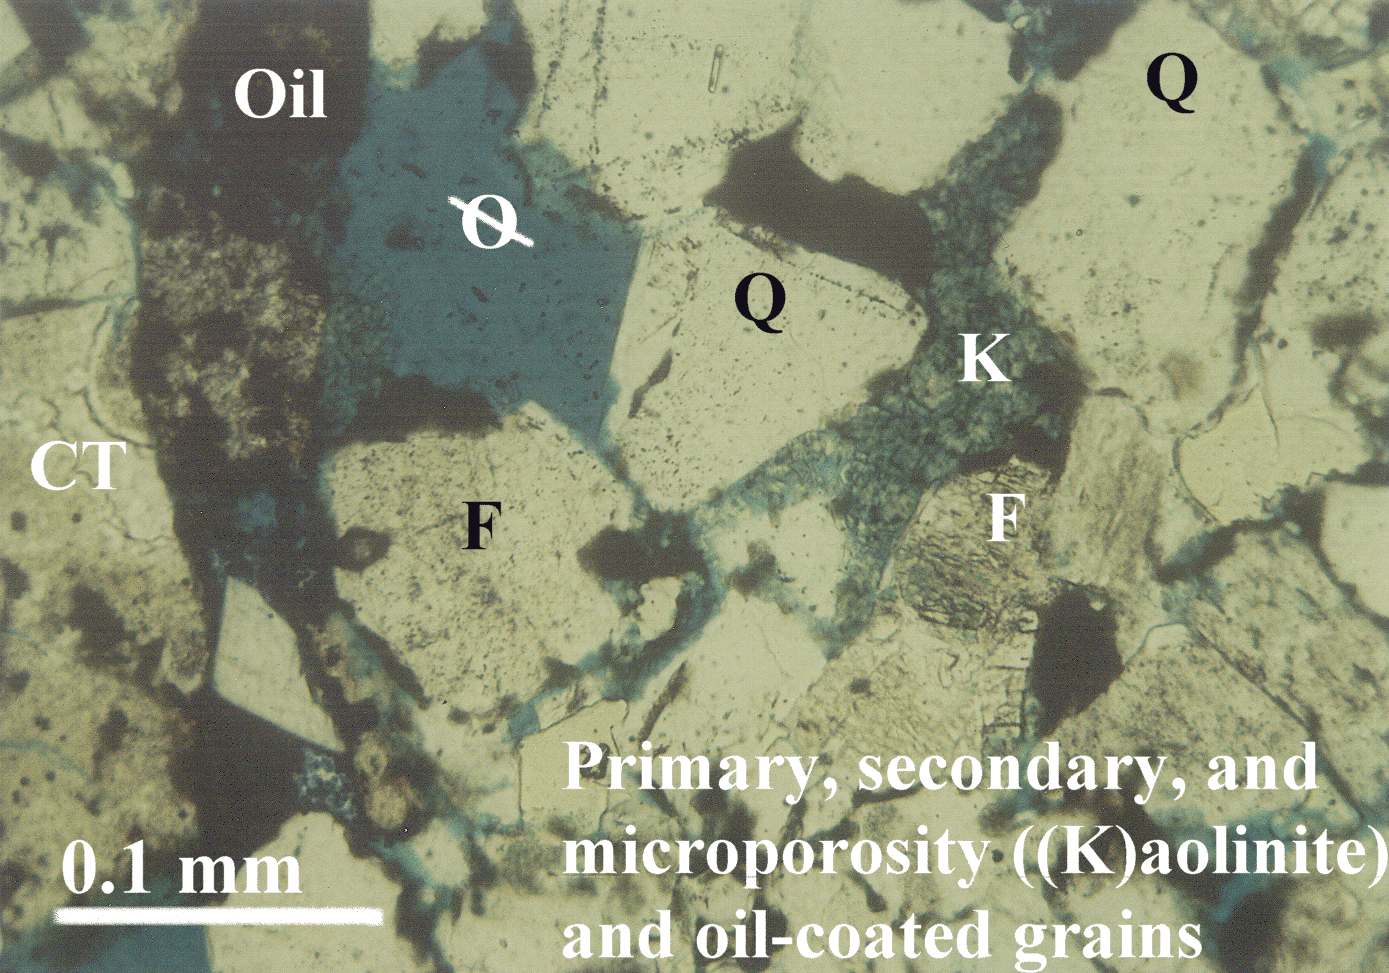
Figure 36. Transmitted-light thin-section photomicrograph of an oil-productive trough-cross-bedded, medium-grained sandstone from the House Creek field. Oil (brown) coats primary and secondary pore spaces. Spotty distribution of oil in the kaolinite (K) results from low permeability and microporosity. Feldspar (F) grain is partially dissolved. Quartz (Q) and chert (CT) grains are labeled. Blue epoxy fills pore spaces (ellipse with a line through it). The full-size photomicrograph is oilstn.gif, 1.4 MB .
Display images of the field by clicking on highlighted (generally underlined) key words. Alternately, the GIF files (including numerous incremental images that are not listed below) are stored in the ewporosv directory and can be displayed as a slide show using an external viewer, such as JPEGView or LView. The ewporosv.MOV (east-west vertical slices of porosity, single fork) is a 14 MB stand-alone movie file located in the movies folder. Movies are called up much quicker directly from the folder than from the below text hook, although the animation speed is similar. Should you have trouble accessing and displaying images, try increasing available memory by closing all unnecessary windows and software programs.
Technical information on data sources and methodologies is stored in techinfo.htm. Start the movie display of east-west-oriented vertical porosity slices using E-W movie (ewporosv.MOV). Before the movie can be opened, you may need to copy to your hard drive movie-viewing program; information on how to acquire this freeware and software is listed in the readme for movies file.
Plan view of field area (hslicsmf.gif); north is at the top of the map. Seaward boundaries of sand ridges mark the approximate eastern limits of sandstone bodies that comprise the House Creek field. These boundaries are not labeled on the slices; however, they were used in the 3-D computer gridding procedure to confine porosity limits within sand ridges. The subsequent (ssxhome.gif) image is vertical slice 12 of the field at the -32,000 m Y-axis location; vertical exaggeration is 20 times. Reservoir-grade intervals are shown on the left color bar by green through red (8 to 21 percent porosity); low-porosity non-reservoir intervals are purple and blue (1 to 8 percent porosity).
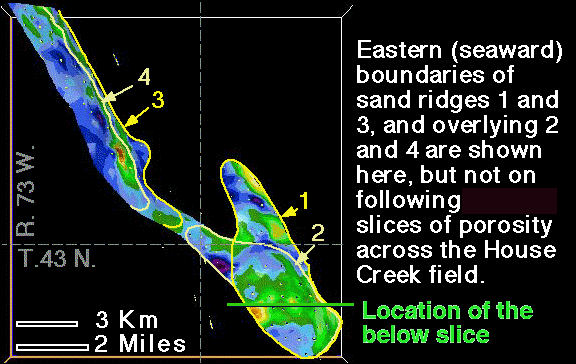
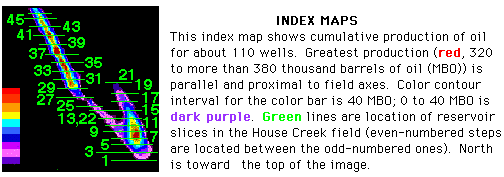
West-east- and north-south-oriented vertical slices are spaced at 500 m (1,524 ft) intervals. Explanation and index map are included on images. The two color bars represent 1) porosity in increments of 1 percent and 2) contours of 40 MBO per well; a barrel of oil is equivalent to 42 U.S. gallons (158.76 liters). Vertical exaggeration of the 3-D porosity model is 40 times.
Top view - rotated 70 degrees from horizontal
Top view - rotated 45 degrees from horizontal
Top view - rotated 20 degrees from horizontal
Slice 1 - South end of field - Y-Axis slice at -35,500 m
Slice 2 - Y-Axis slice at -34,500 m
Slice 3 - Y-Axis slice at -34,000 m
Slice 4 - Y-Axis slice at -33,500 m
Slice 5 - Y-Axis slice at -33,000 m
Slice 6 - Y-Axis slice at -32,500 m
Slice 7 - Y-Axis slice at -32,000 m
Slice 8 - Y-Axis slice at -31,500 m
Slice 9 - Y-Axis slice at -31,000 m
Slice 10 - Y-Axis slice at -30,500 m
Slice 11 - Y-Axis slice at -30,000 m
Slice 12 - Y-Axis slice at -29,500 m
Slice 13 - Y-Axis slice at -29,000 m
Slice 14 - Y-Axis slice at -28,500 m
Slice 15 - Y-Axis slice at -28,000 m
Slice 16 - Y-Axis slice at -27,500 m
Slice 17 - Y-Axis slice at -27,000 m
Slice 18 - Y-Axis slice at -26,500 m
Slice 19 - Y-Axis slice at -26,000 m
Slice 20 - Y-Axis slice at -25,500 m
Slice 21 - Y-Axis slice at -25,000 m
Slice 22 - Y-Axis slice at -29,000 m
Slice 23 - Y-Axis slice at -28,500 m
Slice 24 - Y-Axis slice at -28,000 m
Slice 25 - Y-Axis slice at -27,500 m
Slice 26 - Y-Axis slice at -27,000 m
Slice 27 - Y-Axis slice at -26,500 m
Slice 28 - Y-Axis slice at -26,000 m
Slice 29 - Y-Axis slice at -25,500 m
Slice 30 - Y-Axis slice at -25,000 m
Slice 31 - Y-Axis slice at -24,500 m
Slice 32 - Y-Axis slice at -24,000 m
Slice 33 - Y-Axis slice at -23,500 m
Slice 34 - Y-Axis slice at -23,000 m
Slice 35 - Y-Axis slice at -22,500 m
Slice 36 - Y-Axis slice at -22,000 m
Slice 37 - Y-Axis slice at -21,500 m
Slice 38 - Y-Axis slice at -21,000 m
Slice 39 - Y-Axis slice at -20,500 m
Slice 40 - Y-Axis slice at -20,000 m
Slice 41 - Y-Axis slice at -19,500 m
Slice 42 - Y-Axis slice at -19,000 m
Slice 43 - Y-Axis slice at -18,500 m
Slice 44 - Y-Axis slice at -18,000 m
GIF graphic images are stored in the 3dgifns (3-D north-south-oriented GIF files) directory. GIF and TARGA files located in folders are named and numbered such that external viewers can correctly sequence files. Images can be displayed as slide shows using an external viewer, such as JPEGView or LView, or can be accessed as the nsporvf.MOV (north-south vertical porosity slices, single forked) stand-alone movie in the movies folder. Movies are called up much quicker directly from the folder than using the below text hook, although the animation speed is similar.
Technical information on data sources and methodologies is stored in techinfo.htm. Access and start the movie with north-south movie (nsporvf.MOV). Before the movies can be opened, you may need to copy to your hard drive a movie-viewing program; information on how to acquire this freeware and software is listed in the readme for movies file.
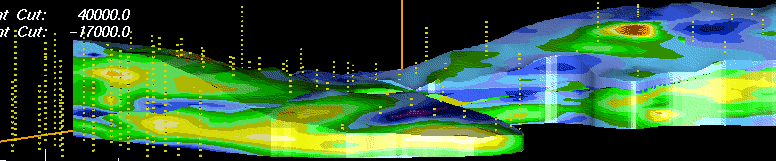
The above image is north-south-oriented vertical slice 7 of the Sussex "B" sandstone (slice 7 is located at X-axis location 40,000 m on the following index map). The 3-D model is rotated clockwise about 30 degrees. Yellow dots are borehole and sample locations. The below index plan-view map shows cumulative oil production. Also shown are location and orientation of the slice; these index maps are included on each image. Illustrated on the above map are:
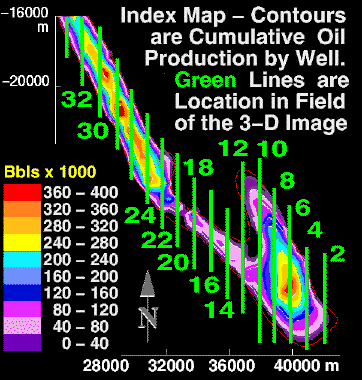
Slide show images north-south-oriented vertical slices are spaced at 500-m (1,524 ft) intervals; spacing is approximate on the above map. Explanation and index map are displayed on images. Color bars list porosity in increments of 1 percent and contours of 40 MBO per well; a barrel of oil is equivalent to 42 U.S. gallons (158.76 liters). Vertical exaggeration of the 3-D porosity model is 60 times.
Image files are stored in the esid_gif (east side view of the field) directory. GIF images are named and numbered such that external viewers can correctly sequence files in the folders. Images can be displayed as slide shows using an external viewer, such as JPEGView or LView, or can be accessed as the volporf.MOV (volumetrics of porosity, single fork file format) stand-alone movie in the movies folder.
Before the movies can be opened, you may need to copy to your hard drive a movie-viewing program; information on how to acquire this freeware and software is listed in the readme for movies file. Due to differences in processing speeds we recommend accessing the standalone movie from the movies folder; however, it can generally be started by clicking 3-D distribution and volumes of porosity in 1 to 2 percent increments.
Stripping of layers of porosity in the below images reveals areal distribution, interbedding, and compartmentalization of individual sandstone beds within the Sussex "B" sandstone. Core and borehole porosity data are not smoothed by the gridding process; the wide-spaced X and Y grid spacing results in separate treatment of individual wells. The close-spaced Z grid of about 1-ft intervals displays variation in porosity over short vertical distances; this is particularly apparent in the northern half of the field area. Core porosity values change rapidly over short XYZ intervals when compared to well-log porosity data. This results from interbedding of thin porous sandstones with mudstones and calcite-cemented sandstones, and from smoothing of well-log porosity data due to logging procedures and equipment.
Explanations are included on images; color bars represent porosity distribution in increments of 1 percent. Yellow dots are core and borehole sample location in 3-D space. Vertical exaggeration of the 3-D porosity model is 80 times.
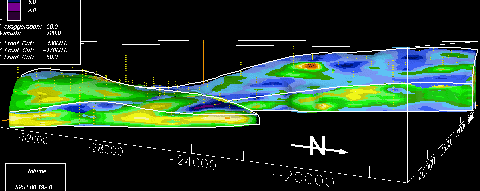
Small-scale 3-D view toward the eastern field boundary shows volume and layers of porosity . Minimum reservoir, and average Sussex "B" sandstone porosity is 8.5 percent (green); average porosity of reservoir intervals is about 13 percent (yellow).
1) 1 to 21 percent porosity - 525.5 million cubic meters. This is the total volume of the reservoir area.
2) 3 to 21 percent porosity - 524.6 million cubic meters
3) 5 to 21 percent porosity - 502.5 million cubic meters
4) 6 to 21 percent porosity - 465.4 million cubic meters
5) 7 to 21 percent porosity - 415.6 million cubic meters
6) 8 to 21 percent porosity - 358.6 million cubic meters. Minimum reservoir porosity is about 8.5 percent. Eight percent porosity and greater comprises approximately 70 percent of the volume of the Sussex "B" sandstone.
7) 9 to 21 percent porosity - 303.9 million cubic meters
8) 10 to 21 percent porosity - 241.3 million cubic meters
9) 11 to 21 percent porosity - 180.5 million cubic meters; or about 35 percent of the field area.
10) 12 to 21 percent porosity - 115.9 million cubic meters; reservoir average porosity is about 12.5 percent. Less than 25 percent of the field volume is 12 percent porosity and greater.
11) 13 to 21 percent porosity - 62.2 million cubic meters; 13 percent and greater is less than 15 percent of the field volume.
12) 14 to 21 percent porosity - 25.9 million cubic meters
13) 15 to 21 percent porosity - 6.6 million cubic meters
Table of contents | Glossary | Geology | Depositional model | Heterogeneity | Diagenetic history | Petroleum geology | 1) East-West porosity slices | 2) North-South porosity slices | 3) Onion views of 3-D images | Horizontal slices of porosity | 5) Horizontal and East-West permeability and porosity slices
GIF files are stored in the hslice (horizontal slice) directory and can be displayed as slides using an external viewer, such as JPEGView or LView. GIF files are named and numbered such that external viewers can correctly sequence files in the folders.
Images are animated by the hporosf.MOV stand-alone movie located in the movies folder. Movies are called up much quicker directly from the folder than from the following text hook, although the animation speed of 1 frame/second is analogous. Technical information on the movies, data sources, and research methodology is located in techinfo.htm.
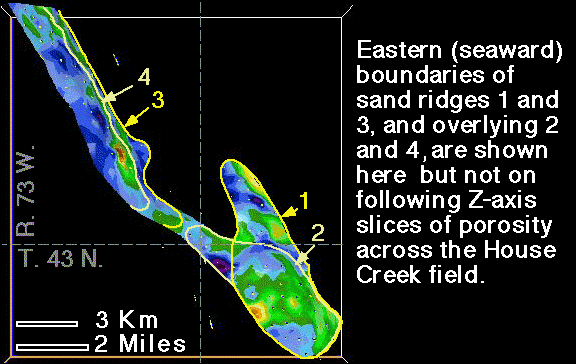
Top view of field area; north is top of map. Access the movie by clicking Plan-view distribution of porosity (hporosf.MOV). Before the movies can be opened you may need to copy to your hard drive a movie-viewing program; information on how to acquire this freeware and software is listed in the readme for movies file. Due to differences in processing speeds we recommend accessing the stand-alone movie from the movies folder.
1) 60 ft - hslic10a.gif - The upper disconformity surface of the Sussex "B" sandstone
2) Basal view of field - hslic10k.gif - Porosity distribution on the basal disconformity surface (basal sand ridges 1 and 3) of the Sussex "B" sandstone
3) 1.4 ft above disconformity - hslic10l.gif Patches of reservoir-grade (green through red) porosity are present, mainly along seaward (eastern and southeastern) margins of sand ridges
4) 2.9 ft - hslic10m.gif - Patches begin to coalesce
5) 4.3 ft - hslic10n.gif - Region of reservoir-grade porosity increases in area, although it is still concentrated along the seaward margin of the earliest-deposited sand ridge (number 1), located in the southeastern half of the field.
6) 5.7 ft - hslic10o.gif - Areas of reservoir-grade porosity (8 percent and greater) transgress to the southwest, parallel to field and sand-ridge boundaries.
7) 7.1 ft - hslic10p.gif - This and the following images show areal distribution of porosity at each Z-axis increment. Included are 1) the continued transgressive deposition of sand ridges, as shown by porosity distribution, 2) limited distribution of high porosity intervals (12 percent and greater), and 3) compartmentalization of sand ridges resulting from deposition of low-porosity intervals of overlying sand ridges.
25) 32.9 ft - hslic18.gif - This marks the upper surface of sand ridges 1 and 2, in the southeastern half of the field area.
30) 40.0 ft - hslic23.gif - This marks the approximate upper limit of reservoir-grade sandstones of the uppermost sand ridge.
32) 42.9 ft - hslic25.gif - The small area of reservoir-grade porosity in the northwestern tip of the field area may represent the eastern border of a new sand ridge, based also on examination and mapping of geophysical borehole logs. Thickness and areal distribution of this sandstone bed are not documented due to limited drilling west of the field.
The two sets of image files included in this section are named:
The following two sets of GIF file lists are stored in the 3dvk (3-D vertical slices of permeability) and hporper (horizontal slices of porosity and permeability) directories. GIF files are named and numbered such that external viewers can correctly sequence files in the folders. Images can be displayed as slide shows using an external viewer, such as JPEGView or LView, or can be accessed as movies; links follow the below figures.
Before the movies can be opened, you may need to copy to your hard drive a movie-viewing program; information on how to acquire this freeware and software is listed in the readme for movies file. Due to differences in processing speeds we recommend accessing the stand-alone movie from the movies folder.
3-D permeability images are "smoother" than the 3-D porosity models due to fewer data points; core permeability and porosity data from 10 boreholes are augmented by well-log porosity data from an additional 110 boreholes.
North-South-Oriented Vertical Slices are spaced at 500-m (1,524 ft) intervals and numbered from south to north. Plan-view images are numbered in 1-ft (0.3 m) increments from the basal disconformity datum. Explanation and index map are shown on most images. Each slice has two color bars. They are 1) variation in permeability in millidarcies (mD), and 2) porosity in 1-percent increments. Vertical exaggeration of the 3-D models is listed on images. Yellow dots are sample locations in boreholes.
Most vertical slices show two sand ridges separated by zones of lower porosity and permeability. Horizontal slices illustrate;
1) the highly variable distribution of porosity and permeability in three dimensions,
2) concentration of lowest porosity/permeability zones proximal to the basal disconformity and the western field margins,
3) general upward and seaward increase in porosity and permeability within individual sand ridges, with
4) stacking of greatest porosity/permeability along field axes that resulted from transgressive deposition (westward) of later sand ridges.
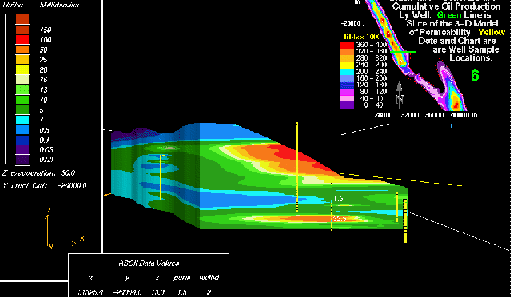
Small-scale example of an east-west-oriented vertical slice of permeability across the field. The movie shows east-west vertical slices of permeability distribution. ewpermvf.MOV
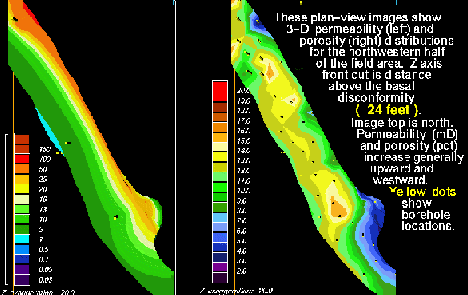
Small-scale plan-view images of permeability and porosity across the northwestern half of the field area. The movie shows plan-view distribution of permeability and porosity. hporperf.MOV .
Slice 2) Y Axis at -26,000 m - permv12.gif
Slice 3) Y Axis at -25,500 m - permv13.gif
Slice 4) Y Axis at -25,000 m - permv14.gif
Slice 5) Y Axis at -24,500 m - permv15.gif
Slice 6) Y Axis at -24,000 m - permv16.gif
Slice 7) Y Axis at -23,500 m - permv17.gif
Slice 8) Y Axis at -23,000 m - permv18.gif
Slice 9) Y Axis at -22,500 m - permv19.gif
Slice 10) Y Axis at -22,000 m - permv20.gif
Slice 11) Y Axis at -21,500 m - permv21.gif
Slice 12) Y Axis at -21,000 m - permv22.gif
Slice 13) Y Axis at -20,500 m - permv23.gif
Slice 14) Y Axis at -20,000 m - permv24.gif
Slice 15) Y Axis at -19,500 m - permv25.gif
Slice 16) Y Axis at -19,000 m - permv26.gif
Slice 17) Y Axis at -18,500 m - permv27.gif
Slice 18) Y Axis at -18,000 m - permv28.gif
Slice 19) Y Axis at -17,500 m - permv29.gif
. 2) 1 ft above basal disconformity - porper12.gif
. 3) 2 ft above basal disconformity - porper13.gif
. 4) 3 ft above basal disconformity - porper14.gif
. 5) 4 ft above basal disconformity - porper15.gif
. 6) 5 ft above basal disconformity - porper16.gif
. 7) 6 ft above basal disconformity - porper17.gif
. 8) 7 ft above basal disconformity - porper18.gif
. 9) 8 ft above basal disconformity - porper19.gif
10) 9 ft above basal disconformity - porper20.gif
11) 10 ft above basal disconformity - porper21.gif
12) 11 ft above basal disconformity - porper22.gif
13) 12 ft above basal disconformity - porper23.gif
14) 13 ft above basal disconformity - porper24.gif
15) 14 ft above basal disconformity - porper25.gif
16) 15 ft above basal disconformity - porper26.gif
17) 16 ft above basal disconformity - porper27.gif
18) 17 ft above basal disconformity - porper28.gif
19) 18 ft above basal disconformity - porper29.gif
20) 19 ft above basal disconformity - porper30.gif
21) 20 ft above basal disconformity - porper31.gif
22) 21 ft above basal disconformity - porper32.gif
23) 22 ft above basal disconformity - porper33.gif
24) 23 ft above basal disconformity - porper34.gif
25) 24 ft above basal disconformity - porper35.gif
26) 25 ft above basal disconformity - porper36.gif
27) 26 ft above basal disconformity - porper37.gif
28) 27 ft above basal disconformity - porper38.gif
29) 28 ft above basal disconformity - porper39.gif
30) 29 ft above basal disconformity - porper40.gif
31) 30 ft above basal disconformity - porper41.gif
32) 31 ft above basal disconformity - porper42.gif
33) 32 ft above basal disconformity - porper43.gif
34) 33 ft above basal disconformity - porper44.gif
35) 34 ft above basal disconformity - porper45.gif
36) 35 ft above basal disconformity - porper46.gif
37) 36 ft above basal disconformity - porper47.gif
38) 37 ft above basal disconformity - porper48.gif
39) 38 ft above basal disconformity - porper49.gif
40) 39 ft above basal disconformity - porper50.gif
41) 40 ft above basal disconformity - porper51.gif
42) 41 ft above basal disconformity - porper52.gif
43) 42 ft above basal disconformity - porper53.gif
44) 43 ft above basal disconformity - porper54.gif
45) 44 ft above basal disconformity - porper55.gif
46) 45 ft above basal disconformity - porper56.gif
47) 46 ft above basal disconformity - porper57.gif
48) 47 ft above basal disconformity - porper58.gif
49) 48 ft above basal disconformity - porper59.gif
50) 49 ft above basal disconformity - porper60.gif
51) 50 ft above basal disconformity - porper61.gif
52) 51 ft above basal disconformity - porper62.gif
53) 52 ft above basal disconformity - porper63.gif
54) 53 ft above basal disconformity - porper64.gif
Aigner, T., and Reineck, H.E., 1982, Proximity trends in modern storm sands from the Helgoland Bight (North Sea) and their implications for basin analysis: Senckenberg. Marit., v. 14, p. 183-215.
Allen, P.A., and Homewood, P., 1984, Evolution and mechanics of a Miocene tidal sandwave: Sedimentology, v. 31, p. 63-81.
Anderman, G.G., 1976, Sussex sandstone production, Triangle U field, Campbell County, Wyoming: Wyoming Geological Association, 28th Annual Field Conference Guidebook, p. 107-113.
Arnott, R.W.C., 1991, The Carrot Creek "K" pool, Cardium Formation, Alberta: a conglomeratic reservoir related to a wave-reworked distributary mouth-bar complex: Bulletin of Canadian Petroleum Geology, v. 39, no. 1, p. 43-53.
Asquith, D.O., 1970, Depositional topography and major marine environments, Late Cretaceous, Wyoming: American Association of Petroleum Geologists Bulletin, v. 54, no. 7, p. 1184-1224.
Barker, C.E., and Kopp, O.C., eds., 1991, Luminescence microscopy and spectroscopy: qualitative and quantitative applications: Society of Economic Paleontologists and Mineralogists Short Course 25, 195 p., 16 papers.
Barnaby, R.J., and Rimstidt, J.D., 1989, Redox conditions of calcite cementation interpreted from Mn and Fe contents of authigenic calcites: Geological Society of America Bulletin, v. 101, p. 795-804.
Bauder, J.M., 1981, House Creek, in Lawyer, G., Newcomer, J., and Eger, C., eds., Powder River Basin Oil and Gas Fields: Wyoming Geological Association, p. 203.
Beard, D.C., and Weyl, P.K., 1973, Influence of texture on porosity and permeability of unconsolidated sand: American Association of Petroleum Geologists Bulletin, v. 57, no. 2, p. 349-369.
Beaumont, E.A., Hobson, J.P., Jr., and Fowler, M.L., 1980, Depositional facies, geometry, and genesis of Upper Cretaceous mid-shelf sandstone, Sussex Sandstone at House Creek Field, Powder River Basin, Wyoming: American Association of Petroleum Geologists Bulletin, v. 64, no. 5, p. 675.
Beaumont, E.A., 1984, Retrogradational shelf sedimentation Lower Cretaceous Viking Formation, central Alberta, in Tillman, R. W., and Siemers, C. T., eds., Siliciclastic Shelf Sediments: Society of Economic Paleontologists and Mineralogists Special Publication 34, p. 163-178.
Berg, R.L., 1975, Depositional environments of Upper Cretaceous Sussex Sandstone, House Creek field, Wyoming: American Association of Petroleum Geologists Bulletin, v. 59, no. 11, p. 2099-2110.
Bergman, K.M., and Walker, R.G., 1988, Formation of Cardium erosion surface E5, and associated deposition of conglomerate: Carrot Creek field, Cretaceous Western Interior seaway, Alberta, in James, D.P., and Leckie, D.A., eds., Sequences, Stratigraphy, Sedimentology: Surface and Subsurface: Canadian Society of Petroleum Geologists Memoir 15, p. 15-24.
Boreen, T., and Walker, R.G., 1991, Definition of allomembers and their facies assemblages in the Viking Formation, Willesen Green area, Alberta: Bulletin of Canadian Petroleum Geology, v. 39, no. 2, p. 123-144.
Borer, J.M., and Harris, P.M., 1991, Lithofacies and cyclicity of the Yates Formation, Permian Basin: Implications for reservoir heterogeneity: American Association of Petroleum Geologists Bulletin, v. 75, no. 4, p. 726-779.
Brenner, R.L., 1978, Sussex Sandstone of Wyoming-- example of Cretaceous offshore sedimentation: American Association of Petroleum Geologists Bulletin, v. 62, no. 2, p. 181-200.
___________ 1979, A sedimentologic analysis of the Sussex Sandstone, Powder River Basin, Wyoming: Earth Science Bulletin, v. 12, no. 2, p. 36-47.
Chamberlain, C.K., 1978, Recognition of trace fossils, in P.B. Basan, eds., Trace Fossil Concepts: Society of Economic Paleontologists and Mineralogists Short Course 5, p. 119-166.
Clayton, J.L., 1992, Role of microbial processes in petroleum systems, in L.B. Magoon, ed., The Petroleum System - Status of Research and Methods, 1992: U.S. Geological Survey Bulletin 2002, p. 16-19.
Coleman, J.M., and Roberts, H.H., 1991, Cyclic Sedimentation of the Northern Gulf of Mexico Shelf, in Armentrout, J.M., and Perkins, B.F., eds., Sequence Stratigraphy as an Exploration Tool- Concepts and Practices in the Gulf Coast: Society of Economic Paleontologists and Mineralogists, 11th Annual Field Conference, Gulf Coast Section, p. 113-134.
Crews, G. C., Barlow, J. A., Jr., and Haun, J. D., 1976, Upper Cretaceous Gammon, Shannon, and Sussex Sandstone, central Powder River Basin, Wyoming, in Laudon, R. B., Curry III, W. H., and Runge, J. S., eds., Geology and Energy Resources of the Powder River Basin: Wyoming Geological Association 28th annual field conference guidebook, p. 9-20.
Curray, J.R., 1964, Transgressions and regressions, in Miller, R.C., ed., Papers in Marine Geology, Shepard Commemorative Volume: New York, Macmillan, p. 175-203.
Curry, W.H., 1971, Laramide structural history of the Powder River Basin, Wyoming, in Renfro, A. R., Madison, L.V., and Jarre, G.A., eds., Wyoming Tectonics and their Economic Significance: Wyoming Geological Association, Twenty-third Annual Field Conference Guidebook, p. 49-60.
Curtis, C.D., Coleman, M.L., and Love, L.G., 1986, Pore water evolution during sediment burial from isotopic and mineral chemistry of calcite, dolomite, and siderite concretions: Geochimica et Cosmochimica Acta, v. 50, p. 2321-2334.
Dapples, E.C., 1971, Physical classification of carbonate cement in quartzose sandstones: Journal of Sedimentary Petrology, v. 41, p. 196-204.
Denson, N.M., Dover, J.H., and Osmonson, L.M., 1980, Structure contour and isopach maps of the Wyodak-Anderson Coal Bed in the Reno-Junction - Antelope Creek Area, Campbell and Converse Counties, Wyoming: U.S. Geological Survey Miscellaneous Investigations Series, Map I-1194.
Ebanks, W.J., Jr., 1987a. Flow unit concept - integrated approach to reservoir description for engineering projects (abs.): American Association of Petroleum Geologists 1987 Annual Meeting, Los Angeles, CA.
__________ 1987b. Geology in enhanced oil recovery; in Tillman, R.W. and Weber, K.J. eds., Reservoir Sedimentology: Society of Economic Paleontologists and Mineralogists Special Publication no. 40, Tulsa, OK., p. 1-14.
Folk, R.L., 1970, Detrital sedimentary rock classification and nomenclature for use in New Zealand: New Zealand Journal of Geology and Geophysics, v. 13, p. 937-968.
Fouch, T.D., 1983, Patterns of synorogenic sedimentation in Upper Cretaceous rocks of central and northeastern Utah, in Reynolds, M. and Dolly, E. eds., Mesozoic Paleogeography of West-Central United States: Society of Economic Paleontologists and Mineralogists, Rocky Mountain Section Special Publication, p. 305-336.
Fuchtbauer, H., 1983, Facies control on sandstone diagenesis, in Parder and Selwood, eds., Sandstone Diagenesis: Reider Publishing, p. 269-288.
Gaynor, G.C., 1991, Sedimentological studies of the Campanian Lower Mesaverde Formation and Shannon Sandstone Member of the Cody Shale, Bighorn and Powder River Basins, Wyoming: Ph.D.. Dissertation, University of Texas at Dallas, 451 p.
Gaynor, G.C., and Swift, D.J.P., 1988, Shannon Sandstone depositional model: sand ridge dynamics on the Campanian western interior shelf: Journal of Sedimentary Petrology, v. 58, p. 868-880.
Gill, J.R., and Cobban, W.A., 1966, Regional unconformity in Late Cretaceous, Wyoming: U.S. Geological Survey Professional Paper 550-B, p. B20-B27.
__________ 1973, Stratigraphy and geologic history of the Montana Group and equivalent rocks, Montana, Wyoming, and North and South Dakota: U.S. Geological Survey Professional Paper 776, 37 p.
Gosnold, W.D., Jr., 1985, Heat flow and ground water flow in the Great Plains of the United States: Journal of Geodynamics, v. 4, p. 247-264.
Hansley, P.L., and Nuccio, V.F., 1992, Upper Cretaceous Shannon Sandstone reservoirs, Powder River Basin, Wyoming: Evidence for organic acid diagenesis: American Association of Petroleum Geologists Bulletin, v. 76, no. 6, p. 781-791.
Hansley, P.L., and Whitney, C.G., 1990, Petrology, diagenesis, and sedimentology of oil reservoirs in Upper Cretaceous Shannon Sandstone beds, Powder River Basin, Wyoming: U.S. Geological Survey Bulletin 1917-C, 33 p.
Hart, B.S., Longstaffe, F.J., and Plint, A.G., 1992, Evidence for relative sea level change from isotopic and elemental composition of siderite in the Cardium Formation, Rocky Mountain Foothills: Bulletin of Canadian Petroleum Geology, v. 40, no. 1, p. 52-59.
Hart, B.S., and Plint, A.G., 1994, Tectonic influence on deposition and erosion in a ramp setting: Upper Cretaceous Cardium Formation, Alberta Foreland Basin: American Association of Petroleum Geologists Bulletin, v. 77, no. 12, p. 2092-2107.
Hearn, C.L. Ebanks, W.J., Jr., Tye, R.S., and Ragnanathan, V., 1983, Geological factors influencing reservoir performance of the Hartzog Draw field, Wyoming: Journal of Society of Petroleum Engineers, v. 36, p. 1335-1344.
Hearn, C.L., Hobson, J.P., and Fowler, M.L., 1986, Reservoir characterization for simulation, Hartzog Draw field, Wyoming, in Lake, L.W. and Carroll, H.B., eds., Reservoir Characterization: New York, Academic Press, p. 341-371.
Hewett, T.A., 1986, Porosity and mineral alteration by fluid flow through a temperature field, in Lake, L.W. and Carroll, H.B., eds., Reservoir Characterization: New York, Academic Press, p. 83-140.
Higley, D.K., 1988, Detailed descriptions of the Upper Cretaceous Sussex Sandstone in five coreholes, Powder River basin, Wyoming: U.S. Geological Survey Open-File Report 88-420, 32 p.
_________ 1992, Petrology and reservoir paragenesis in the Sussex "B" sandstone of the Upper Cretaceous Cody Shale, House Creek and Porcupine fields, Powder River Basin, Wyoming: U.S. Geological Survey Bulletin 1917-G, 16 p.
_________ 1994, Three-dimensional flow-unit characterization of a transgressive marine sand-ridge complex, Upper Cretaceous Sussex "B" sandstone, House Creek oil field, Wyoming: unpub, Ph.D. dissertation, Colorado School of Mines, Golden, 374 p., 12 plates, 1 diskette.
Higley, D.K., and Schmoker, J.W., 1989, Influence of depositional environment and diagenesis on regional porosity trends in the Lower Cretaceous "J" Sandstone, Denver Basin, Colorado, in Coalson, E.B., Kaplan, S.S., Keighin, C.W., Oglesby, C.A., and Robinson, J.W., eds., Petrogenesis and Petrophysics of Selected Sandstone Reservoirs of the Rocky Mountain Region: Rocky Mountain Association of Geologists Special Publication, p. 183-196.
Hobson, J.P., Jr., Fowler, M.L., and Beaumont, E.A., 1982, Depositional and statistical exploration models, Upper Cretaceous offshore sandstone complex, Sussex Member, House Creek field, Wyoming: American Association of Petroleum Geologists Bulletin, v. 66, no. 6, p. 689-707.
Horner, D.R., 1951, Pressure build-up in wells: Proceedings Third World Petroleum Congress, Section 2, The Hague. Reprinted in Society of Petroleum Engineers Reprint Series no. 9, 1967, p. 25-43.
Hunt, J., 1979, Petroleum geochemistry and geology: W.H Freeman, San Francisco, CA, 617 p.
Huthnance, J.M., 1982, On one mechanism forming linear sand banks: Estuarine, Coastal, and Shelf Science, v. 14, p. 79-99.
Ireland, B.J. Curtis, C.D., and Whiteman, J.A., 1983, Compositional variation within some glauconites and illites and implications for their stability and origins: Sedimentology, v. 30, p. 769-786.
Isbell, E. B., Spencer, C. W., and Seitz, T., 1976, Petroleum geology of the well draw field, Converse County, Wyoming, in Laudon, R. B., Curry III, W. H., and Runge, J. S., eds., Geology and Energy Resources of the Powder River Basin: Wyoming Geological Association 28th Annual Field Conference Guidebook, p. 165-174.
Kastner, M., and Siever, R., 1979, Low temperature feldspars in sedimentary rocks: American Journal of Science, v. 279, p. 435-479.
Kauffman, E.G., 1977, Geological and biological overview: Western Interior Cretaceous Basin, in Kauffman, E.G., ed., Cretaceous Facies, Faunas, and Paleoenvironments Across the Western Interior Basin: Mountain Geologist, v. 14, p. 75-94.
Kitely, L., and Field, M., 1984, Shallow marine depositional environments in the Upper Cretaceous of Northern Colorado, in Tillman, R.W., and Siemers, C.T., eds., Siliciclastic Shelf Sediments: Society of Economic Paleontologists and Mineralogists Special Publication 34, p. 179-204.
Lavelle, J.W., Young, R.A., Swift, D.J.P., and Clarke, T.L., 1978, Near bottom sediment concentration and fluid velocity measurements on the inner continental shelf, New York: Journal of Geophysical Research, v. 83, p. 6052-6062.
Lawyer, G., Newcomer, J., and Eger, C., eds., 1981, Powder River Basin oil and gas fields: Wyoming Geological Association, 472 p.
Lillegraven, J.A., and Ostresh, L.M., Jr., 1990, Late Cretaceous (earliest Campanian/ Maastrichtian) evolution of western shorelines of the North American Western Interior seaway in relation to known mammalian faunas, in Bown, T.M., and Rose, K.D., eds., Dawn of the Age of Mammals in the Northern Part of the Rocky Mountain Interior, North America: Geological Society of America Special Paper 243, p. 1-30.
Longstaffe, F.J. 1984, Diagenesis 4, stable isotope studies of diagenesis in clastic rocks: Geoscience Canada, v. 10, no. 2., p. 43-58.
Loucks, R.G., Dodge, M.M., and Galloway, W.E., 1984, Regional controls on diagenesis and reservoir quality in Lower Tertiary sandstones along the Texas Gulf Coast: in McDonald, D.A., and Surdam, R.C., eds., Clastic Diagenesis: American Association of Petroleum Geologists Memoir 37, p. 15-46.
Loutit, T.S., Hardenbol, J., Vail, P.R., and Baum, G.R., 1988, Condensed sections: the key to age determination and correlation of continental margin sequences, in Wilgus, C.K., Hastings, B.S., Posamentier, H., Van Wagoner, J., Ross, C.A., and Kendall, C.G.St.C., eds., Sea-Level Changes: An Integrated Approach: Society of Economic Paleontologists and Mineralogists Special Publication no. 42, Tulsa, OK., p. 183-213.
Lundegard, P.D., and Land, L.S., 1989, Carbonate equilibria and pH buffering by organic acids-- response to changes in PCO2: Chemical Geology, v. 74, p. 277-287.
Lyle, D., 1992, Kerr-McGee launches talent at House Creek flood: Western Oil World, v. 49, p. 25-26.
MacEachern, J.A., and Pemberton, S.G., 1992, Ichnological aspects of Cretaceous shoreface successions and shoreface variability in the Western Interior seaway of North America, in Pemberton, S.G., ed., Applications of Ichnology to Petroleum Exploration: Society of Economic Paleontologists and Mineralogists Core Workshop 17, p. 57-84.
MacGowan, D.B., and Surdam, R.C., 1988, Difunctional organic acid anions in oil field waters: Organic Geochemistry, v. 12, no. 3, p. 245-259.
Machel, H.G., Mason, R.A., Mariano, A.N., and Mucci, A., 1991, Causes and measurements of luminescence in calcite and dolomite, in Barker, C.E., and Kopp, O.C., eds., Luminescence Microscopy and Spectroscopy: Qualitative and Quantitative Applications: Society of Economic Paleontologists and Mineralogists Short Course 25, p. 9-26.
Maughan, E. K., 1983, Tectonic setting of the Rocky Mountain region during the late Paleozoic and the early Mesozoic, in Proceedings of the Symposium on the Genesis of Rocky Mountain Ore Deposits: Changes with Time and Tectonics, p. 39-50.
Meisler, H., Leahy, P.P., and Knobel, L.L., 1985, Effect of eustatic sea-level changes on saltwater-freshwater in the Northern Atlantic Coastal Plain: U.S. Geological Survey Water-Supply Paper 2255, 28 p.
Merewether, E.A., and Claypool, G.E., 1980, Organic composition of some Upper Cretaceous shale, Powder River Basin, Wyoming: American Association of Petroleum Geologists Bulletin, v. 64, no. 4, p. 488-500.
Mitchum, R.M., Vail, P.R., and Thompson, S., 1977, Seismic stratigraphy and global changes of sea level, part 2: the depositional sequence as a basic unit for stratigraphic analysis, in Payton, C.E., ed., Seismic Stratigraphy- Applications to Hydrocarbon Exploration: American Association of Petroleum Geologists, Memoir 26, p. 53-62.
Momper, J.A., and Williams, J.A., 1984, Geochemical exploration in the Powder River Basin, in Demaison, G. and Morris, R. J., eds., Petroleum Geochemistry and Basin Evaluation: American Association of Petroleum Geologists, Memoir 35, p. 181-191.
Nelson, C.H., 1982, Modern shallow water graded sand layers from storm surges, Bering Shelf: a mimic of Bouma sequences and turbidite systems: Journal of Sedimentary Petrology, v. 5, p. 537-545.
Nio, S.P., Siegenthaler, C., and Yang, C.S., 1983, Megaripple cross-bedding as a tool for the reconstruction of the paleohydraulics in a Holocene subtidal environment, S.W. Netherlands: Geologie en Minjbouw, v. 36, p. 499-509.
Niodoroda, A.W., Swift, D.J.P., Figueiredo, A.G., Jr., and Freeland, G.L., 1985, Barrier island evolution, middle Atlantic Shelf, USA, Part II: evidence from the shelf floor: Marine Geology, v. 63, p. 363-396.
Nuccio, V.F., 1990, Burial, thermal, and petroleum generation history of the Upper Cretaceous Steele Member of the Cody Shale (Shannon Sandstone Bed horizon), Powder River Basin, Wyoming: U.S. Geological Survey Bulletin 1917-A, 17 p.
Nummedal, D., and Swift, D.J.P., 1987, Transgressive stratigraphy at sequence-bounding unconformities: some principles derived from Holocene and Cretaceous examples, in Nummedal, D., Pilkey, O.H., and Howard, J.D., eds., Sea-level Fluctuation and Coastal Evolution: Society of Economic Paleontologists and Mineralogists Special Publication no. 41, Tulsa, OK., p. 241-260.
Obradovitch, J.D., and Cobban, W.A., 1975, A time-scale for the Late Cretaceous of the Western Interior of North America, in Caldwell, W.G.E., ed., A Time-Scale for the Late Cretaceous of the Western Interior of North America: Geological Association of Canada Special Paper 13, Calgary, p. 31-54.
Odin, G.S., and Fullagar, P.D., 1988, Geologic significance of the glaucony facies, in Odin, G.S., ed., Green Marine Clays: Amsterdam, Elsevier, p. 295-332.
Odin, G.S. and Matter, A., 1981, De glauconarium origine: Sedimentology, v. 28, p. 611-641.
Petroleum Information Corp., Well History Control System database, available from Petroleum Information Corp., 4100 Dry Creek Road, Littleton, CO 80122.
_______________________ Production Data on CD-ROM, available from Petroleum Information Corp., 4100 Dry Creek Road, Littleton, CO 80122.
Pike, M.A., Kent, P., Husain, K. Kinnaman, D., and Menges, D.C., 1994, Using Mosaic: QUE Corporation, 390 p.
Pittman, E.D., 1988, Diagenesis of Terry Sandstone (Upper Cretaceous), Spindle Field, Colorado: Journal of Sedimentary Petrology, vol. 58, no. 5, p. 785-800.
Plint, A.G., 1988, Sharp-based shoreface sequences and "offshore bars" in the Cardium Formation of Alberta: their relationship to relative changes in sea level, in Wilgus, C.K., Hastings, B.S., Posamentier, H., Van Wagoner, J., Ross, C.A., and Kendall, C.G.St.C., eds., Sea-Level Changes: An Integrated Approach: Society of Economic Paleontologists and Mineralogists Special Publication no. 42, Tulsa, OK., p. 357-370.
Plint, A.G., Walker, R.G., and Duke, W.L., 1988, An outcrop to subsurface correlation of the Cardium Formation in Alberta: in James, D.P and Leckie, D.A., eds., Sequences, Stratigraphy, Sedimentology: Surface and Subsurface: Canadian Society of Petroleum Geologists Memoir 15, p. 167-184.
Pollastro, R.M., and Finn, T.M., 1990, Clay mineralogy and bulk rock composition of selected core and cutting samples from the Amoco Eisheid no. 1 well, Carrol County, Iowa -- A reconnaissance study from X-ray powder diffraction analysis: in Anderson, R.R., ed., The Amoco M.G. Eischeid no. 1 deep petroleum test, Carroll County, Iowa: Iowa Department of Natural Resources Special Report Series no. 2, p. 143-152.
Posamentier, H.W., and Allen, G.P., 1993, Variability in the sequence stratigraphic model: effects of local basin factors: Sedimentary Geology, v. 86, Elsevier, Amsterdam, p. 91-109.
Pryor, W.A., 1973, Permeability-porosity patterns and variations in some Holocene sand bodies: American Association of Petroleum Geologists Bulletin, v. 57, no. 1, p. 162-189.
Ranganathan, Vishnu, and Tye, R.S., 1986, Petrography, diagenesis, and facies controls on porosity in Shannon Sandstone, Hartzog Draw Field, Wyoming: American Association of Petroleum Geologists Bulletin, v. 70, no. 1, p. 56-69.
Rostron, B.J., and Toth, J., 1989, Computer simulation of potentiometric anomalies as an aid to exploration for lenticular reservoirs in developed basins: Geobyte, p. 39-45.
Sabel, J.M., 1985, House Creek field; past and future, in Nelson, G. E., ed., The Cretaceous Geology of Wyoming: Wyoming Geological Association, 36th Annual Field Conference Guidebook, p. 45-50.
Saigal, G.C., Morad, S., Bjorlykike, K., Egeberge, P.K., and Aagaard, P., 1988, Diagenetic albitization of detrital K-feldspar in Jurassic, Lower Cretaceous, and Tertiary clastic reservoir rocks from offshore Norway, I. Textures and origin: Journal of Sedimentary Petrology, v. 58, p. 1003-1013.
Schenk, C.J., 1988, Sandstone reservoirs, in Magoon, L.B., ed., Petroleum Systems of the United States: U.S. Geological Survey Bulletin 1870, p. 41-43.
__________ 1992, Facies, permeability, and heterogeneity in sandstone reservoirs, in Magoon, L.B., ed., The Petroleum System-Status of Research and Methods: U.S. Geological Survey Bulletin 2007, p. 35-39.
Schmidt, V., and McDonald, D. A., 1979, The role of secondary porosity in the course of sandstone diagenesis, in Scholle, P. A., and Schluger, P. R., eds., Aspects of Diagenesis: Society of Economic Paleontologists and Mineralogists Special Publication no. 26, p. 175-207.
Scholle, P.A., and Arthur, M.A., 1980, Carbon isotope fluctuations in Cretaceous pelagic limestones: potential stratigraphic and petroleum exploration tool: American Association of Petroleum Geologists Bulletin, v. 64, no. 1, p. 67-87.
Slack, P. B., 1981, Paleotectonics and hydrocarbon accumulation, Powder River Basin, Wyoming: American Association of Petroleum Geologists Bulletin, v. 65, no. 4, p. 730-743.
Slatt, R.M., 1984, Continental shelf topography: key to understanding the distribution of shelf sand ridge deposits from the Cretaceous Western Interior seaway: American Association of Petroleum Geologists Bulletin, v. 68, no. 9, p. 1107-1120.
Slatt, R.M., and Hopkins, G.L., 1990, Scaling geologic reservoir description to engineering needs: Journal of Petroleum Technology, p. 202-210.
Spearing, D.R., 1976, Upper Cretaceous Shannon Sandstone: An offshore, shallow marine sand body: Wyoming Geological Association Guidebook, 28th Annual Field Conference, p. 65-72.
Stanley, D.J., Swift, D.J.P., Silverberg, N., James, N.P., and Sutton, R.G., 1972, Late Quaternary progradation and sand spillover on the outer continental margin off Nova Scotia, southeast Canada: Smithsonian Contribution no. 8, Smithsonian Institution Press, 88 p.
Stonecipher, S.A., Winn, R.D., Jr., and Bishop, M.G., 1984, Diagenesis in the Frontier Formation, Moxa arch: a function of sandstone geometry, texture and composition, and fluid flux, in McDonald, D.A., and Surdam, R.C., eds., Clastic Diagenesis: American Association of Petroleum Geologists Memoir 37, p. 289-316.
Stubblefield, W.L., McGrail, D.W., Dersey, D.G., 1984, Recognition of transgressive and post-transgressive sand ridges on the New Jersey continental shelf, in Tillman, R.W., and Siemers, C.T., eds., Siliciclastic Shelf Sediments: Society of Economic Paleontologists and Mineralogists Special Publication 34, p. 1-23.
Surdam, R.C, Boese, S.W., and Crossey, L.J., 1984, The chemistry of secondary porosity, in MacDonald, D. A., and Surdam, R.C., eds., Clastic Diagenesis: American Association of Petroleum Geologists Memoir 37, p. 127-149.
Swift, D.J.P., 1968, Coastal erosion and transgressive stratigraphy: Journal of Geology, v. 76, p. 44-456.
__________ 1976, Coastal sedimentation, in Stanley, D.J., and Swift, D.J.P., eds., Marine Sediment Transport and Environmental Management: John Wiley and Sons, p. 255-310.
_________ 1985, Response of the shelf floor to flow, in Tillman, R.W., Swift, D.J.P., and Walker, R.G., eds., Shelf Sands and Sandstone Reservoirs: Tulsa, Society of Economic Paleontologists and Mineralogists Short Course Notes no. 13, p. 135-241.
Swift, D.J.P., Phillips, S., and Thorne, J.A., 1991, Sedimentation on continental margins, V: parasequences: in Swift, D.J.P., Oertel, G.F., Tillman, R.W., and Thorne, J.A., eds., Shelf Sand and Sandstone bodies, Geometry, Facies, and Sequence Stratigraphy: International Association of Sedimentologists Special Publication no. 14, p. 153-187.
Swift, D.J.P., and Rice, D.D., 1984, Sand bodies on muddy shelves- A model for sedimentation in the Western Interior seaway, North America, in Tillman, R.W., and Siemers, C.T., eds., Siliciclastic Shelf Sediments: Society of Economic Paleontologists Special Publication 34, p. 43-62.
Swift, D.J.P., and Thorne, J.A., 1991, Sedimentation on continental margins, I: a general model for shelf sedimentation: Special Publications, International Association of Sedimentologists, v. 14, p. 3-34.
Tillman, R.W., and Martinsen, R.S., 1984, The Shannon shelf-ridge sandstone complex, Salt Creek anticline area, Powder River Basin, Wyoming, in Tillman, R. W., and Siemers, C., eds., Siliciclastic Shelf Sedimentation: Society of Economic Paleontologists and Mineralogists Special Publication no. 34, p. 85-142.
_________ 1985, Shannon Sandstone, Hartzog Draw field core study, in Tillman, R.W., Swift, D.J.P., and Walker, R.G., eds., Shelf Sands and Sandstone Reservoirs: Society of Economic Paleontologists and Mineralogists Short Course Notes no. 13, p. 577-644
_________ 1987, Sedimentologic model and production characteristics of Hartzog Draw field, Wyoming, a Shannon shelf-ridge sandstone, in Tillman, R.W., and Siemers, C.T., eds., Siliciclastic Shelf Sediments: Society of Economic Paleontologists and Mineralogists Special Publication 34, p.85-142.
Tillman, R.W., Martinsen, R.M., Gaynor, N., and Swift, D.J.P., 1985, Shannon shelf-ridge sandstones field trip, in Tillman, R.W., Swift, D.J.P., and Walker, R.G., eds., Shelf Sands and Sandstone Reservoirs: Society of Economic Paleontologists and Mineralogists Short Course Notes no. 13, p. 683-708.
Tourtelot, H.A., 1962, Preliminary investigation of the geologic setting and chemical composition of the Pierre Shale, Great Plains region: U.S.Geological Survey Professional Paper 390, 74 p.
Tweto, Ogden, 1975, Laramide (Late Cretaceous-early Tertiary) orogeny in the southern Rocky Mountains, in Curtis, B.,ed., Cenozoic Geology of the Southern Rocky Mountains: Geological Society of America Memoir 144, p. 1-44.
________ 1980, Summary of the Laramide orogeny in Colorado, in Kent, H., and Porter, K., eds., Colorado geology: Rocky Mountain Association of Geologists, CO, p. 129-134.
Vail, P.R., Mitchum, R.M., Jr., and Thompson, S., III., 1977, Seismic stratigraphy and global changes of sea level, global cycles of relative sea level change, in Payton, C.E., ed., Seismic Stratigraphy--Applications to Hydrocarbon Exploration: American Association of Petroleum Geologists Memoir 26, p. 83-97.
Van Wagoner, J.C., Posamentier, H.W., Mitchum, R.M., Vail, P.R., Sarg, J.F., Loutit, T.S., and Hardenbol, J., 1988, An overview of the fundamentals of sequence stratigraphy and key definitions, in Wilgus, C.K., Hastines, B.S., Posamentier, H., and others, eds., Sea-Level Changes: An Integrated Approach: Society of Economic Paleontologists and Mineralogists Special Publication no. 42, p. 39-46.
Walker, R.G., 1985, Comparison of shelf environments and deep-basin turbidite systems, in Tillman, R.W., Swift, D.J.P., and Walker, R.G., eds., Shelf Sands and Sandstone Reservoirs: Society of Economic Paleontologists and Mineralogists Short Course Notes no. 13, p. 465-502.
Walker, R.G., and Bergman, K.M., 1993, Shannon Sandstone in Wyoming: a shelf-ridge complex reinterpreted as lowstand shoreface deposits: Journal of Sedimentary Petrology, v. 63, p. 839-851.
Walker, T.R., 1984, 1984 SEPM presidential address: diagenetic albitization of potassium feldspar in arkosic sandstones: Journal of Sedimentary Petrology, v. 54, p. 3-16.
Waples, D.W., 1985, Geochemistry in petroleum exploration: Boston, International Human Resources Development Corporation, 232 p.
Weber, K.J., 1986, How heterogeneity affects oil recovery, in Lake, L.W., and Carroll, Jr., H.B., eds., Reservoir Characterization: New York, Academic Press, p. 487-544.
Weimer, R.J., 1983, Relation of unconformities, tectonics, and sea level changes, Cretaceous of the Denver Basin and adjacent areas, in Reynolds, M.W., and Dolly, E.D., eds., Mesozoic Paleogeography of the West-Central United States: Society of Economic Paleontologists and Mineralogists, Rocky Mountain Paleogeography Symposium 2, p. 359-376.
_________ 1984, Relation of unconformities, tectonics, and sea-level changes, Cretaceous of Western Interior, USA, in Schlee, J. S., ed., Interregional Unconformities and Hydrocarbon Accumulations: American Association of Petroleum Geologists Memoir 36, p. 7-35.
________ 1992, Developments in sequence stratigraphy: foreland and cratonic basins: American Association of Petroleum Geologists Bulletin, v. 76, no. 5, p. 965-982.
Weimer, R. J., and Flexer, A., 1985, Depositional patterns and unconformities, Upper Cretaceous, eastern Powder River basin, Wyoming, in Nelson, G. E., ed., The Cretaceous Geology of Wyoming: Wyoming Geological Association 36th Annual Field Conference Guidebook, p. 131-147.
Wilson, T.V., and Sibley, D.F., 1978, Pressure solution and porosity reduction in shallow buried quartz arenite: American Association of Petroleum Geologists Bulletin, v. 62, no. 11, p. 2,329-2,334.
Witzke, B.J., Ludvigson, G.A., Poppe, J.R., and Ravn, R.L., 1983, Cretaceous paleogeography along the eastern margin of the Western Interior seaway, Iowa, southern Minnesota, and eastern Nebraska and North Dakota, in Reynolds, M.W., and Dolly, E.D., eds., Mesozoic Paleogeography of the West-Central United States: Society of Economic Paleontologists and Mineralogists, Rocky Mountain Paleogeography Symposium 2, p. 225-252.
Table of contents
This research was supported by the following U.S. Geological Survey projects; Enhanced Oil Recovery, Reservoir Characterization, Graduate Intern, and 3-D Reservoir/Basin Characterization for CD-ROM Publication. Many individuals and organizations contributed greatly to this publication. We wish to thank all of you for your technical advice, donation of time, data, and equipment, and for your assistance.
Woods Petroleum and Meridian Oil Corporations donated reservoir and core analysis data. We would like to thank Steve Fillingham, Dick Morrow, and Bill Walford of Woods Petroleum Corp., and William Brown and Oscar Peters of Meridian Oil for their assistance. Kerr-McGee Corporation scientist John Roffers added information on secondary recovery operations. U.S. Geological Survey geologists Mark Pawlewicz and Thomas Finn provided vitrinite reflectance and X-ray diffraction analyses, respectively.
We thank Ronald Charpentier, Ronald Johnson, Randy Schumann, Rick Scott, and Steve Sonnenberg for their reviews. Frederick (Nick) Zihlman and Randy Schumann, of the USGS, gave valuable advice on incorporation and use of WWW and other computer applications, and on producing CD ROMs. David K. Vaughan assisted in collecting porosity and permeability data and in constructing the 2-D and 3-D map models. Fran Gay did a superb job of scanning photographs and saving digital images.
Numerous individuals, software companies, AAPG, SEPM, and NCSA have allowed us to install their shareware, freeware, and postcardware computer programs on this CD-ROM. We would like to thank all of you. Highlighted links are GIF-format-scanned copies of license agreements and copyright releases. A list, in no particular order, of contributors and their software programs follows:
Thank you all for your contributions, /s/ Debra Higley <Higley@USGS.GOV;
INCLUDED IN THIS SECTION ARE THE FOLLOWING;
Sources of information include published reports, core and outcrop studies, geochemical analyses of crude oil and core samples, core analyses, petroleum reserve and production data, and well data. The Sussex Sandstone core used in this study is located at the U.S. Geological Survey (USGS) core library in Denver (Higley, 1988) and at the Colorado School of Mines in Golden, Colorado. Sources of field and well production data include Petroleum Information Corporation's (PI) production data on CD-ROM and Well History Control System databases; unless otherwise stated, data are current approximately through July 1993. Meridian Oil Company and Woods Petroleum Corporation provided core analysis and reservoir production and statistical data. Our geologic and geochemical analyses was augmented by other sources of information; these include Kerr-McGee Corp., Woods Petroleum Corp., Meridian Oil, Petroleum Information Corp., and State of Wyoming Oil and Gas Conservation Commission.
Microsoft Excel, DeltaGraph, and Canvas statistical and graphics programs on Macintosh computers were used to generate most of the charts and graphs used in figures. Statistical and graphical distributions of results from thin-section petrographic analyses and well-log and core-porosity and core-permeability data were calculated using Statistical Applications Software (SAS) on a VAX computer, and Microsoft Excel and DeltaGraph programs on Macintosh computers.
Generated maps primarily cover the southern two-thirds of the House Creek field, although geology, geochemistry, and petroleum potential of the entire field was researched. EarthVision (EV) version 2.02 program on an IRIS workstation was used to generate contour maps and the 3-D maps illustrating porosity and permeability distribution across the field. The mapping package is owned by Dynamic Graphics Corporation, Berkeley, Calif. The IRIS workstation had 32 MB of memory and operating system 5.3.
The 3-D maps of core and well-log porosity represent an area of 105.28 to 105.42 degrees longitude (X-axis grid dimensions of 25,000 to 43,000 m) and 43.4 to 43.5 degrees latitude (Y-axis grid dimensions of -16,000 to -35,000 m). Permeability data were derived from core analyses; data distribution are within about 105.5 to 105.6 degrees longitude (X-axis grid dimensions of 26,500 to 33,000 m) and 43.7 to 43.8 degrees latitude (Y-axis grid dimensions of -28,000 to -16,000 m). All data set references include only approximate X-Y coordinates; actual well locations are slightly different.
The porosity/permeability and other geologic data sets created for this study were gridded by the EarthVision mapping programs using a biharmonic cubic spline algorithm that distributes tension among the grid nodes. Contour curvature is distributed rather than concentrated at nodes. Generated isopach, structure, and other contour maps display this curvature, as opposed to jagged contour lines. Most maps use a closely spaced grid with one to a maximum of eight data points (wells) evaluated from each grid node; these parameters display anomalies and wide variations on the maps, as opposed to smoothing data. 3-D maps utilize single-data-point gridding to minimize extrapolation. Using these contour parameters, map features are sometimes exaggerated; this can result in mammiform (essentially bull's-eye) contours when adjacent or proximal wells have widely different data values.
Vertical slices through the field show dispersal of permeability and porosity; slices were chosen based on 3-D distribution of core data and well control. Most figures exhibit, and include, considerable Z-axis exaggeration; the purpose is to better show porosity and permeability distribution within the Sussex. Vertical exaggeration is listed on figures. The exaggeration results in a greatly increased upward and shoreward (westward) step in sand-ridge unit (sandstone bed) boundaries. Actual boundaries are at a much lower angle.
3-D models of porosity respective grid spacings were 100 by 100 cells (200 by 200 m), and 250 by 250 cells (85 by 85 m) in the X-Y (east-west, and north-south) directions, and 50 cells (1.5 ft) in the Z (depth) dimension; movie images were gridded using the closer (250 by 250) cell spacing so animations would flow better. Permeability was gridded using a 30 by 30 grid cells in the X-Y direction and 50 grid cells in the Z direction; the smaller X-Y grid spacing results from the smaller areal extent of this 3-D data. The Z spacing grid nodes represent increments of about 1.5 ft (0.5 m) for the interval from 10 ft (3.5 m) below the Sussex "B" base to 65 ft (20 m) above it. A closer grid was not practical because of the EV program parameters. The X-Y-Z grid parameters were chosen in order to treat porosity/depth values for each well separately. The purpose of this is to better see variation in porosity in 3-D space, and to evaluate the effects of lateral permeability boundaries on the distribution of porosity. These permeability boundaries are located between individual reservoir sand ridges. They also bound the Sussex "B" sandstone interval.
The *.RGB image files generated using EarthVision were converted on the IRIS workstation into *.GIF (Graphic Interchange Format) and *.TGA (TARGA) files. These graphics files were then downloaded onto Macintosh and PC computers. GraphicConverter version 2.1.3 shareware on a Macintosh was used to generate the movies. Each GIF file folder was opened using the "convert all," command located under the file menu banner. Next, "select folder" and "convert" were selected. Movies were saved using 640 X and 430 Y pixels (movie width and height) and 256 colors (8 bit). Selected compression settings were highest quality, and 1 frame per second display time (for most of the movies). Movies were opened using Apple Computer, Inc., MoviePlayer version 2.0b2 software and saved as single-forked stand-alones.
Outcrops of Sussex and Shannon Sandstones in the Salt Creek anticline area and Shannon Sandstone outcrops west of the anticline were examined and described. Due to the poor quality of Sussex outcrops, Shannon Sandstone outcrops were used as analogs to the Sussex and to depositional processes in the Cretaceous epicontinental seaway. Outcrops west of the Salt Creek anticline, just east of Shepperson Ranch, were also studied. The outcrops locations, shown with a blue rectangle on the following (indexfs3.gif) index map, are near Edgerton and Midwest, Wyoming, northeastern Natrona county in townships 39 and 40 north and ranges 78 through 80 west.
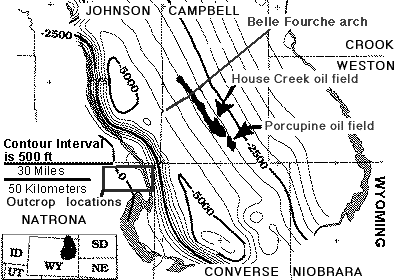
Figure 1. Structure contour map on the top of the Upper Cretaceous Sussex Sandstone Member of the Cody Shale, and approximate age equivalents, Powder River Basin, Wyoming and Montana. Location of the House Creek field is shown. Areal extent of the Sussex "B" sandstones is delineated by black-colored fields. Shaded fill outlining the basin are outcrops of Lance Formation and Fox Hills Sandstone. The rectangle located next to the 30-mile scale bar defines the area of studied outcrops of the Sussex and Shannon Members, much of the Salt Creek anticline, Shepparson Ranch, and the towns of Midwest and Edgerton. Contour interval is 500 ft. Datum is mean sea level.
The Sussex Sandstone outcrops northwest of Edgerton, Wyoming, and along the northeastern flank of the Salt Creek anticline. Largely because of Pleistocene and present-day erosion, the uppermost sandstones of the Sussex are commonly missing (Brenner, 1979). These missing intervals probably include the trough-cross-bedded sandstones that are the primary reservoir facies in the House Creek field. Exposed in outcrop are coarsening-upward sections of laminated mudstones to fine- to medium-grained sandstones. These thin-bedded sandstone facies have lower reservoir favorability.
Facies assignments were determined from outcrop and core studies and by correlation of lithologic data to geophysical well logs. Sussex "B" core from 20 wells were examined. Descriptions in Higley (1992, 1994) include sedimentary structures, changes in depositional energy, grain-size distributions, degree and types of biologic activity, trace-fossil assemblages, generalized amounts of calcite and quartz cements, and presence of clasts of chert, glauconite, and siderite.
Depths to the top and base of the Sussex "B" sandstone and of the sand ridges (sandstone bed) that comprise it were determined from outcrop, core, petrologic, geochemical, well-log, and published sources. Depths to the Ardmore bentonite, and to the top and base of the Sussex Sandstone Member and included Sussex "B" sandstone were picked from well-logs of more than 620 wells within, west of, and slightly east of the House Creek field. These depths were added to a digital data file that also included American Petroleum Institute (API) number, well name, operator name, well location, and well symbol (oil producing, dry hole, etc.), total drill depth, producing formation, and completion year. Also added to the well file were depths to boundaries of major Sussex "B" sandstone flow units, as determined for about 120 wells in the field (Higley, 1994). Flow units are strata that exhibit similar fluid-flow characteristics. Examples are thick, trough-cross-bedded, medium-grained sandstones, and low-porosity, non-oil-productive shales. Porosity, permeability, formation and sand ridge tops, and other data are explained in the dreadme.htm file for the three data sets located in the data_set folder. Included files are named ssxporos.dat, corepor.dat, and ssxtops.dat.
Cores from 10 wells located in and near the House Creek and Porcupine oil fields were sampled for petrographic analysis. Thin sections of 54 samples, X-ray diffraction (XRD) analyses, cathodoluminescence, and scanning electron microscope (SEM) studies were used to determine reservoir paragenesis, sandstone porosity, and mineralogical constituents of the Sussex "B" sandstone in the study area. Results of the petrographic analyses are presented in Higley (1992, 1994) and listed in table 2 (below).
Cathodoluminesence analysis was used to evaluate early diagenetic events not visible with standard petrographic procedures. Calcite-cemented sandstones and chert-pebble sandstones were sampled. Locations of calcite-cemented facies were chosen based on core and thin-section examination. Specially prepared 30-micrometer-thick thin sections for the cathodoluminesence studies were polished at low temperature and contain no epoxy or stains. We used a Technosyn Mark II cathodoluminescence stage with 10-15 Kv beam potential and 400-500 microampere beam current. The thin-section vacuum stage operated at range of 50-100 millitorr. Samples were viewed through a Nikon Optiphot microscope fitted with 8X oculars and a 4X (0.12 numbered aperture) objective.
Scanning electron microscope (SEM) examination of core samples determined mineralogical constituents, diagenetic history, shapes of pores, and petrologic characteristics of Sussex "B" sandstone, mudstone, and siderite core samples. SEM and other petrologic data are included in Higley (1992, 1994).
The Ardmore bentonite through Sussex "B" sandstone interval was correlated by linking well log traces for 120 wells. Traces include gamma, spontaneous potential (SP), resistivity, and bulk density. Steve Fillingham of Woods Petroleum Corp. (1985, personal communication), identified a 10 MV SP deflection to define the gross sandstone interval; this was also noted in this study as a boundary between reservoir-grade sandstone beds, and non-reservoir mudstones and cemented sandstones. This boundary is also characterized by a rapid decrease in core and well-log porosity. The boundary occurs at approximately 8.5 percent porosity, although this varies somewhat based on interbedding characteristics of mudstone/sandstone beds.
Sussex Sandstone core porosity and permeability data for as many as 30 wells in the area are included in the data_set porosity database and the 2-D and 3-D map images. Thirteen of these wells are within the field boundaries; well locations are shown below. Porosity values were calculated from bulk density well-log traces for approximately 100 wells. Sonic log traces were used for porosity calculations for a few wells.
Permeability baffles and barriers between stacked sandstones are characterized on well logs by sonic and bulk-density "spikes" of low porosity, variable gamma signatures that indicate shale breaks, and irregular spontaneous potential and resistivity traces that show stacked thin sandstones with intervening breaks. Limitations to the model include incomplete knowledge of reservoir heterogeneity, including information on fault and fracture systems, on continuity of small-scale permeability baffles such as shales and cemented sandstones, and permeability of porous facies and zones for which there are few core analogs.
Porosity was calibrated to a specific grain density of 2.68 g/cm3; this approximates average grain densities determined from the core analyses and estimated from thin-section examinations. Field outlines and sedimentologic boundaries were based on published information, well-log correlations, porosity and permeability profiles, oil-productive characteristics, location of sandstone and shale beds within the ridge system, and on core and outcrop studies.
Table 1 shows names and locations of cored wells that were used in thin-section petrographic and other studies; depth to the top of the Sussex "B" sandstone is also listed. Table 2 has volume percent of detrital grains, cements, and porosity for 55 thin sections of Sussex "B" sandstone core samples from 10 boreholes. Table 2 is also saved as the tab-delimited ssxtabl2.txt file because each web-browsing program displays (or dissects) tables differently. Porosity and mineralogical determinations were derived using approximately 300 point counts of each thin section. Thin sections were stained for calcite, potassium feldspar, plagioclase, and iron. Blue epoxy fills pore spaces. Minus-cement porosity (MCP) column includes volume percentages of chlorite, kaolinite, and pyrite, added to amounts of chert, quartz, calcite, dolomite, and feldspar cements. MCP is an estimate of porosity at the time of lithification. Photomicrographs for many thin sections are included in the geology text section of this publication.
Names and locations of wells in Campbell County, Wyoming, in which core was sampled for petrographic analysis of the Sussex "B" sandstone, Sussex Sandstone Member of the Upper Cretaceous Cody Shale. Locations are section, township, and range (glossary). An asterisk (*) marks the estimated core depth to the top of the Sussex "B" sandstone; other depths are actual core depths.
Well Name |
Location, |
Top Depth (ft.) |
|---|---|---|
14-9 Federal |
9, T. 42 N., R. 71 W. |
7,781 |
1 Campbell |
21, T. 42 N., R. 71 W. |
7,700 |
1 Govt. Miles "A" |
9, T. 44 N., R. 73 W. |
8,189 |
1 Mandel Federal |
22, T. 44 N., R. 73 W. |
8,166 |
1-23 House Creek Fed. |
23, T. 44 N., R. 73 W. |
8,238 |
1 Empire-Federal "C" |
29, T. 45 N., R. 73 W. |
8,006 |
32-1 Marquiss "B" |
32, T. 45 N., R. 73 W. |
7,980 |
1 House Creek Fed. |
13, T. 45 N., R. 74 W. |
8,175 |
1-11 Red Unit |
26, T. 48 N., R. 79 W. |
9,028* |
Ucross State |
11, T. 52 N., R. 81 W. |
8,233* |
Thin-section point-count data for Sussex "B" sandstone facies. Facies definitions use those of Tillman and Martinsen (1985). Data are average volume percentages for number (N) of thin-sections listed; Q, quartz grains; PQ, polycrystalline quartz; FSP, feldspar grains; RF, rock fragments; GL, glauconite; MM mudstone matrix; MC, clay matrix; MS, mudstone drapes; SID, siderite drapes; PY, pyrite; CHL, chlorite; QC, quartz cement; CT, chert cement; FSP, feldspar cement; CA, calcite cement; KA, kaolinite booklets; PO, porosity; MCP, minus-cement porosity. Sedimentary facies are listed under column name FACIE for the entire data set (ALL), upper chert-pebble lag sandstone (CTSS), central ridge sandstone (CRSS), high- and low-energy ridge-margin sandstones (HRMS, LRMS), wavy-bedded sandstone (WBSS), and inter-ridge sandstone (IRSS) and siltstone (IRST) (Higley, 1992, 1994).
FACIE  N     Q   PQ    FSP   RF   GL    MM    MC    MS   SID   PY    CHL    QC   CT    FSP   CA    KA    PO   MCP
--------------------------------------------------------------------------------------------------------------------
ALL.   54   31   2.9   6.3   13   5.1   3.0   5.9   1.8   0.9   0.6   0.9   7.7   2.1   1.5   11.   0.8   5.4   30
--------------------------------------------------------------------------------------------------------------------

CTSS   03   27   0.8   3.5   36   3.0   0.0   2.1   0.0   0.0   0.2   0.0   1.9   0.0   0.2   21.   0.0   1.6   25
CRSS 17 32 2.9 5.7 14 4.7 0.7 3.9 2.1 2.9 0.3 0.8 8.5 2.1 1.3 9.5 0.4 7.7 31
HRMS 08 30 2.7 7.1 11 5.5 2.8 3.8 1.2 0.1 1.3 1.3 8.5 2.2 1.6 14. 0.5 6.1 36
LRMS 03 27 3.1 8.5 12 6.7 1.4 7.6 1.2 0.8 1.0 1.1 11. 1.9 3.8 9.7 0.9 2.4 32
WBSS 06 32 2.1 6.9 10 6.9 3.2 5.1 0.0 0.0 0.4 1.8 7.9 2.2 2.2 12. 1.6 5.9 34
IRSS 10 31 2.8 7.4 11 5.5 3.3 7.2 3.2 0.2 0.7 0.7 8.3 2.2 1.5 8.5 1.3 5.4 29
IRST 07 33 2.3 5.3 10 3.4 10. 13. 3.3 0.2 0.6 0.6 4.5 2.6 0.7 6.8 0.6 2.1 19
Ssxtops.dat has formation-tops data by borehole. Format is space-delimited ASCII. Headings are not present in files; heading descriptions and column locations follow the below well listings. Three or more spaces separate each data element. Blanks are marked with an * . Each of the 525 boreholes has a listed township, range, and section (data is sorted relative to this location), and estimated distance in meters from the map origin; central meridian is 106 degrees east and latitude is 44 degrees north. All 2-D and 3-D map images are generated from this origin. Our well-log analysis was augmented by other sources of information; these include Kerr-McGee Corp., Woods Petroleum Corp., Meridian Oil, Petroleum Information Corp., and State of Wyoming Oil and Gas Conservation Commission.
This file was used to delineate sand-ridge and reservoir-grade-sandstone boundaries for isopach maps and 3-D images. Reservoir-grade sandstones are defined as greater than 8.5 percent porosity, in combination with greater than 8 millidarcies (mD) permeability, geophysical well-log signatures, core and thin-section data, and borehole production data. A 10 MV spontaneous potential (SP) well-log deflection bounds gross sandstone intervals. This zone is characterized by a rapid decrease in core and well-log porosity. The boundary occurs at approximately 8.5 percent porosity, although this varies.
API X Y TRS ELEV YR TD ARDEP SSXTP SSXBD SSXUT SSXUB SSXLT SSXLB SYMB NAME
API ( 1:10 ) American Petroleum Institute well identification number
X ( 15:19 ) Approximate distance in meters east of the map origin
Y ( 23:28 ) Approximate distance in meters north or south of the map origin
TRS   ( 32:39 ) Township direction (north or south) and number, range
                 direction (west or east) and number.  Alpha format
ELEV ( 43:46 ) Surface elevation of the borehole, in feet
YR ( 50:51 ) Well completion year
TD ( 55:59 ) Total drill depth from the surface, in feet
ARDEP ( 63:66) Depth (in ft) from the surface to the Ardmore bentonite
SSXTP  ( 70:73) Depth (in ft) from the surface to the disconformity between
                  the Sussex "B" sandstone and the overlying Cody Shale.
SSXBD  ( 77:80) Depth (in ft) from the surface to the basal disconformity
                  between the Sussex "B" sandstone and the Cody Shale.
SSXUT ( 84:87) Depth (in ft) from the surface to the top of the upper reservoir sandstones.
SSXUB  ( 91:94) Depth (in ft) from the surface to the base of the Sussex "B"
                   upper reservoir sandstones.
SSXLT  ( 98:101) Depth (in ft) from the surface to the top of the Sussex "B"
                   lower reservoir sandstones.
SSXLB  (105:108) Depth (in ft) from the surface to the base of the Sussex "B"
                   lower reservoir sandstones.
SYMB  (112:113) Well symbols of dry and non-productive (17), injection (15),
                   gas wells (20), oil (22), and oil and gas (29) wells
NAME (113:132) Well name - in mixed alpha and numeric characters
Ssxporos.dat contains core and well-log porosity, and core-permeability data by borehole for the Sussex "B" sandstone and bounding Cody Shale intervals. Format is space-delimited ASCII. Three or more spaces separate each data element. Heading descriptions and column locations follow the below data list. Blanks are marked with an *. Data are sorted relative to API number, which is also the primary link between data files. Within each borehole, data are sorted by sample depth.
This file contains the raw data used to generate 3-D porosity and permeability images. Core porosity and permeability values are listed for 13 wells within and proximal to the House Creek field. Well-log porosity data are derived from bulk-density and sonic-log traces for about 100 boreholes. Porosity was calibrated to a specific grain density of 2.68 g/cm3; this approximates average grain densities determined from the core analyses and estimated from thin-section examinations.
API X Y SBASDP SARDEP SAMPDP POR PERM
4900522703    31287    -24851      -1      -70      8212     5.65     *
    4900522703    31287    -24851      -1      -72      8214     5.71     *
    4900522717    31325    -24044      13      -52      8164     10.7    1.5
    4900522717    31325    -24044      12      -53      8165     7.8      0.75
    4900522717    31325    -24044      11      -54      8166     8.9      22.8
    4900522717    31325    -24044      10      -55      8167     9.9      0.62
    4900522717    31325    -24044        9      -56      8168     6.7      2.4
    4900522717    31325    -24044        8      -57      8169     7.1      0.97
    4900522717    31325    -24044        7      -58      8170     14.9    3.9
    4900522717    31325    -24044        6      -59      8171     15.2    48.2
API ( 1:10) American Petroleum Institute well identification number
X (14:18) Approximate distance in meters east of the map origin
Y (22:27) Approximate distance in meters north or south of the map origin
SBASDP (31:33)  Distance (in ft) of sample above the basal disconformity of
                            the Sussex "B" sandstone
SARDEP (37:41) Distance (in ft) of sample below the base of the Ardmore bentonite
SAMPDP (45:48) Depth (in ft) of the sample below ground surface
POR (52:55) Core or well-log porosity (in percent)
PERM (59:62) Core permeability (mD) for about 13 wells. An * indicates no data
The Corepor.dat file contains core porosity (volume %) and permeability (mD) measurement data (POR and PERM) of Sussex and Shannon Sandstone Members of the Cody Shale; data are listed by sample depth (DEPTH) in feet below ground surface, and borehole location. This file of data for 37 boreholes is included for archival purposes. Format is tab-delimited ASCII. The below heading is present at the top of this list but not on the archived file. API number and X-Y location are not included, however this information is located in the ssxtops.dat file and can be accessed by linking the township-range-section (TRS) values for both files.
WELL    WELL_LOC   DEPTH    PERM    POR     OIL    WATER      WELL_NAME
NUMBER    TRS        (FEET)     (MD)     (%)     (%)      (%)        AND LOCATION
12 N44W7323 8240 .09 5.40 * * NO. 1-23 FEDERAL
12 N44W7323 8241 1.6 10.0 * * FED2373
12 N44W7323 8242 7.2 16.0 * * SEC. 23, T. 44 N, R. 73 W
12 N44W7323 8243 19. 16.0 * *
12 N44W7323 8244 8.2 14.0 * *
12 N44W7323 8245 9.3 14.0 * *
12 N44W7323 8246 2.7 14.0 * *
12 N44W7323 8247 1.9 16.0 * *
13 N44W7309 8189 .23 6.4 0.0 65.7 NO.1 GOVERNMENT MILES
13 N44W7309 8190 .72 7.9 8.9 66.0 GOVT44
13 N44W7309 8191 22.7 15.0 17.8 26.8 SW NE SEC. 9, T. 44 N, R. 73 W
13 N44W7309 8192 38.6 12.0 12.3 30.3
13 N44W7309 8193 35.8 17.0 13.9 27.8
13 N44W7309 8194 73.5 15.0 17.6 30.5
This Compact Disc-read Only Memory (CD-ROM) publication was prepared by an agency of the United States Government. Neither the United States Government nor any agency thereof nor any of their employees make any warranty, expressed or implied, or assumes any legal liability or responsibility for the accuracy, completeness, or usefulness of any information, apparatus, product, or process disclosed in this report or represents that its use would not infringe on privately owned rights.
Reference therein to any specific commercial product, process, or service by trade name, trademark, manufacturer, or otherwise does not necessarily constitute or imply its endorsement, recommendation, or favoring by the United States Government or any agency thereof.
Although all data and software on this CD-ROM have been used by the USGS, no warranty, expressed or implied, is made by the USGS as to the accuracy of the data and related materials and (or) the functioning of the software. The act of distribution shall not constitute any such warranty, and no responsibility is assumed by the USGS in the use of these data, software, or related materials.
This 3-D Reservoir Characterization of the House Creek Oil Field, Powder River Basin, Wyoming, disc is one of a series of open-file and formal digital data releases using CD-ROM as the publication medium. By providing the information listed below, you will be assisting us at the U.S. Geological Survey in filling your data and research needs. The text-with-line-breaks format file is named useregis.txt. Listings of "New Publications of the U.S. Geological Survey" can currently be accessed through the following Web site https://pubs.usgs.gov/publications/ .
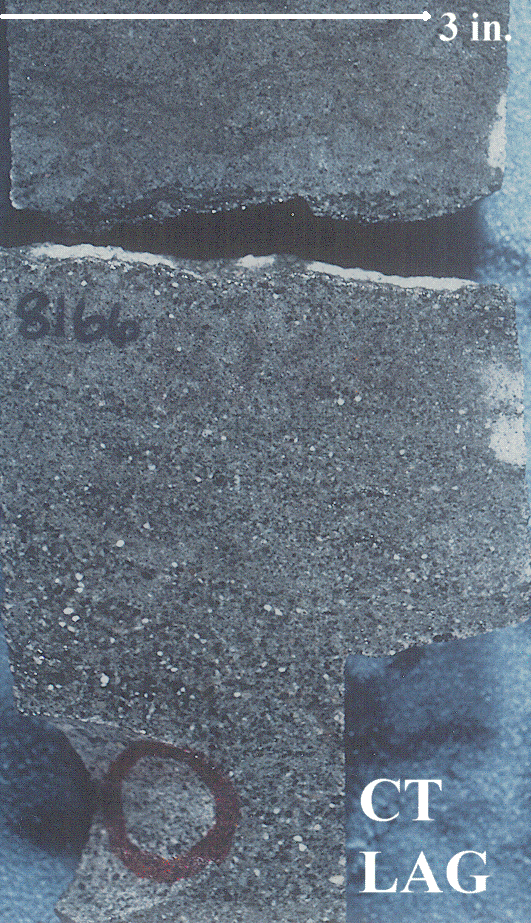
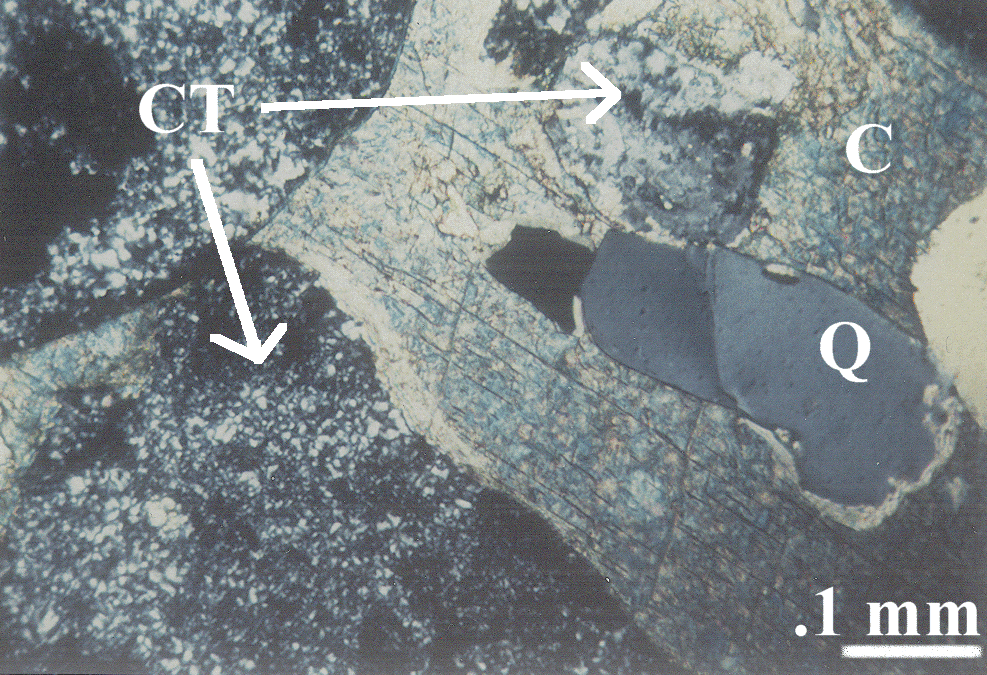
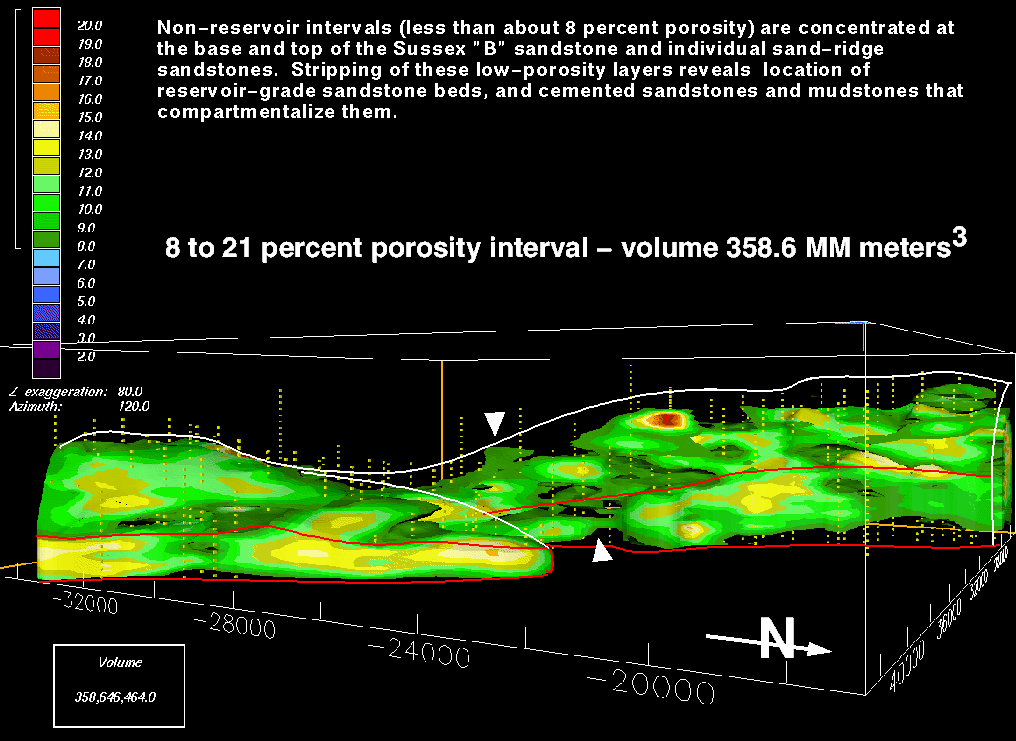
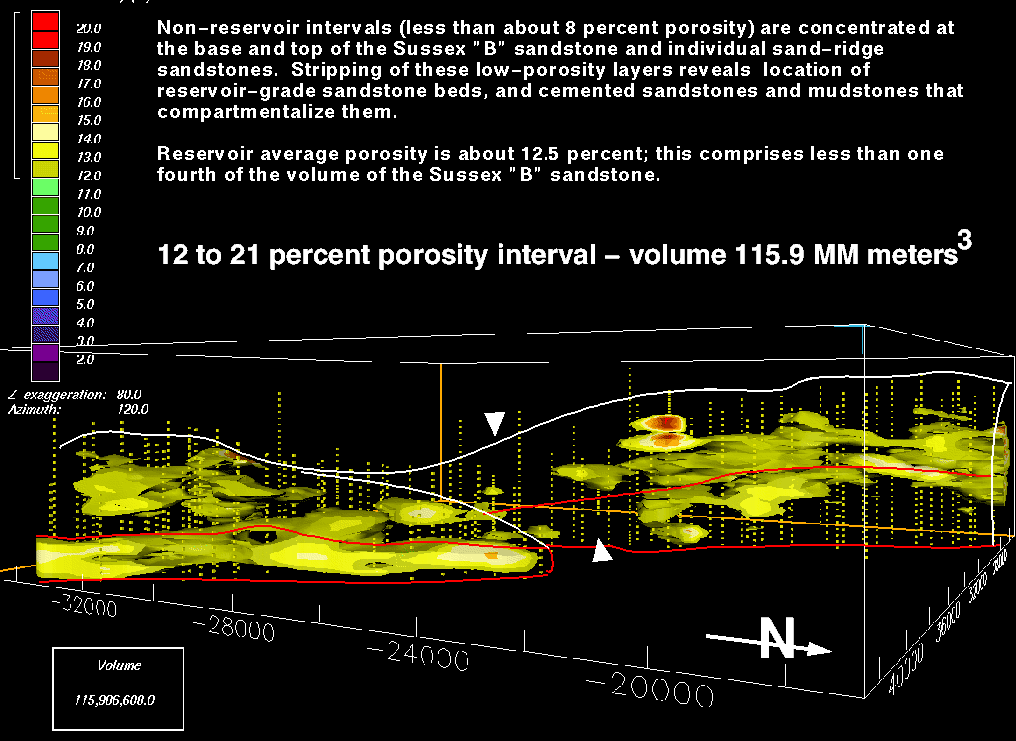
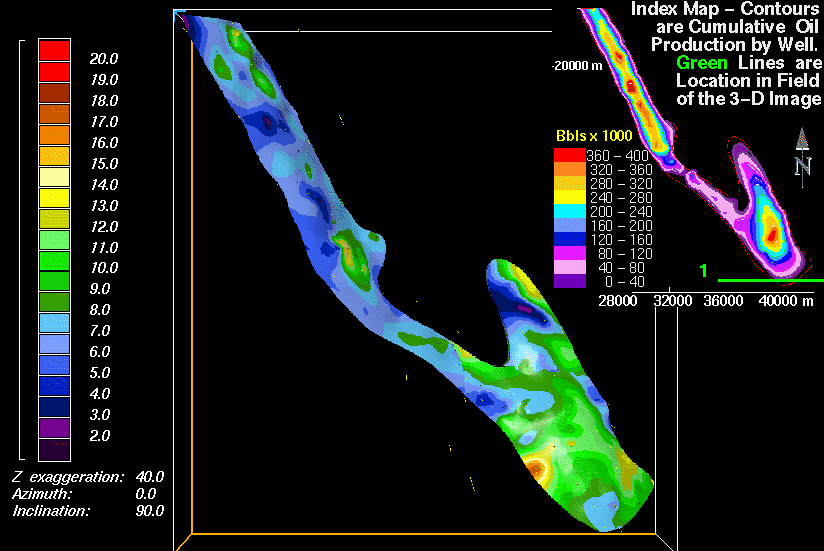
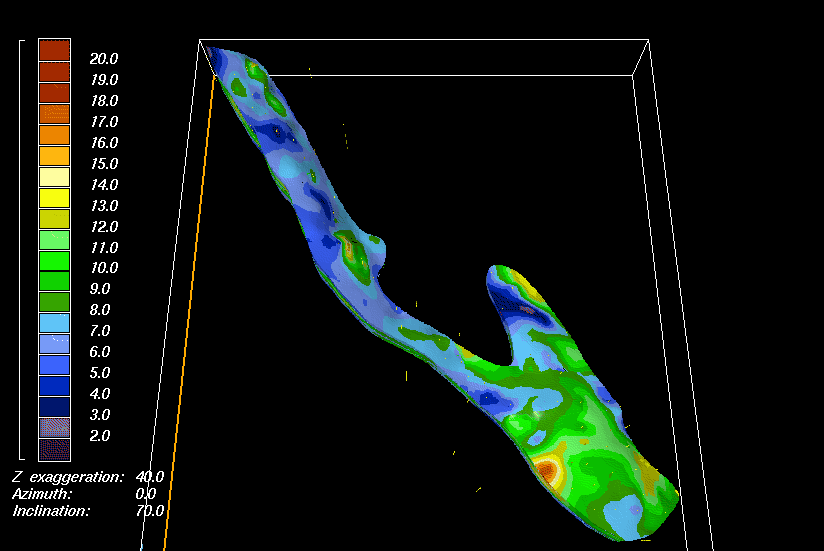
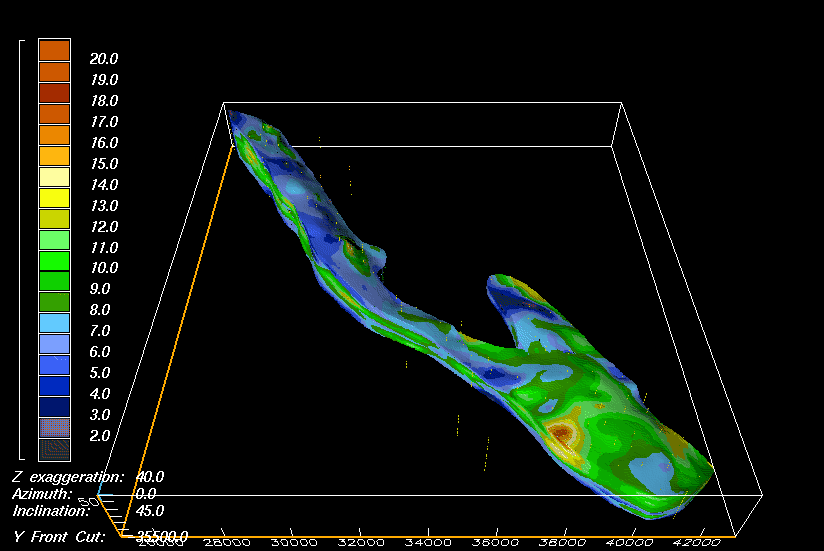
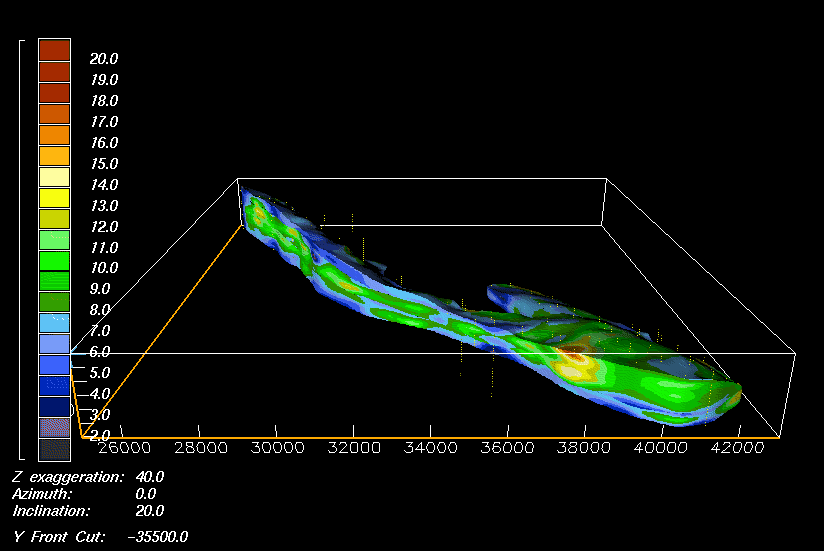
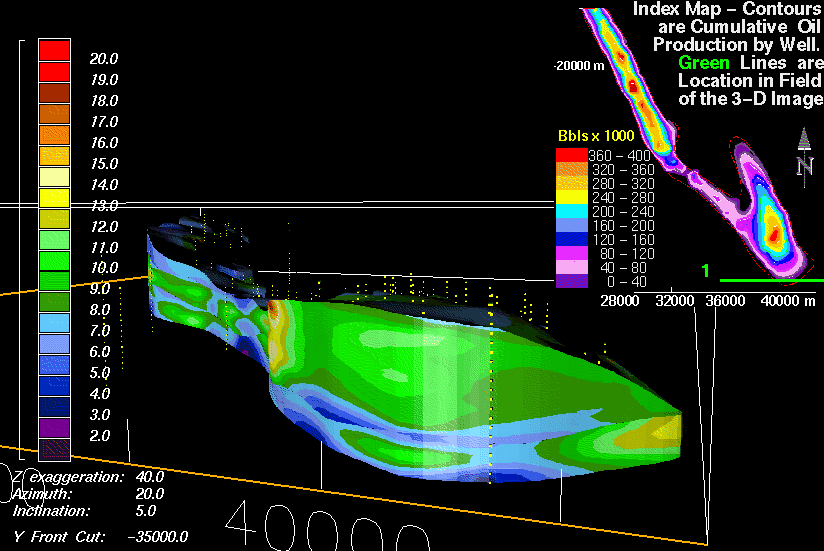
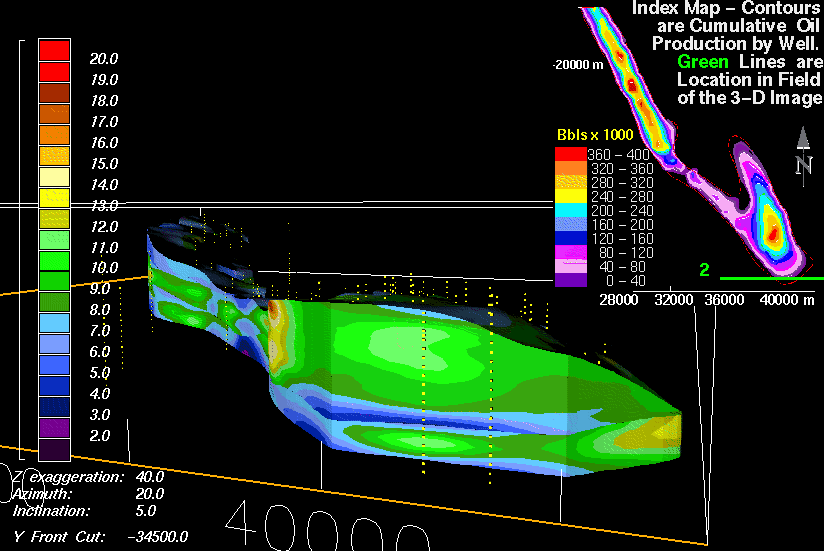
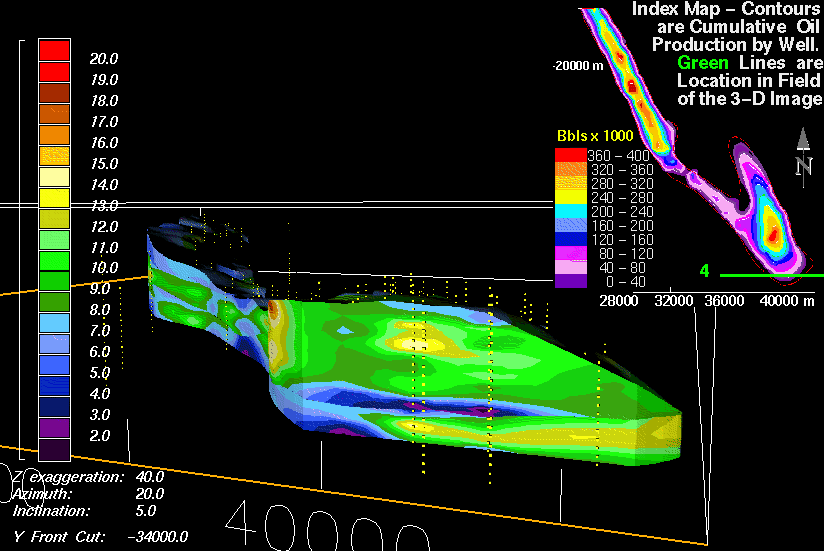
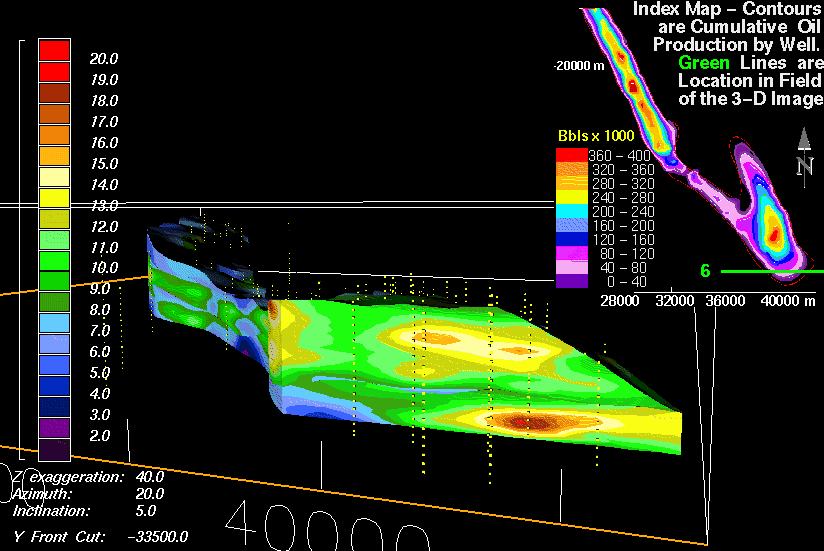
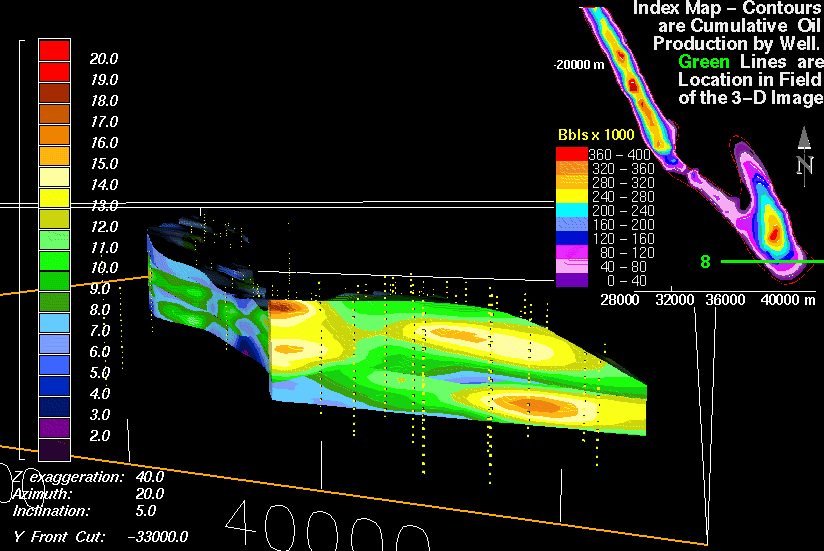
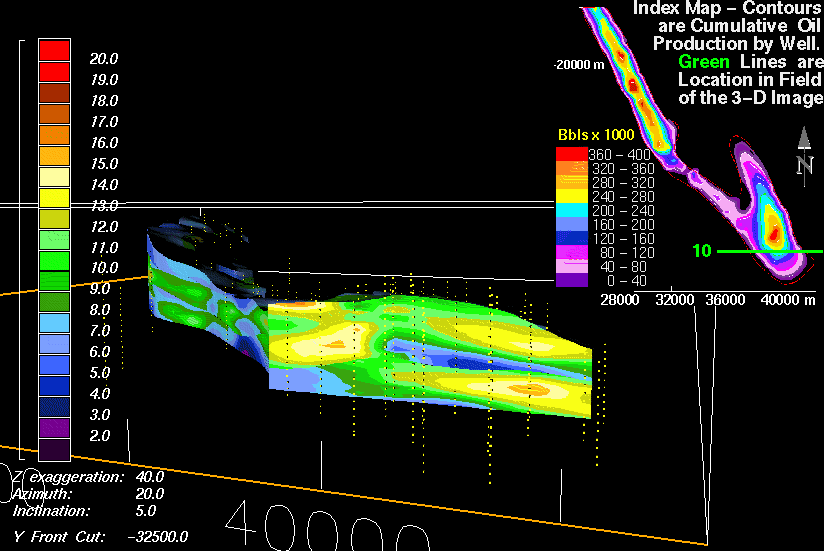
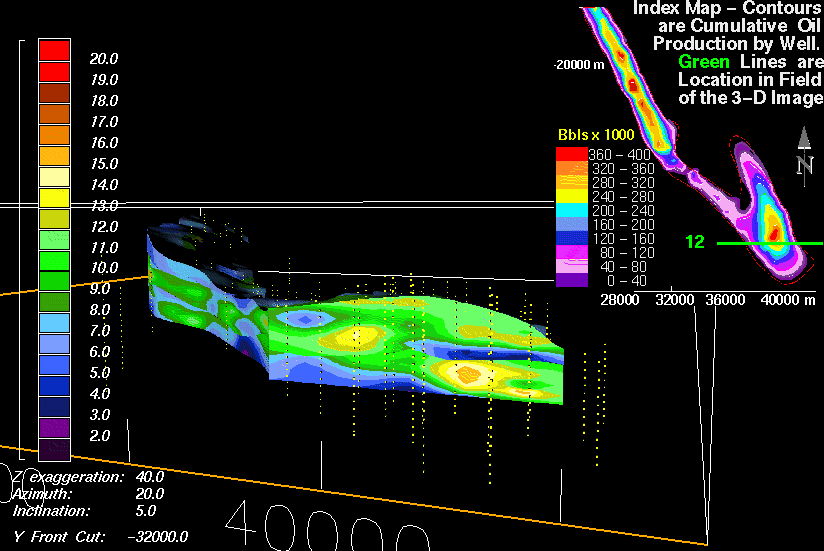
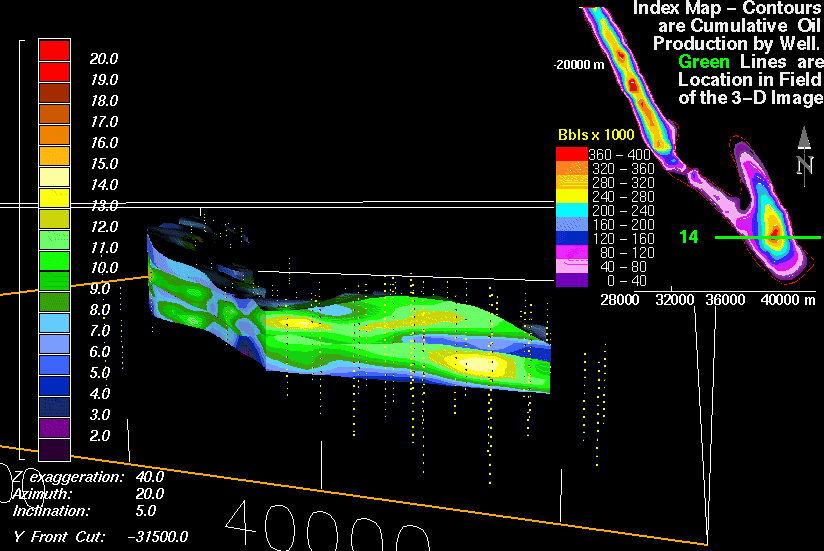
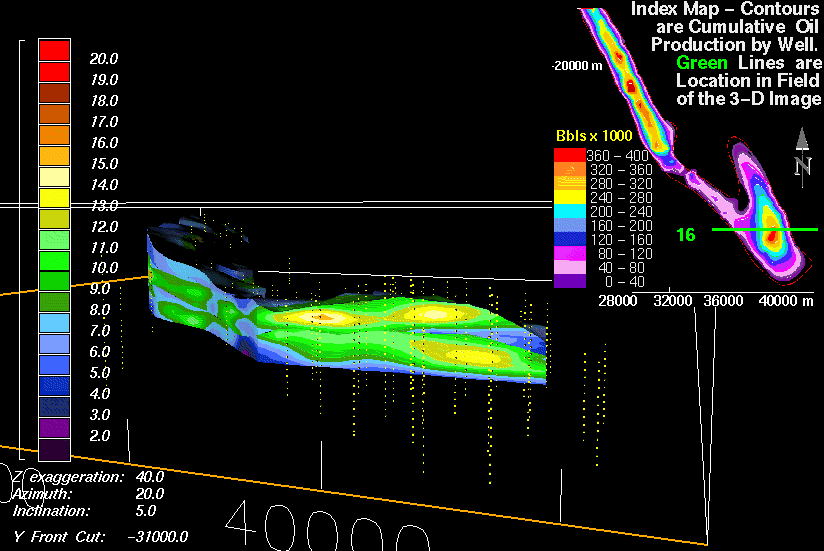
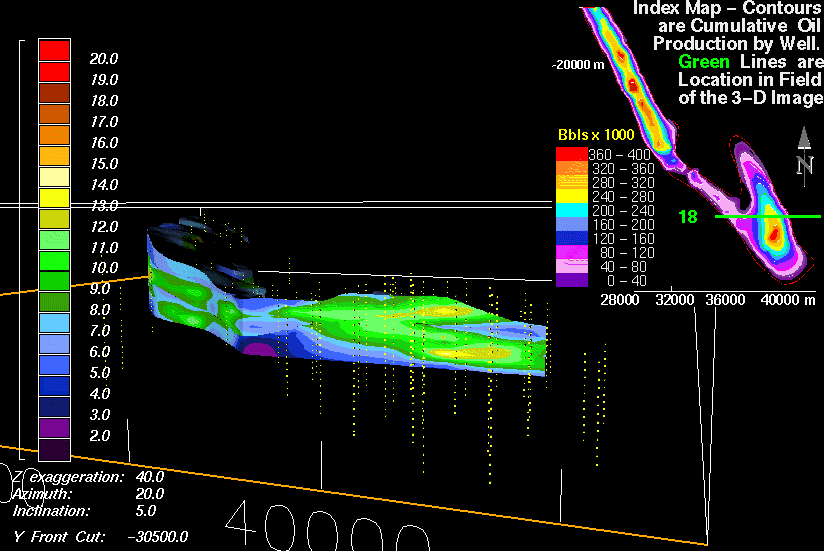
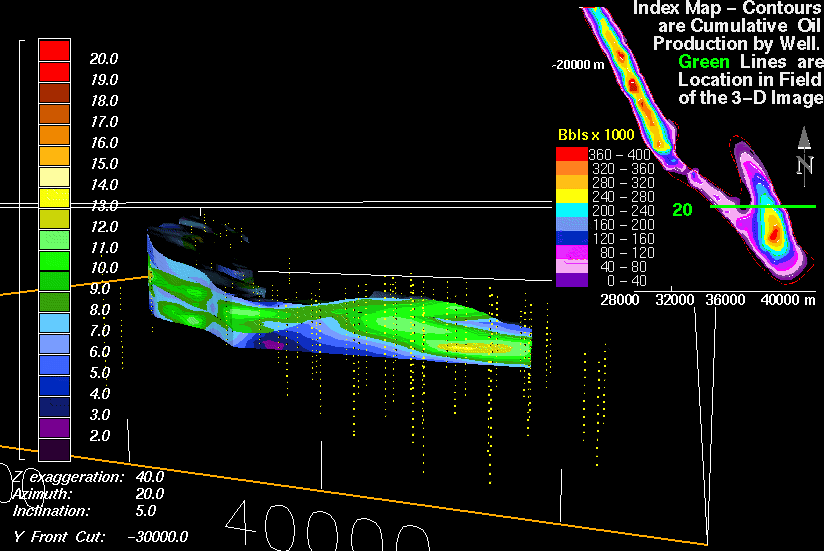
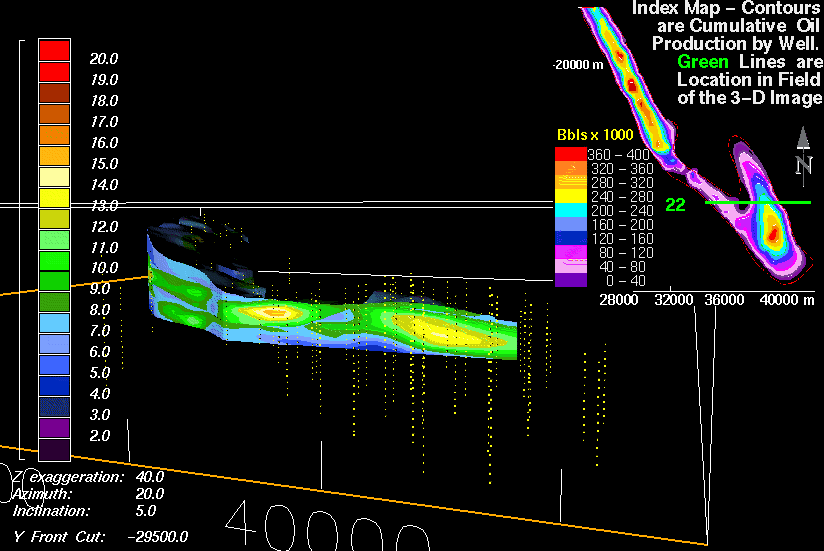
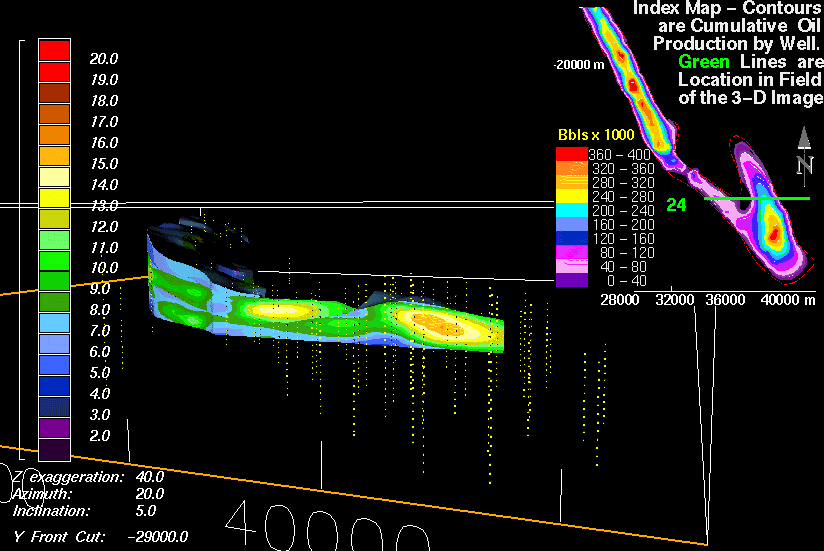
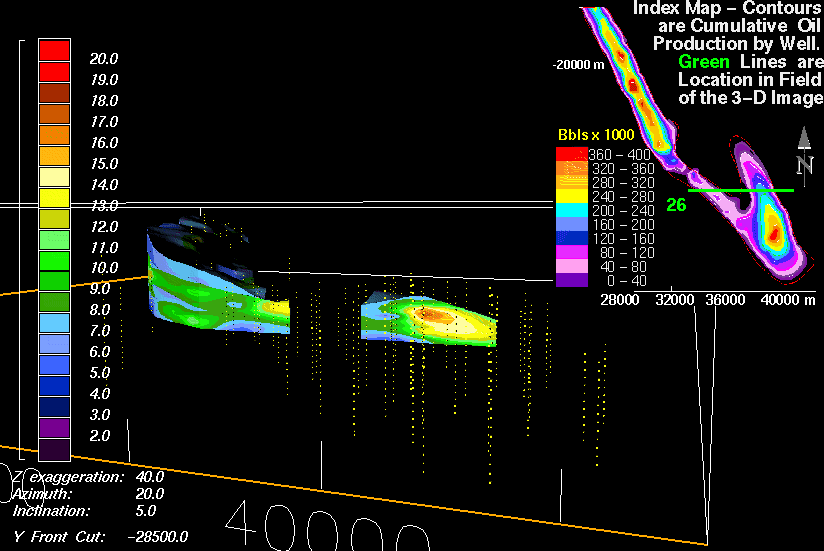
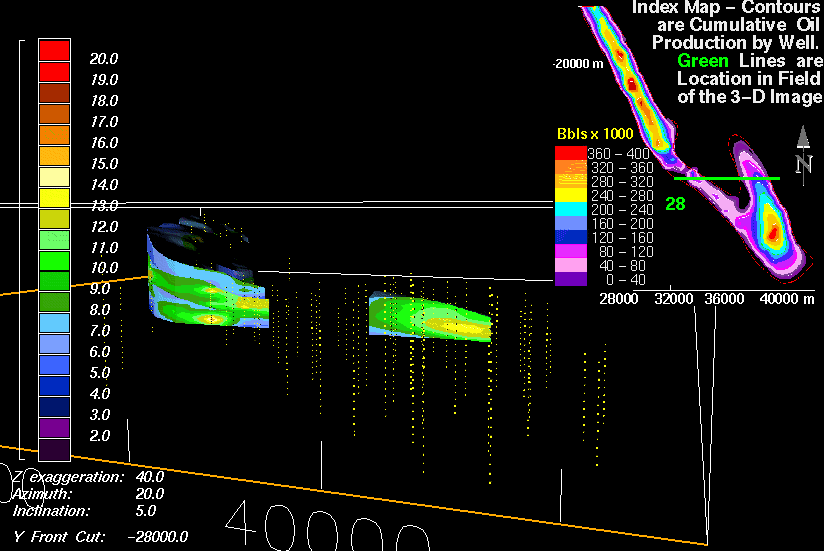
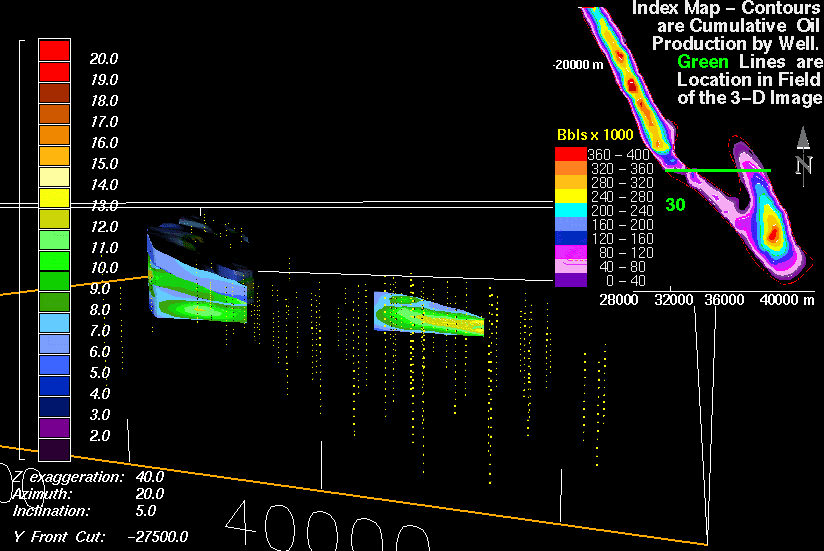
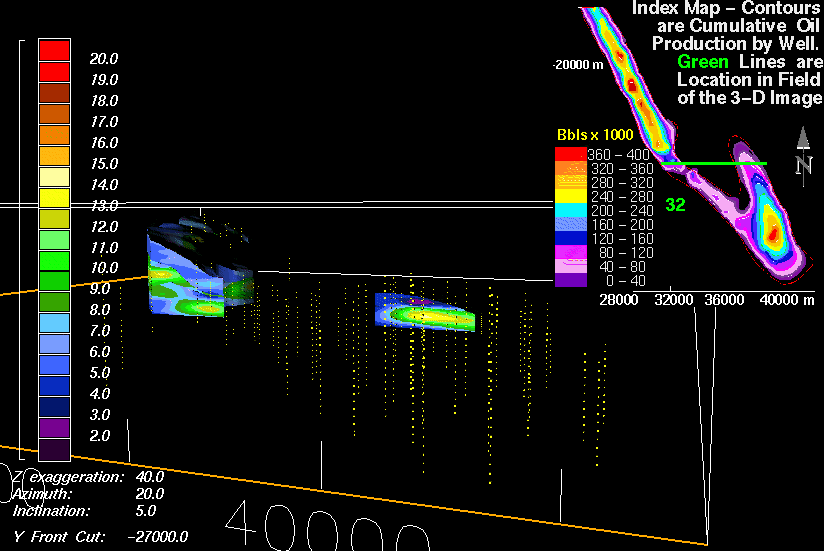
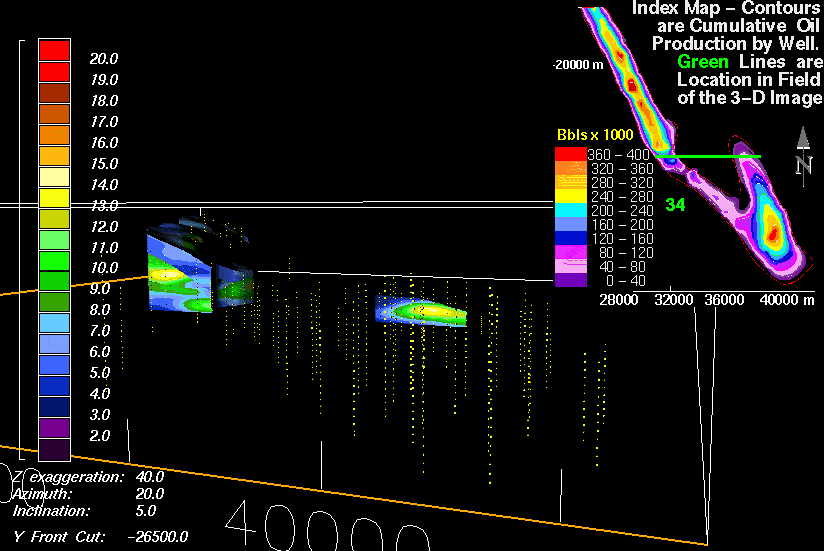
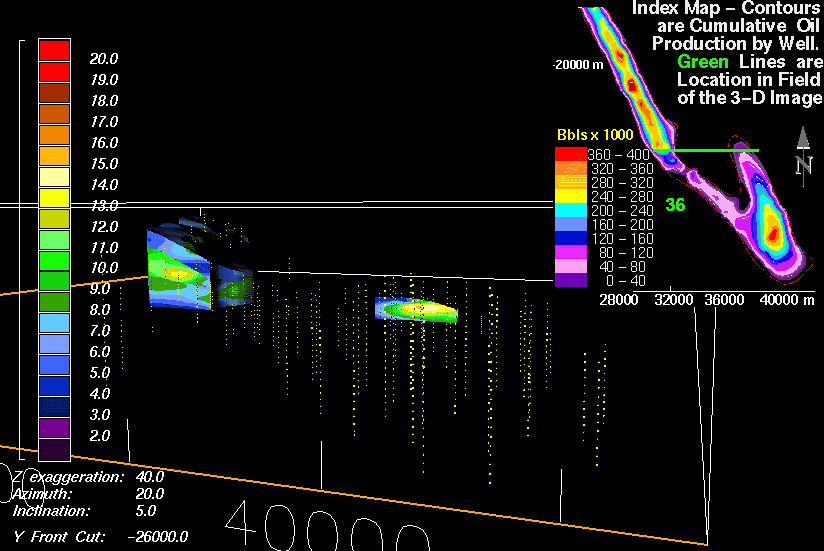
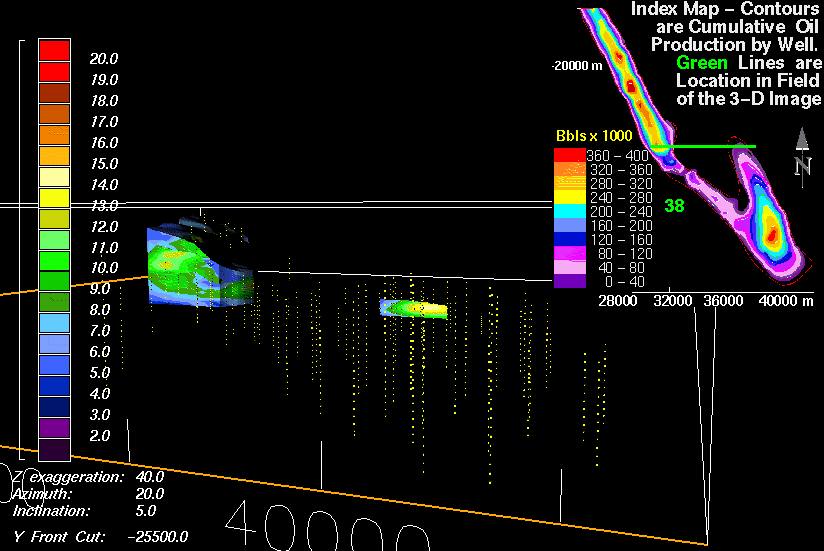
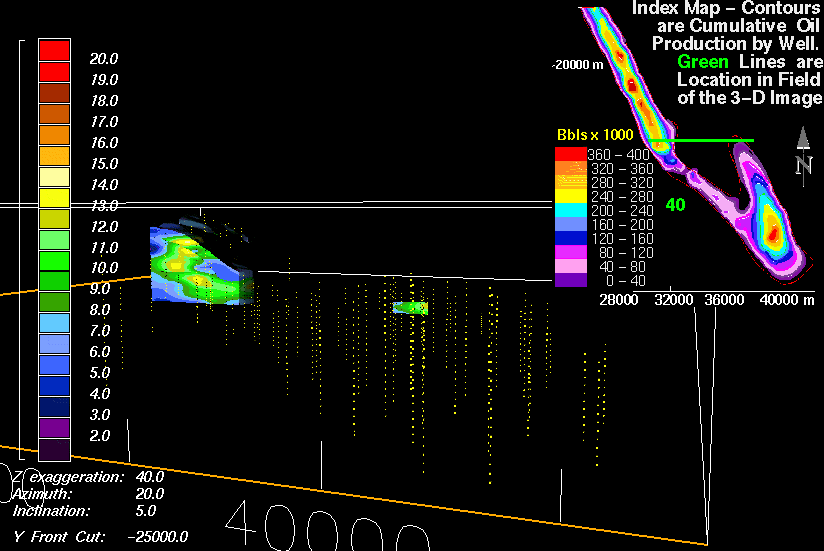
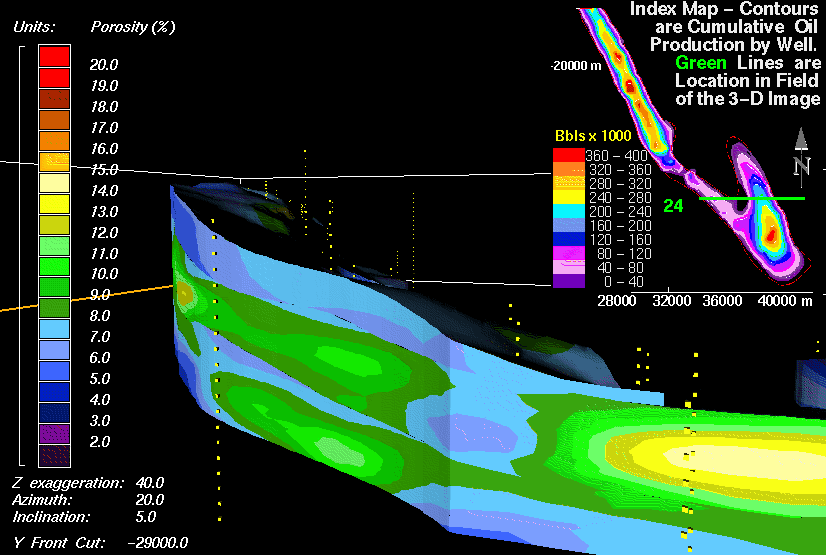
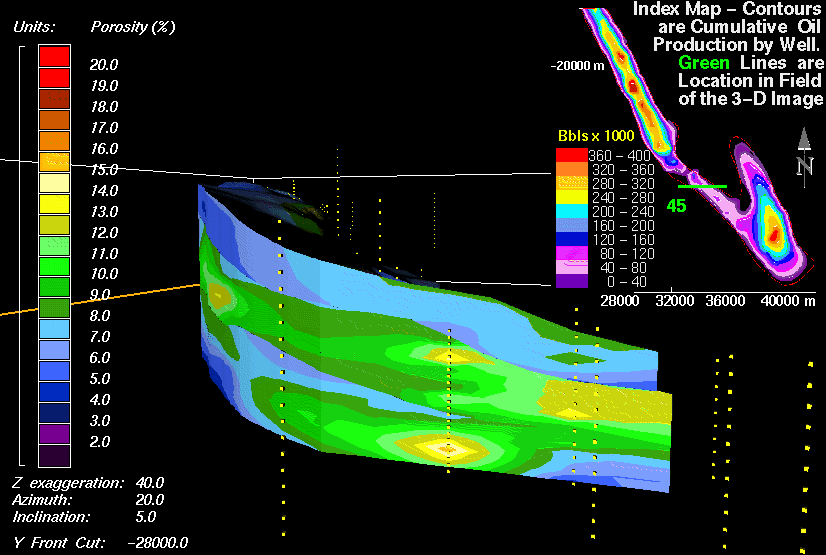
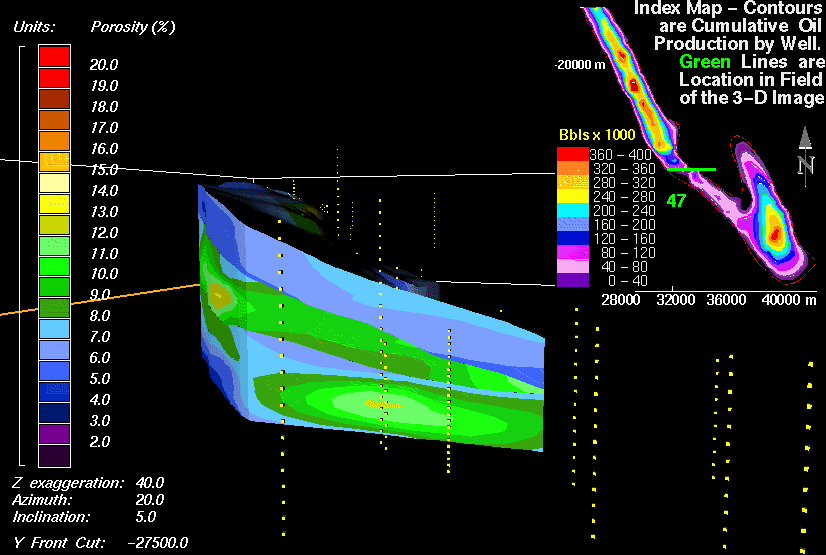
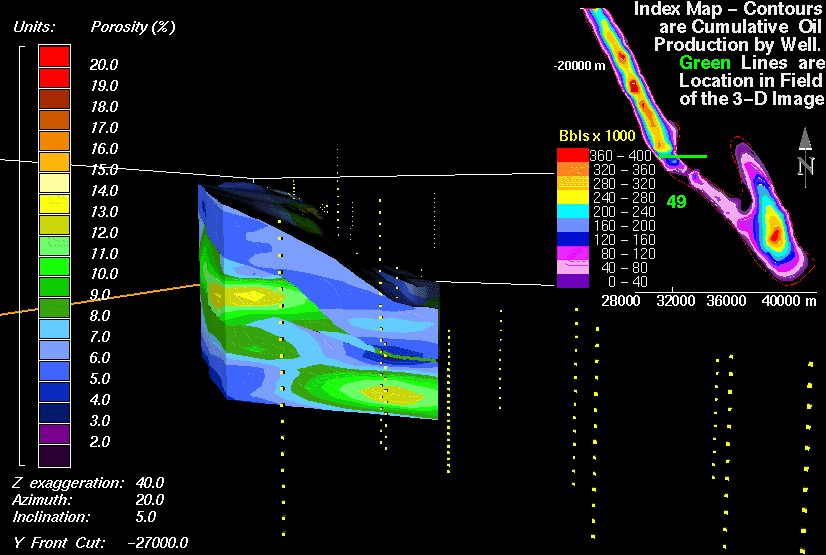
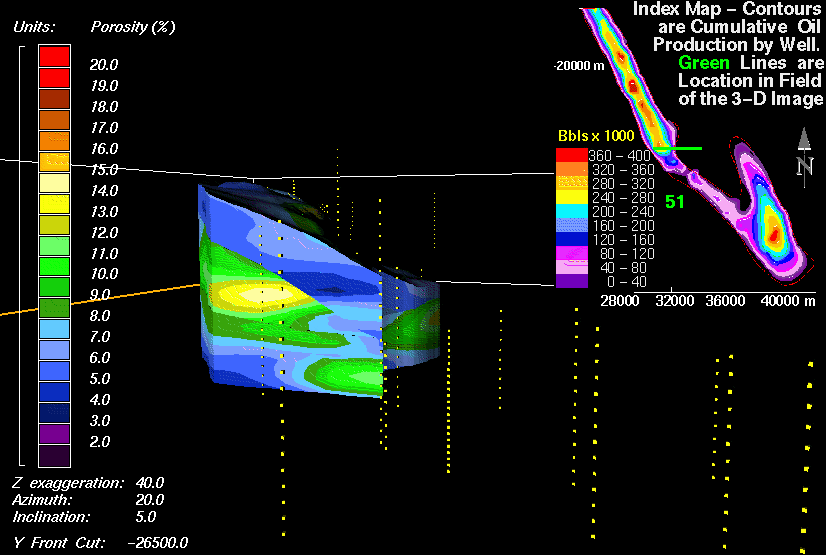
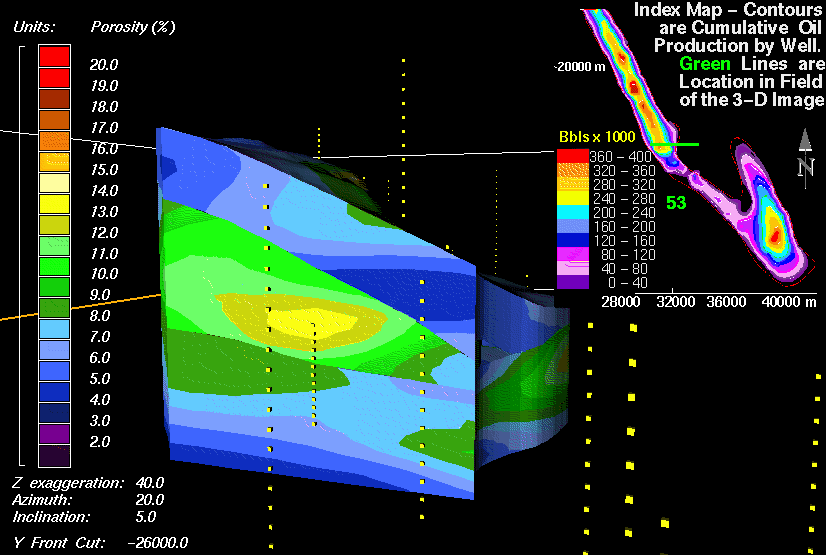
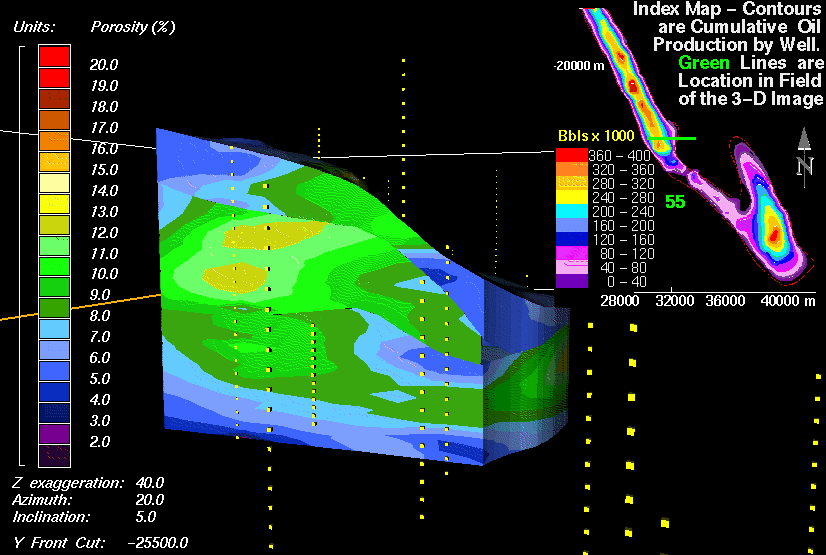
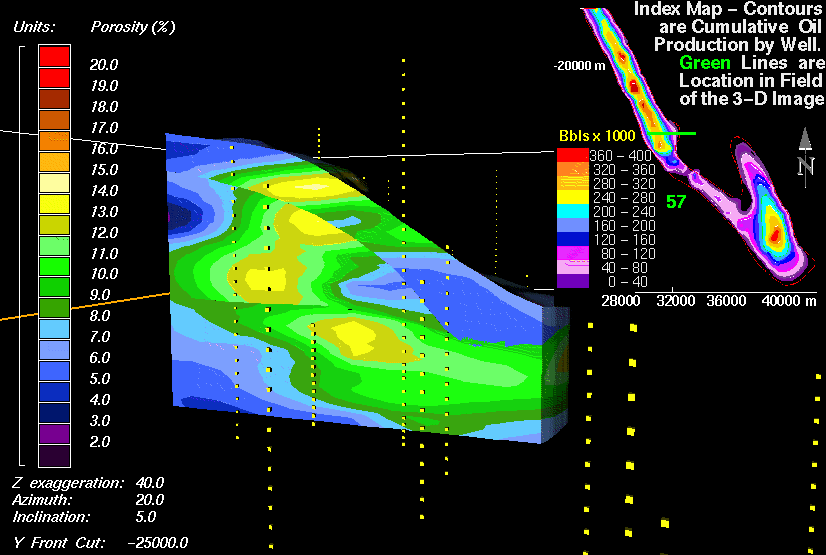
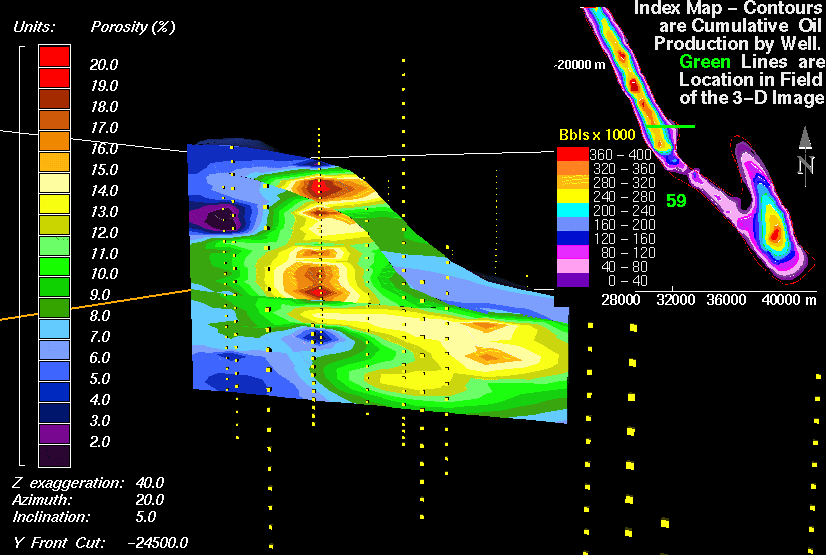
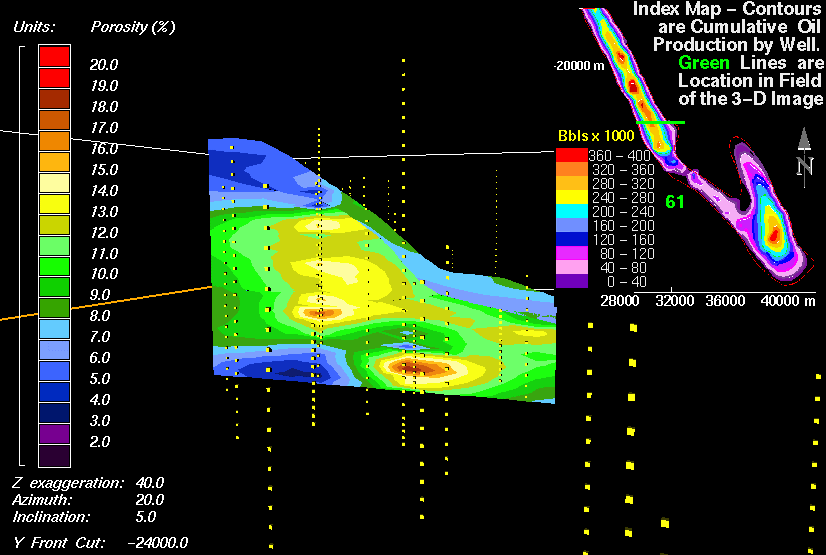
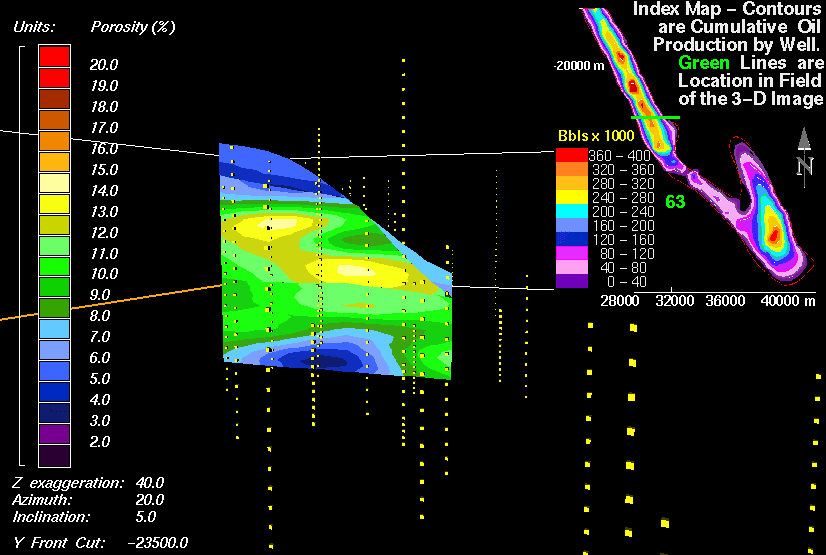
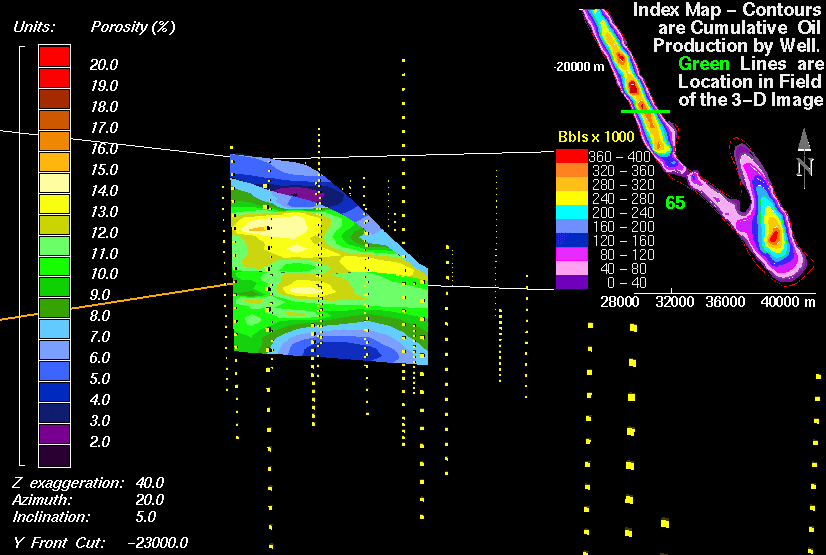
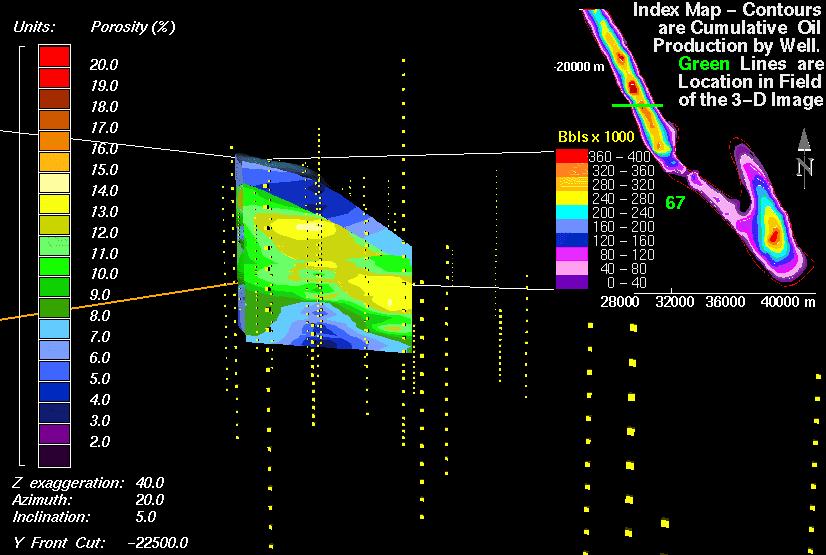
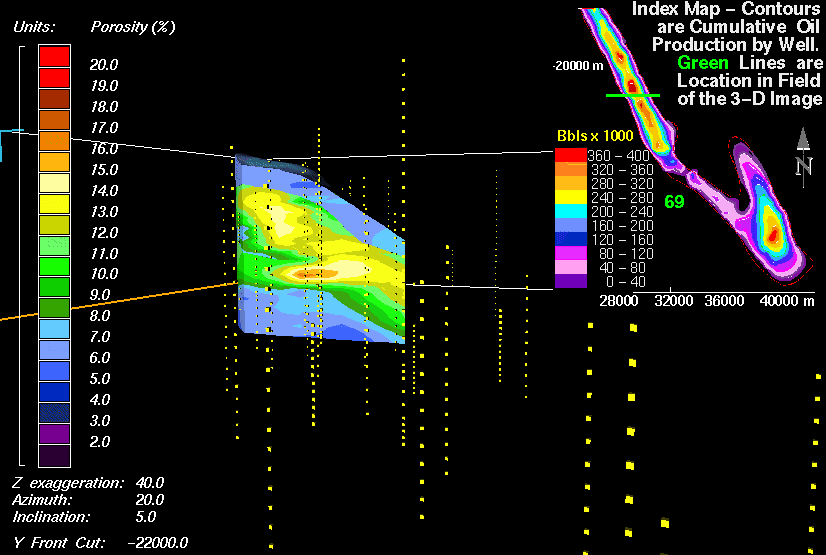
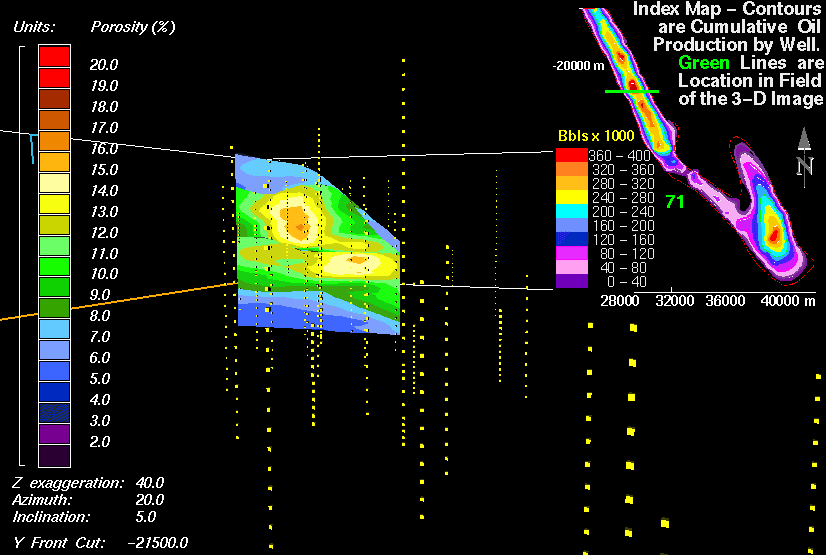
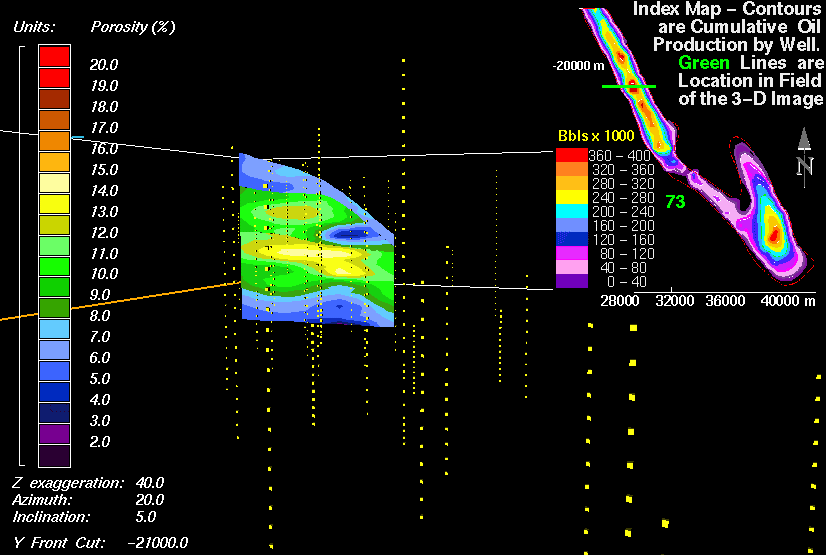
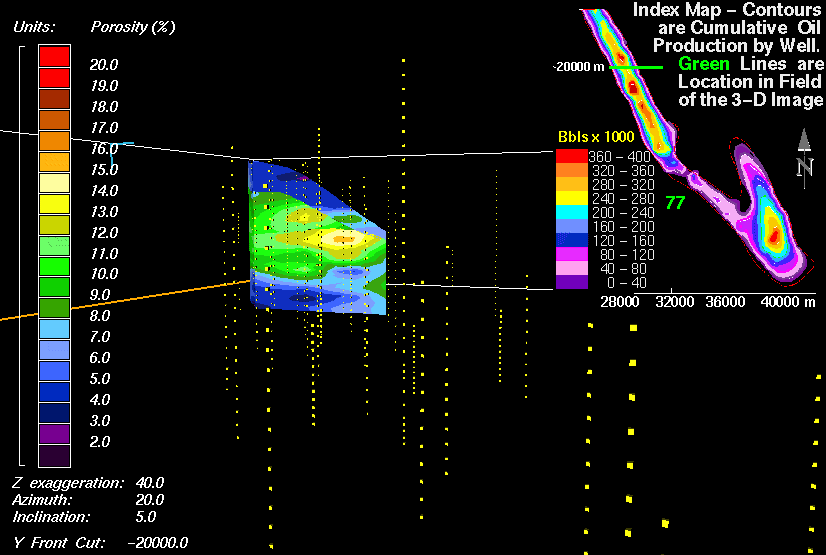
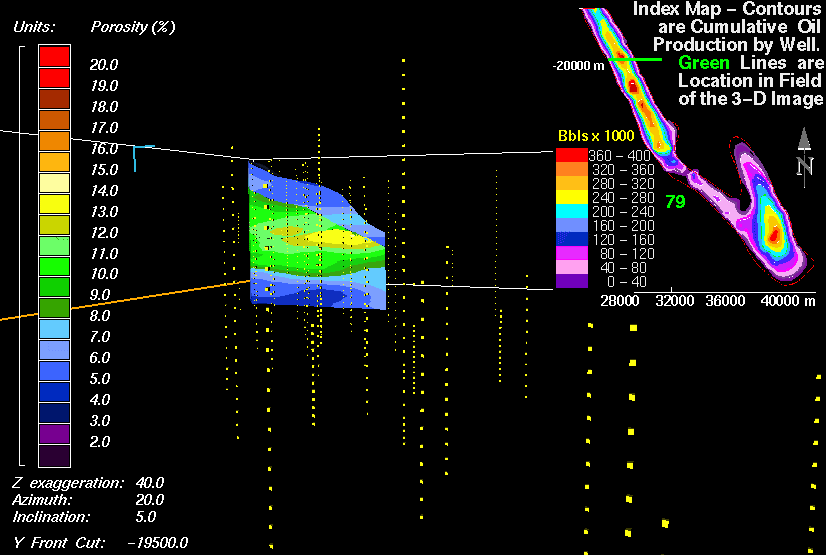
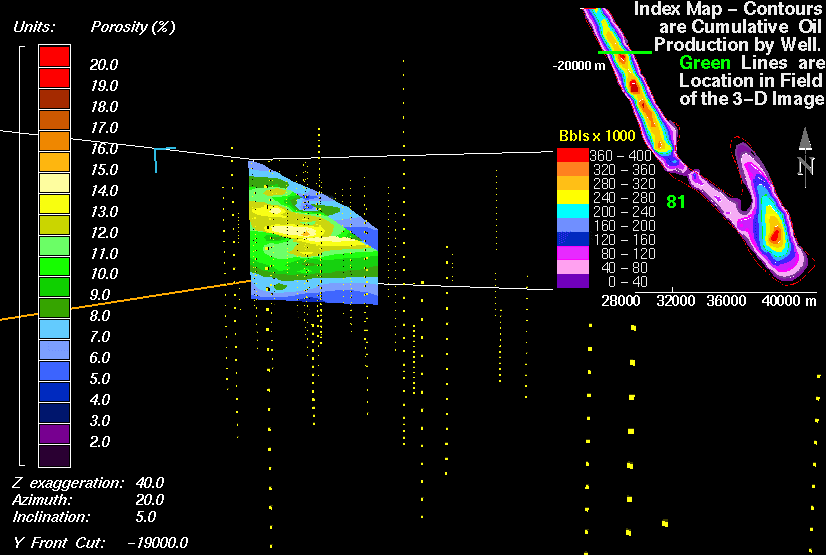
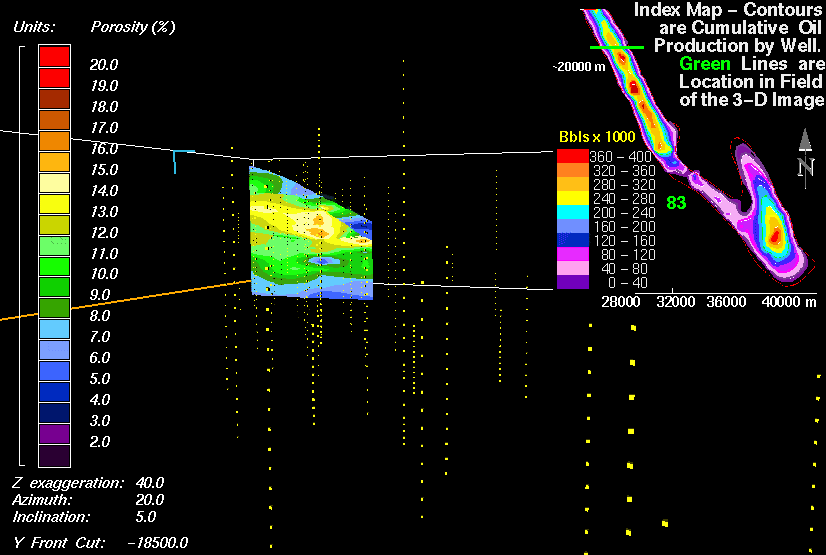
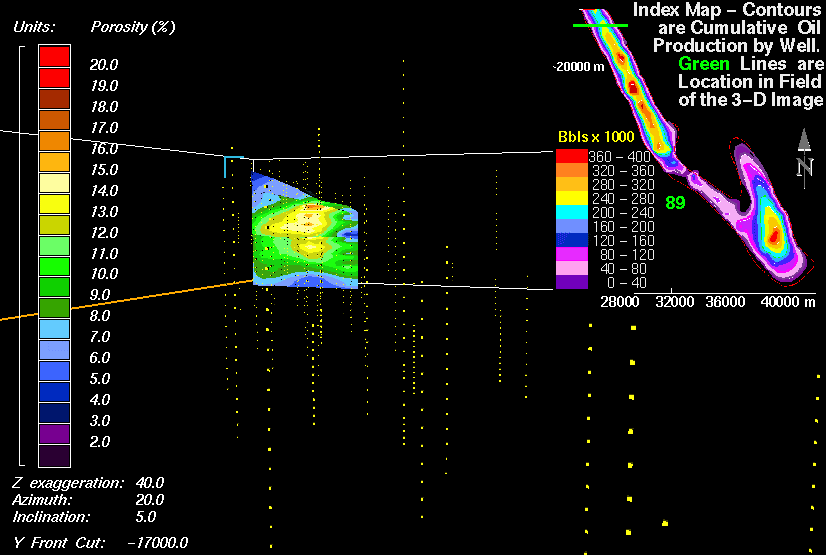
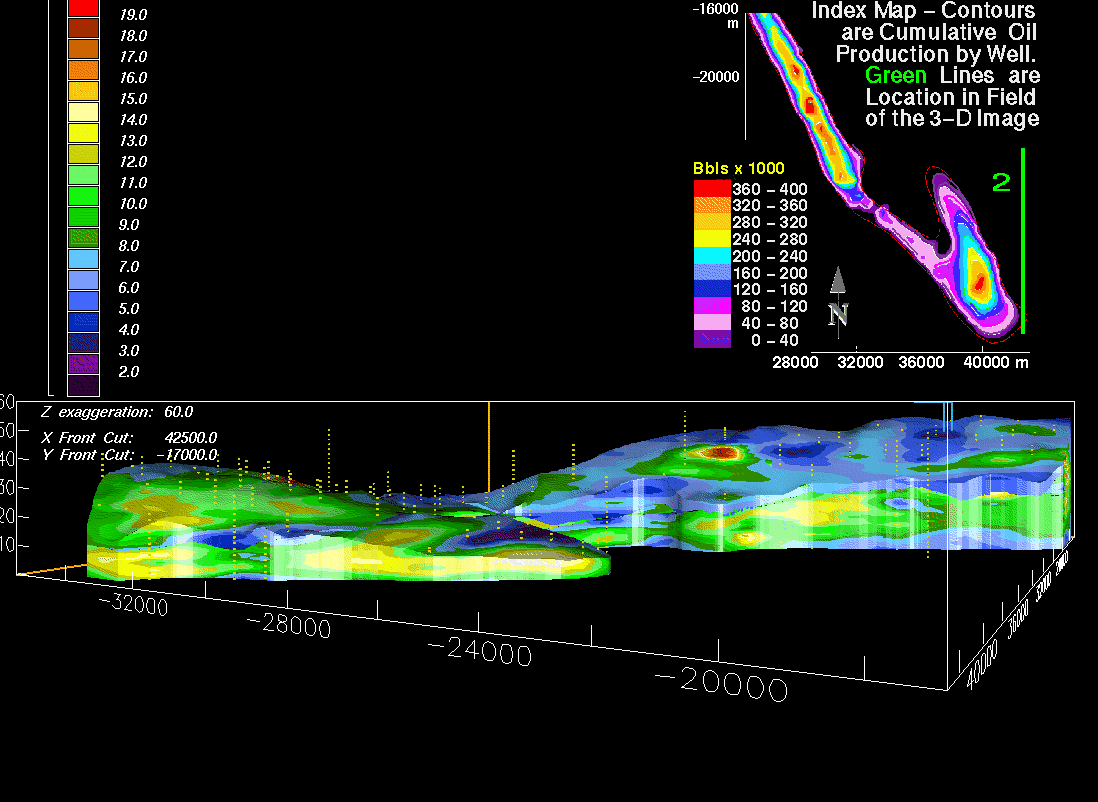
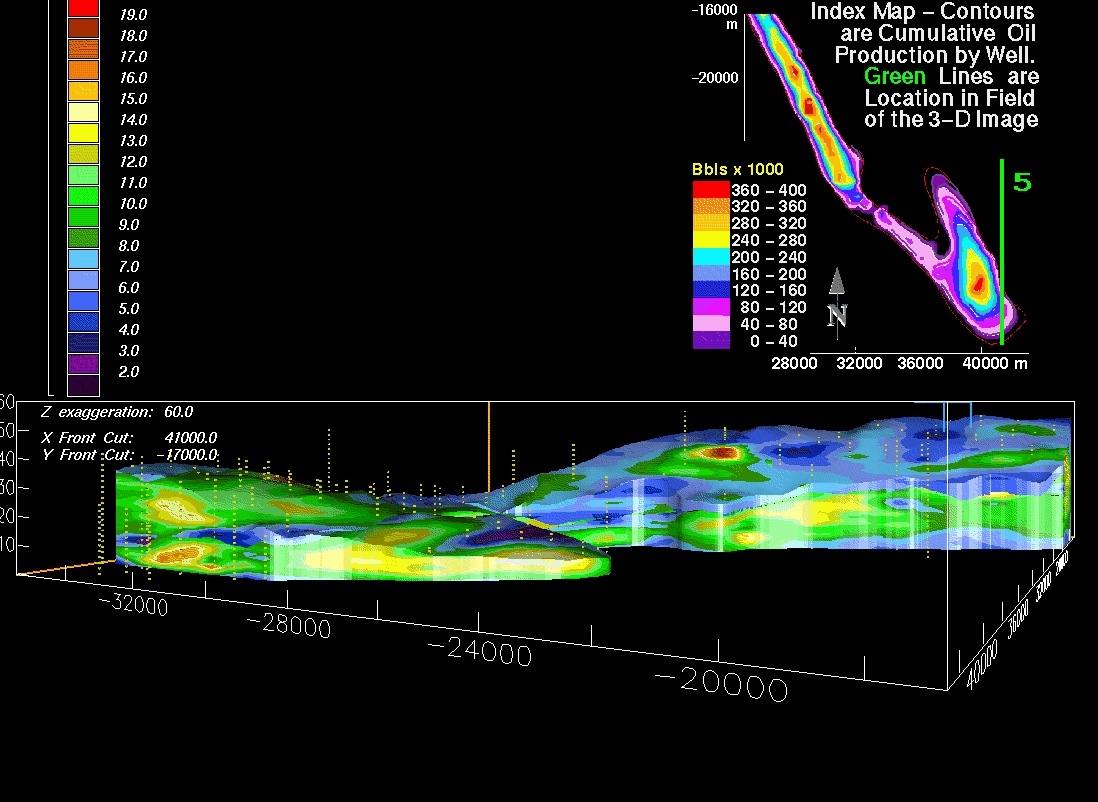
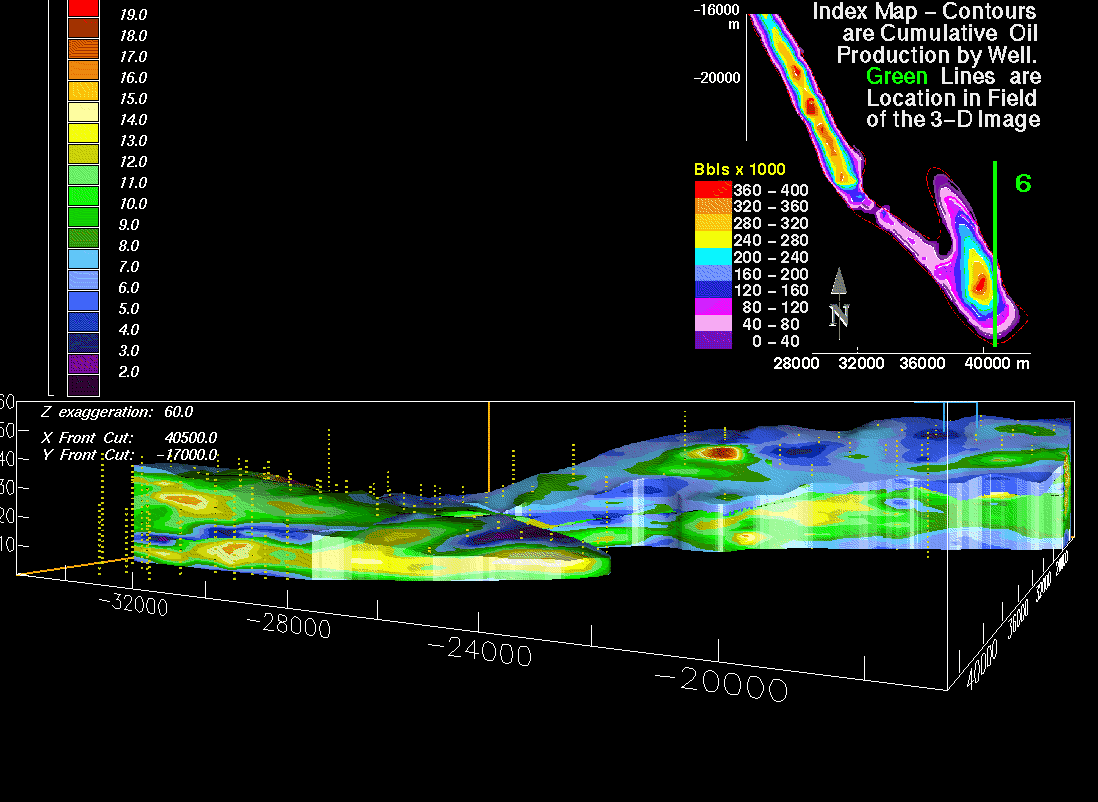
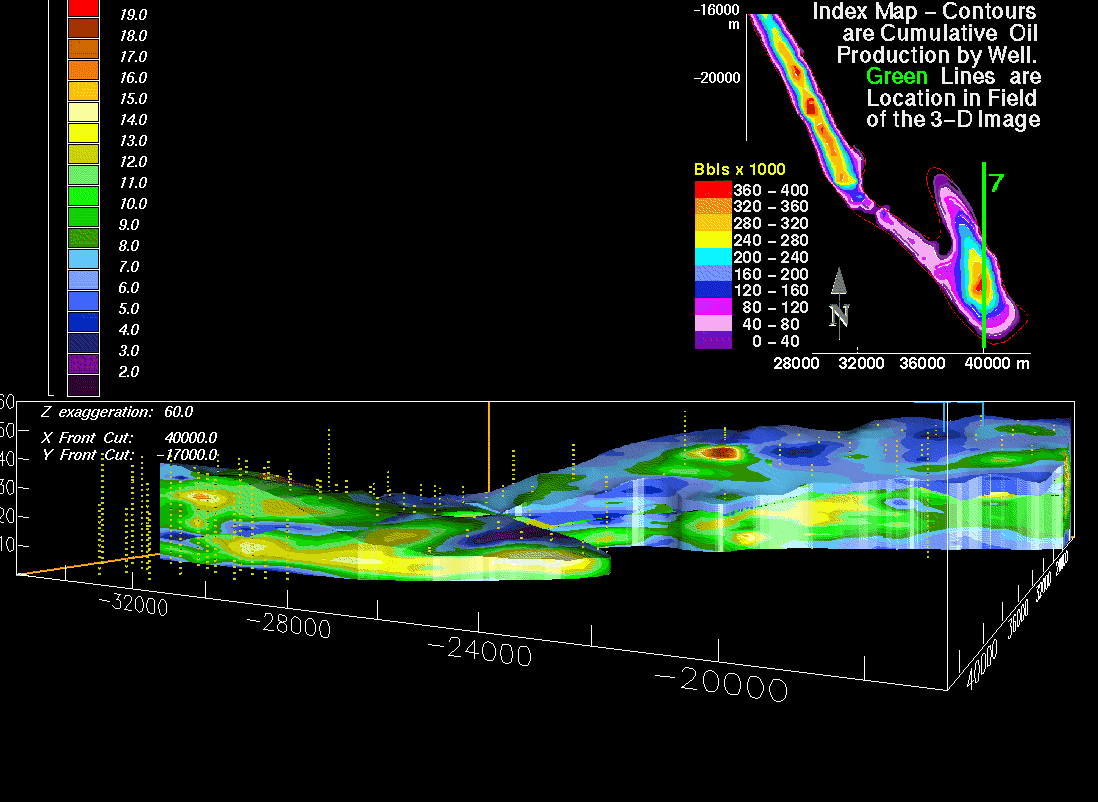
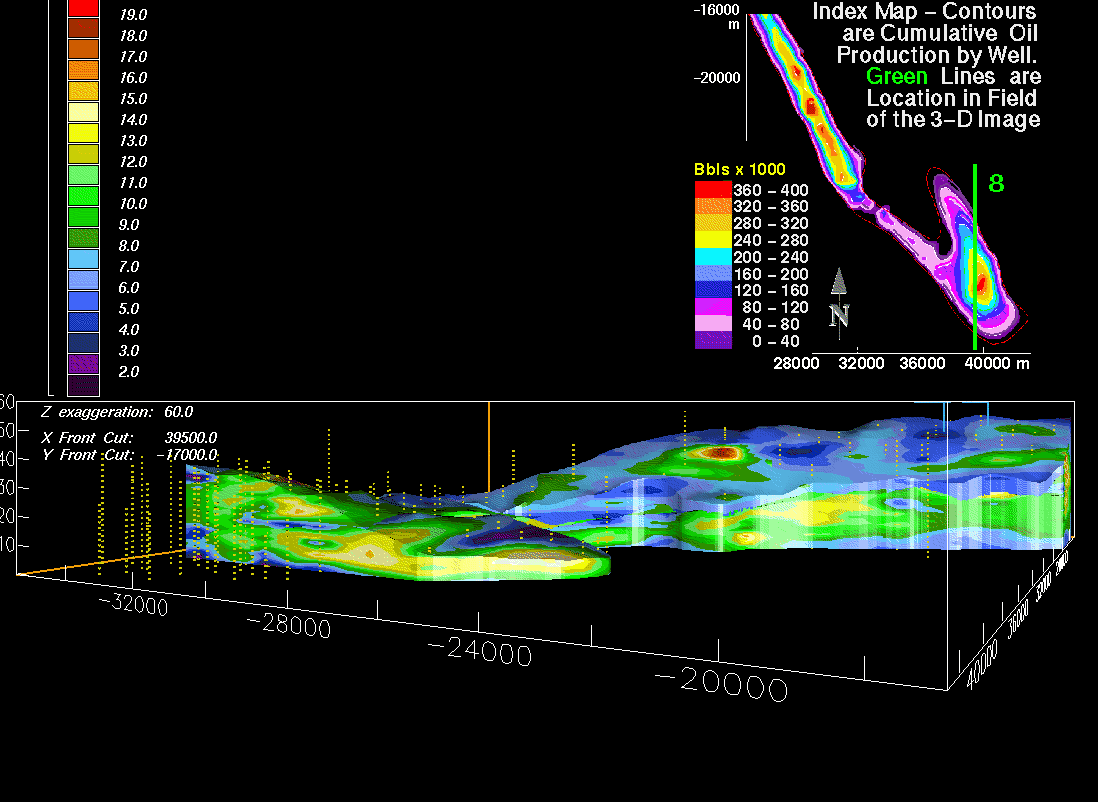
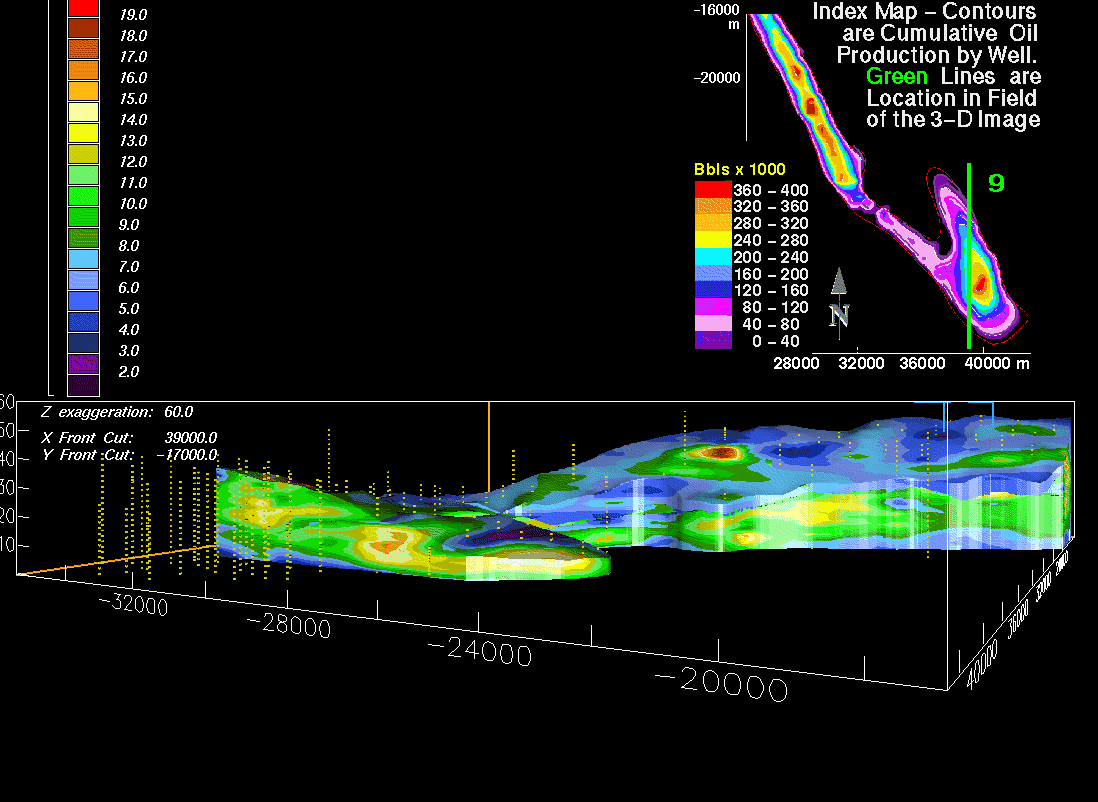
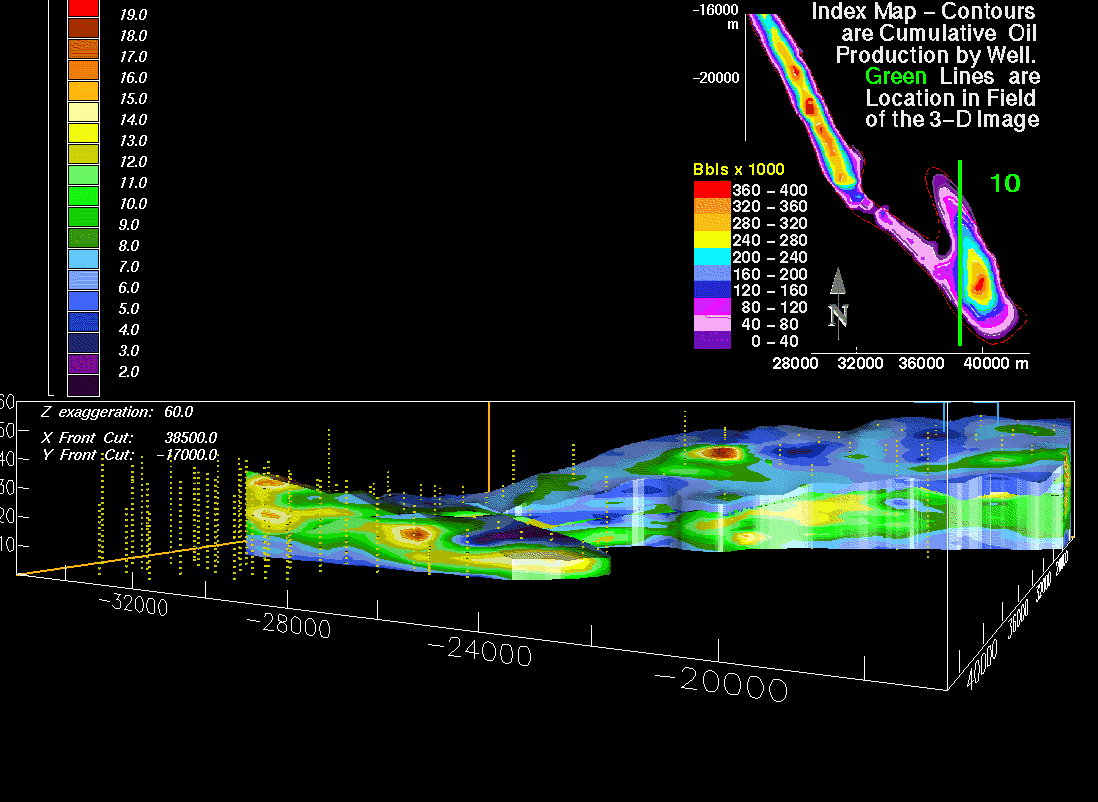
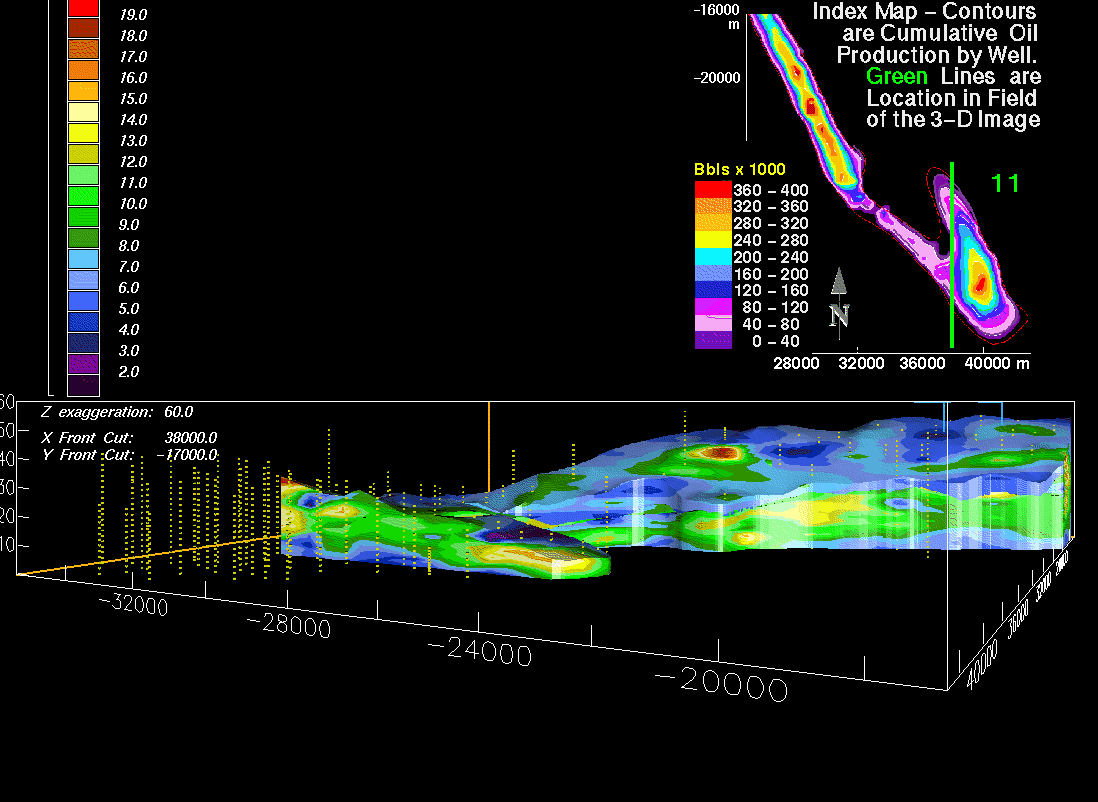
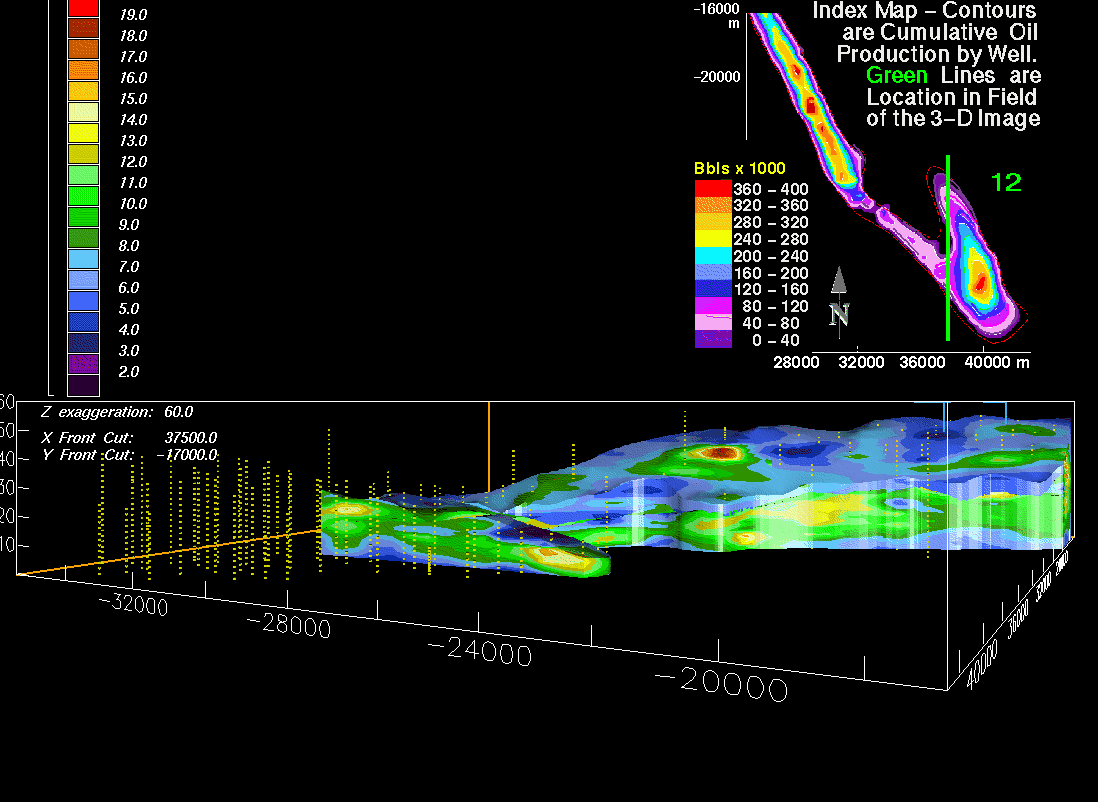
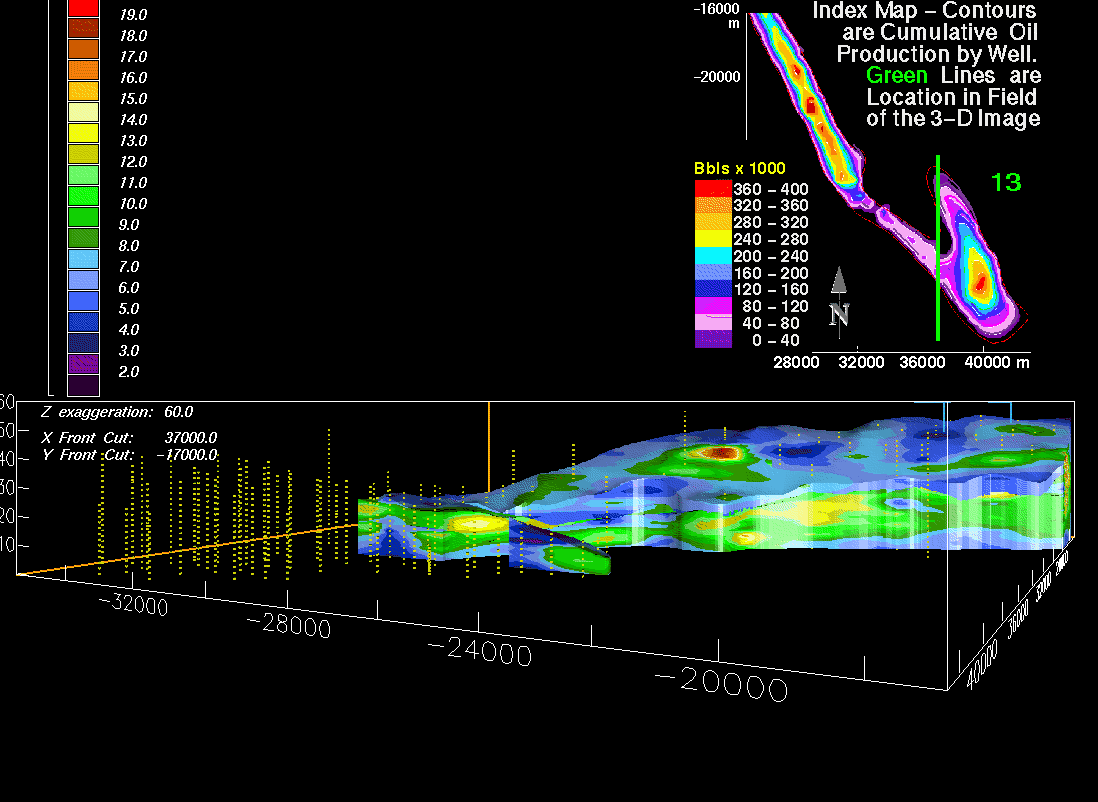
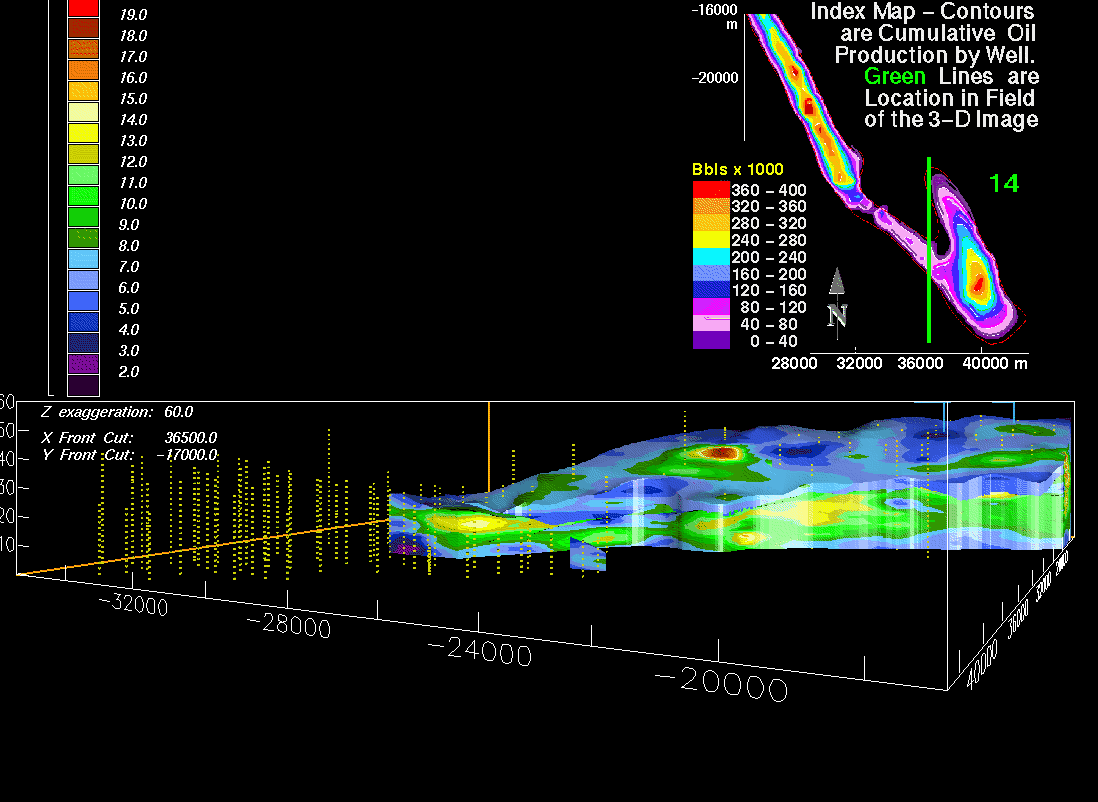
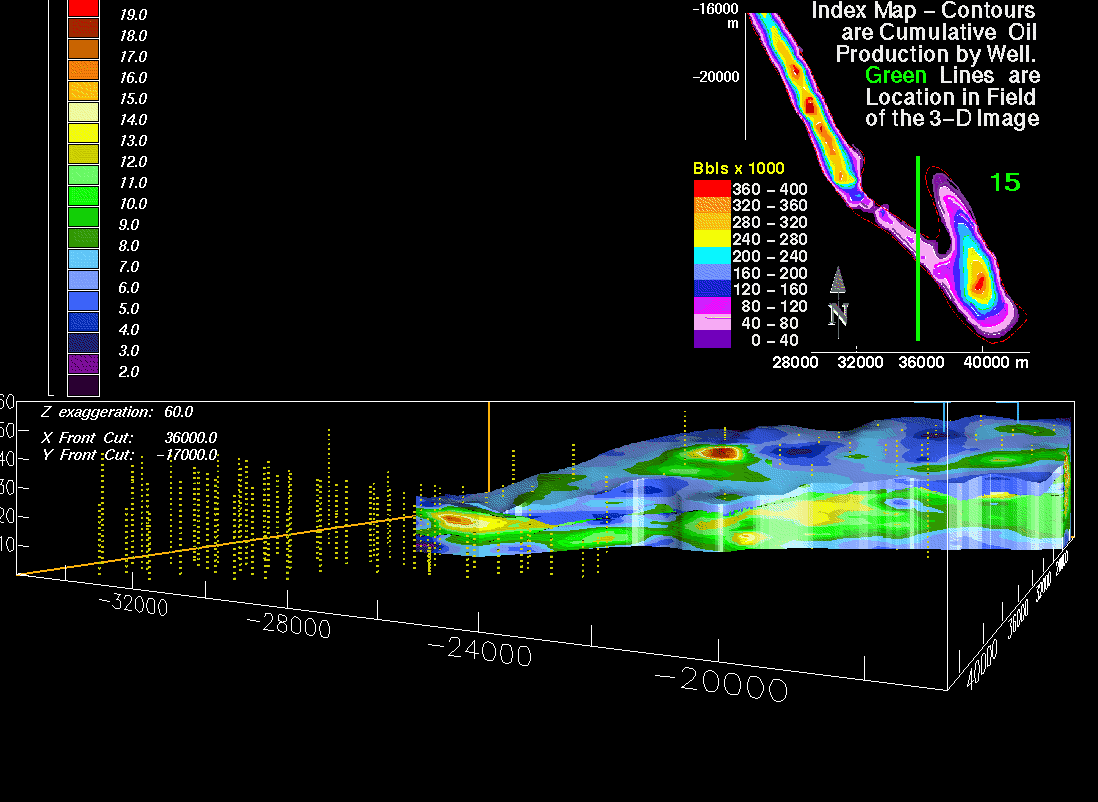
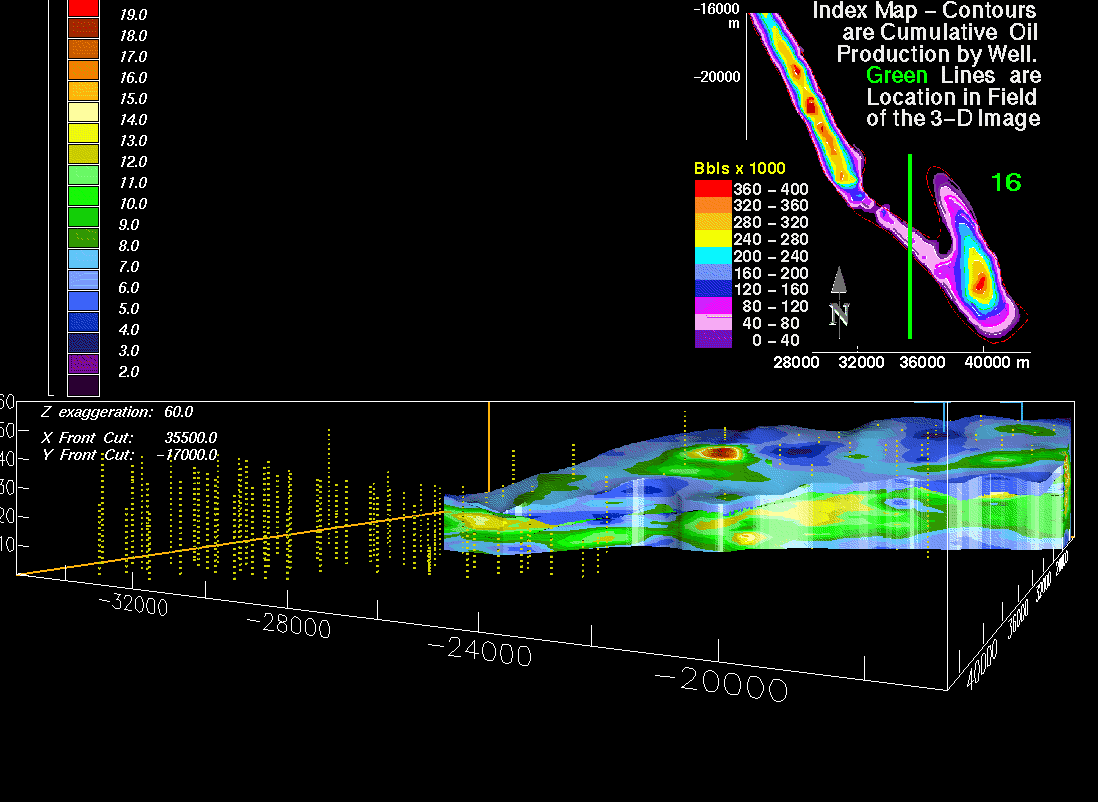
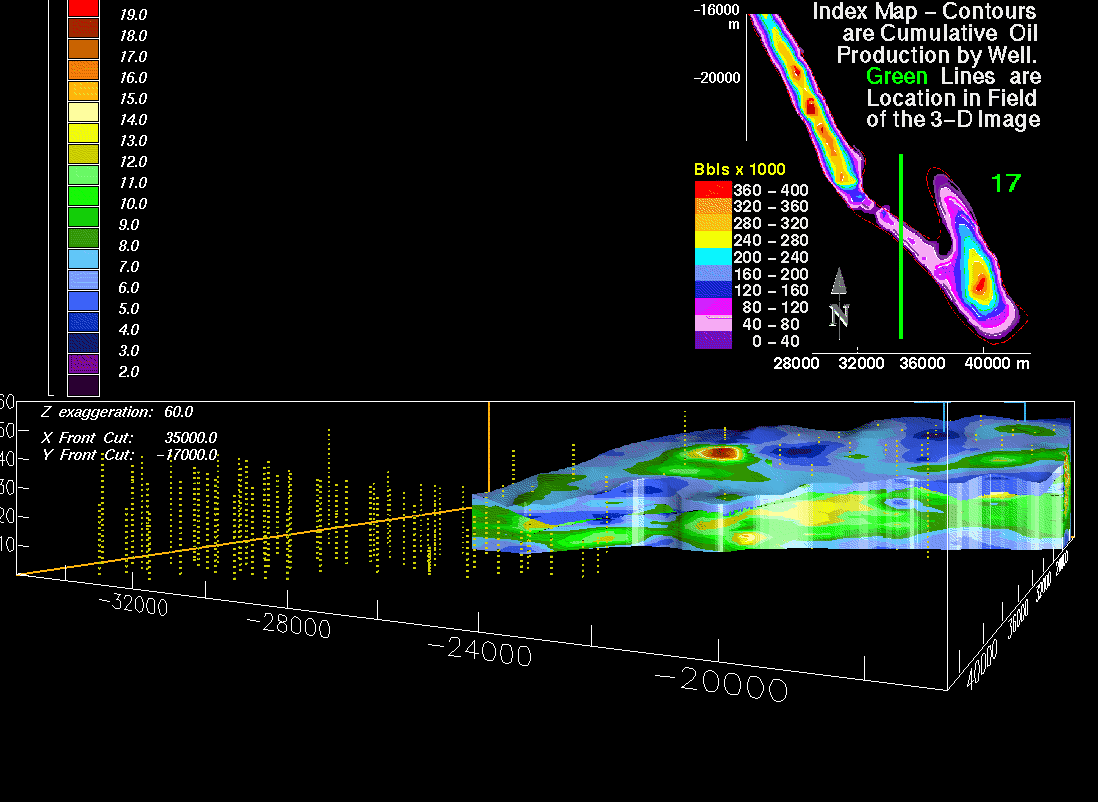
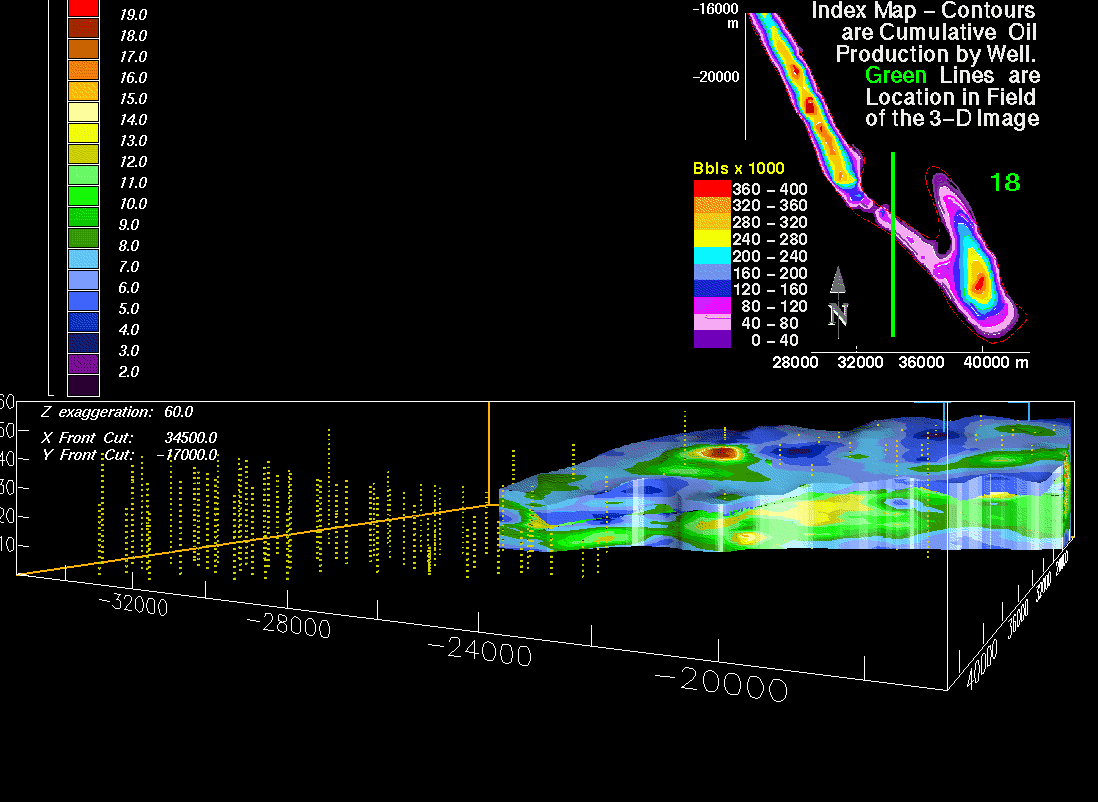
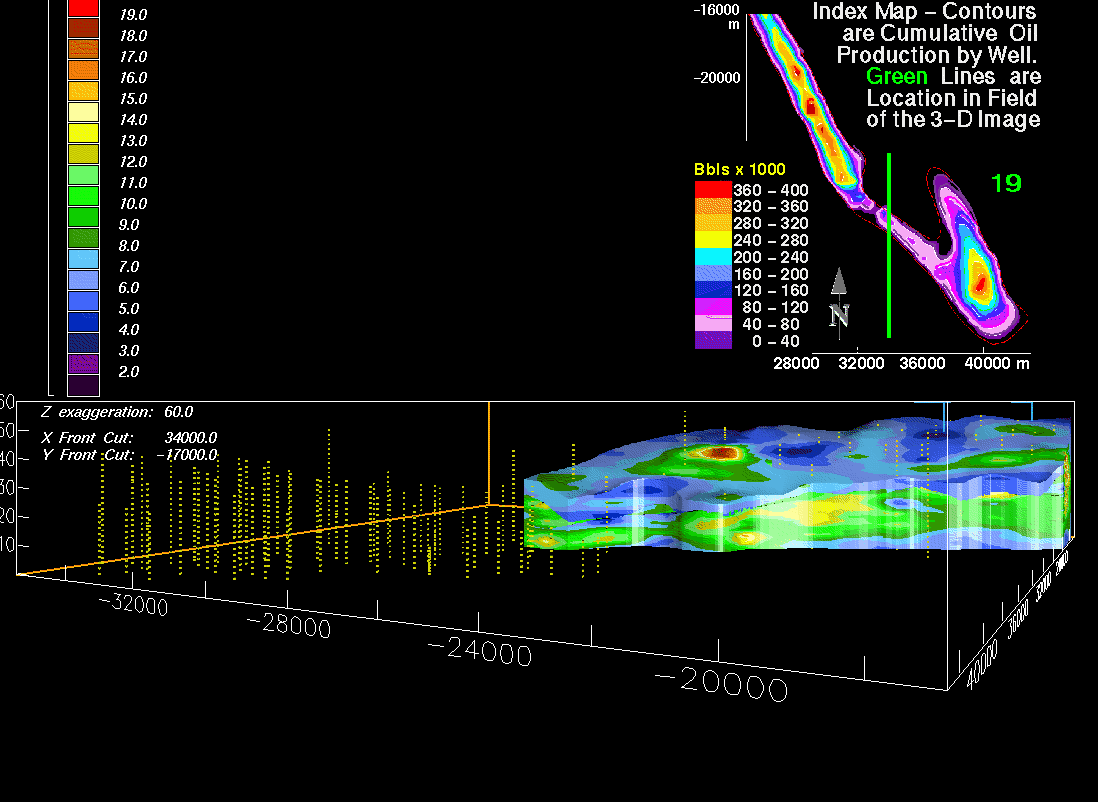
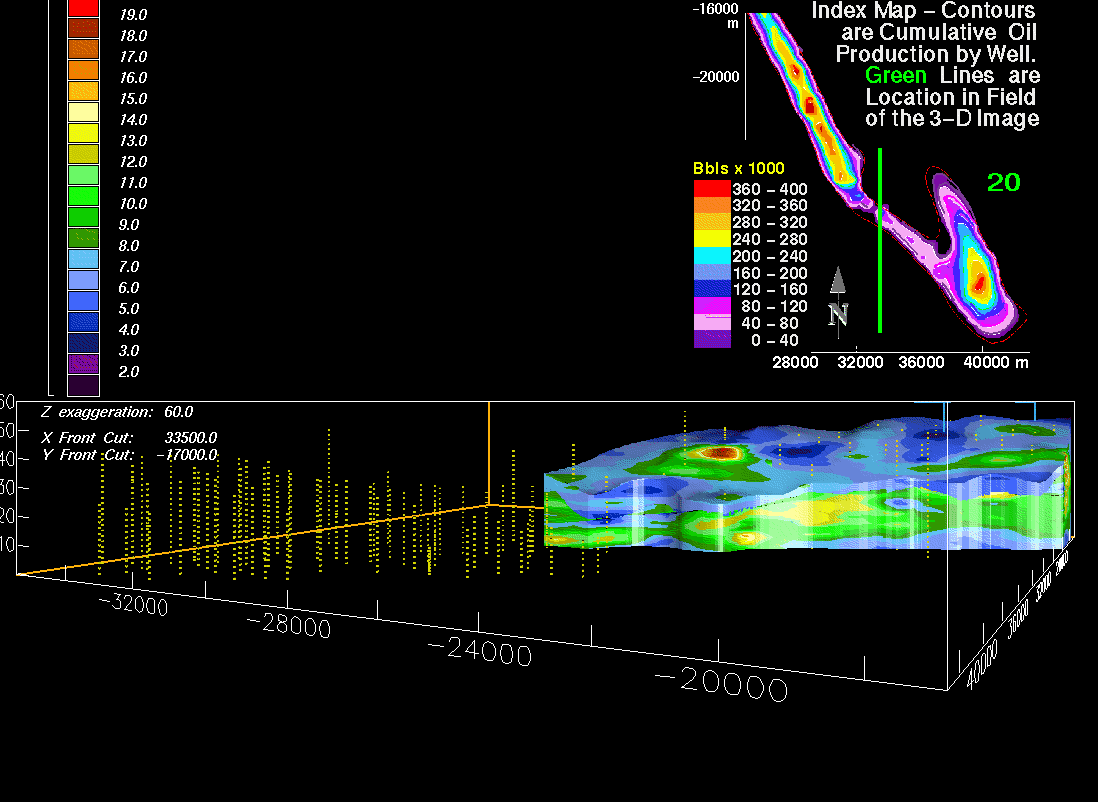
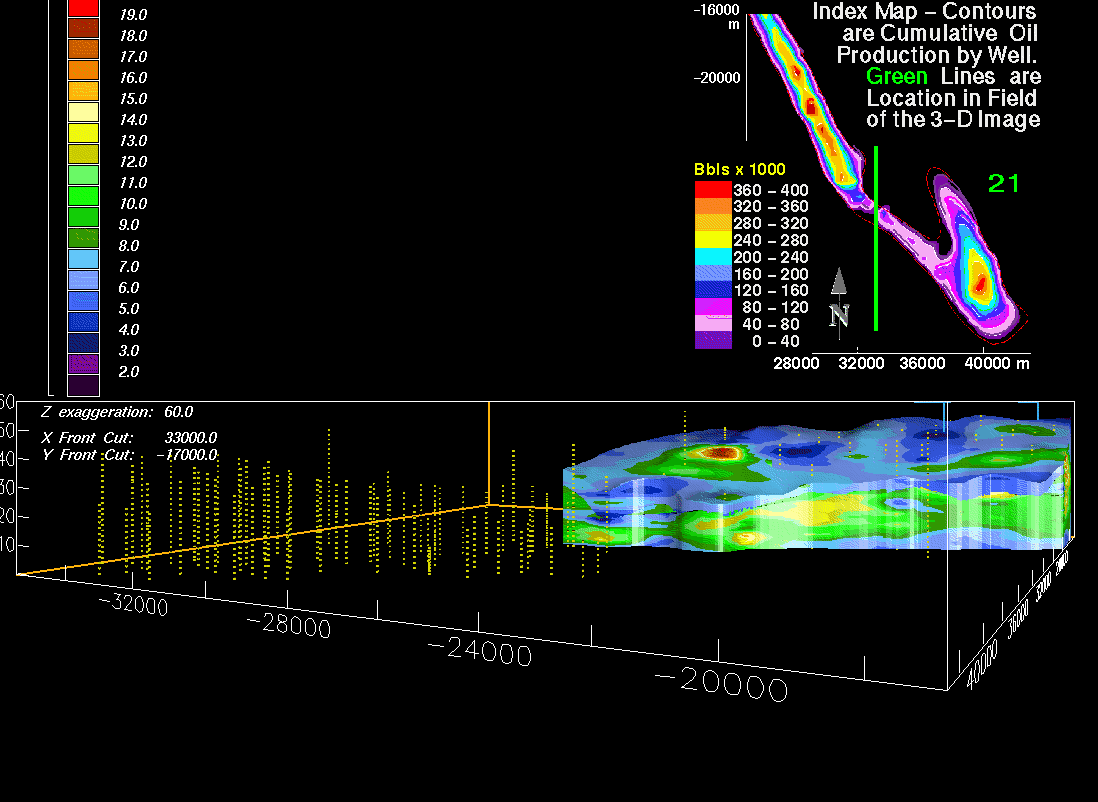
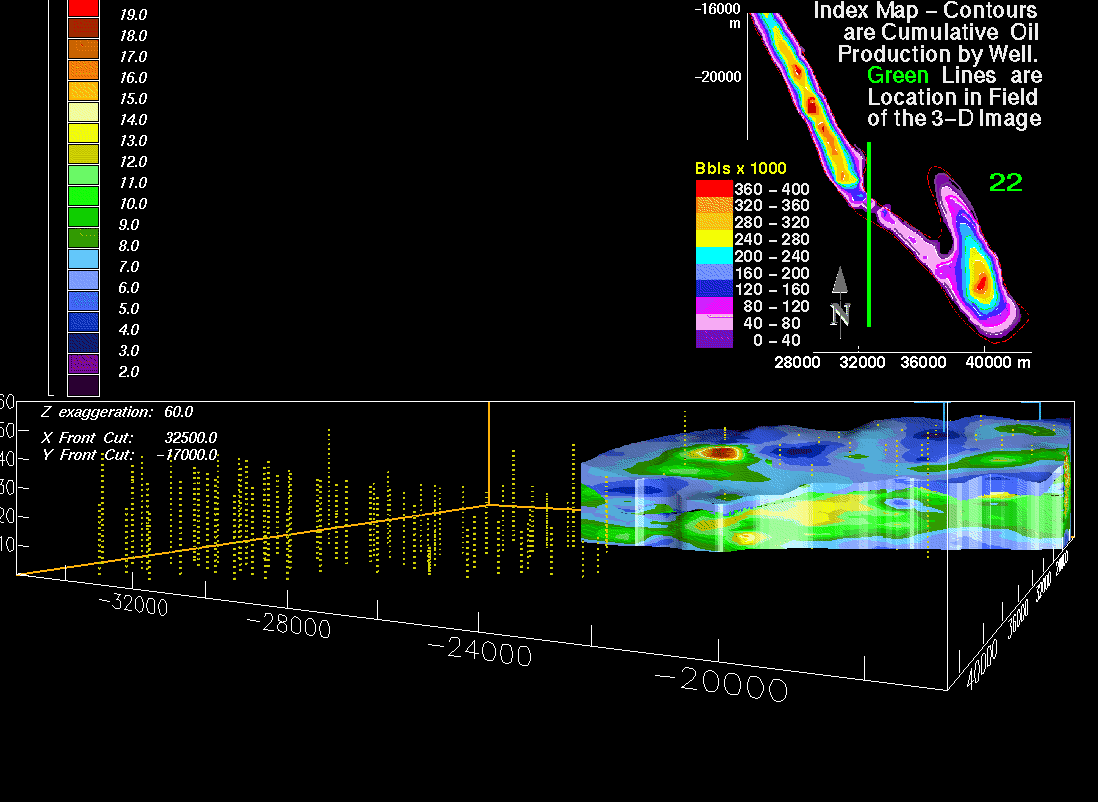
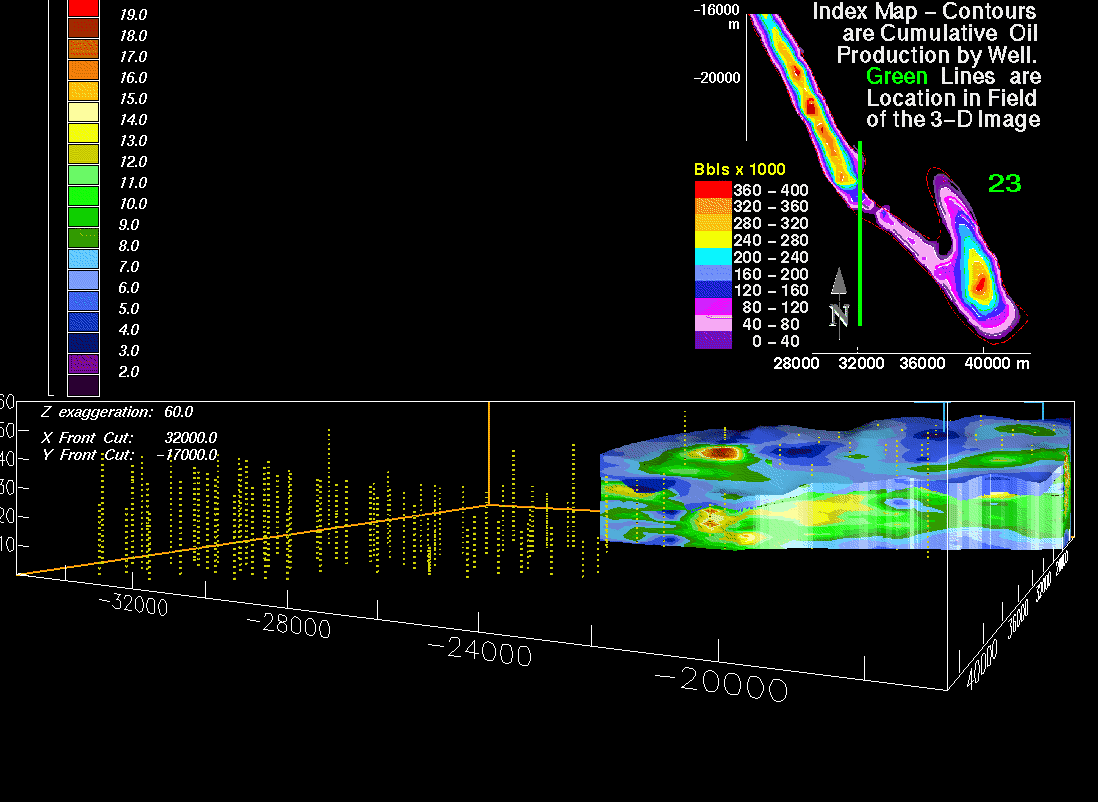
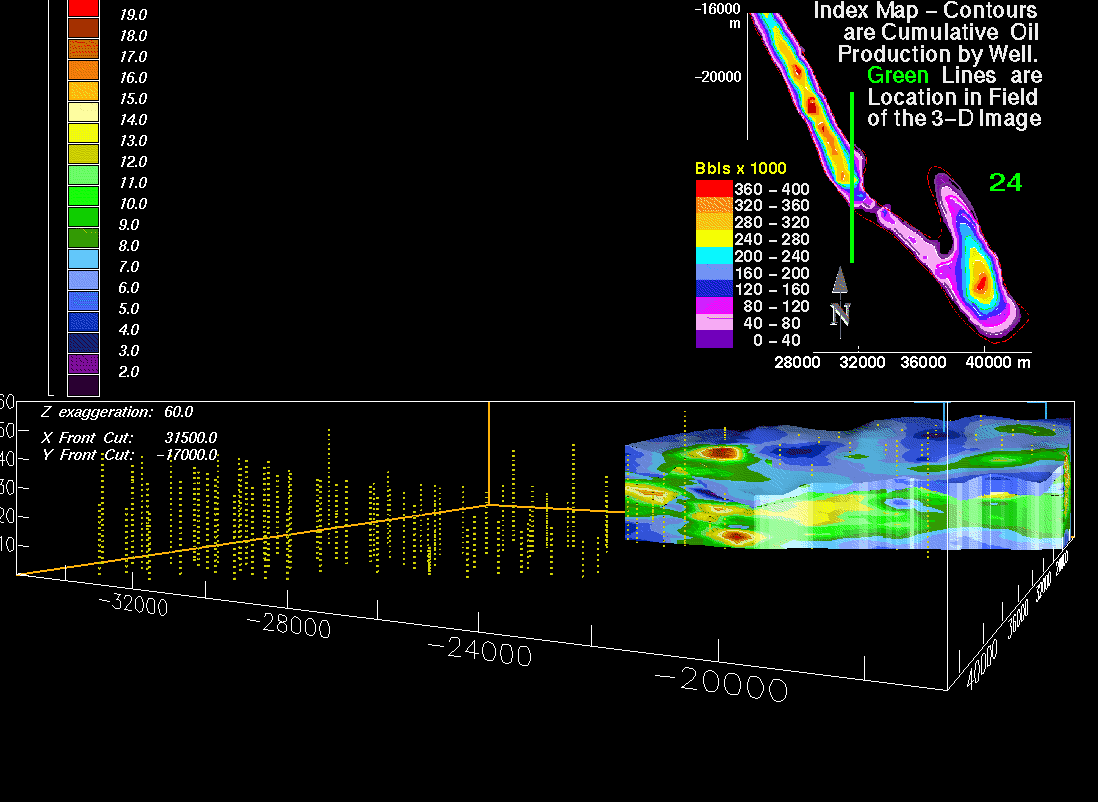
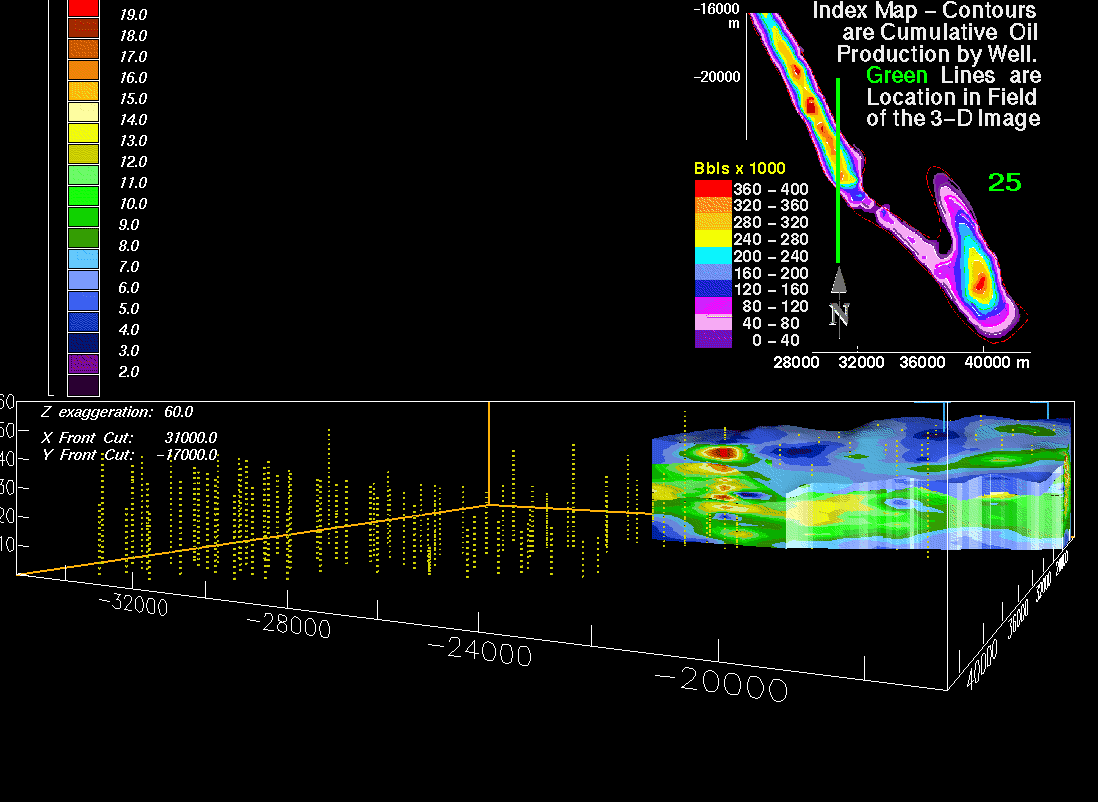
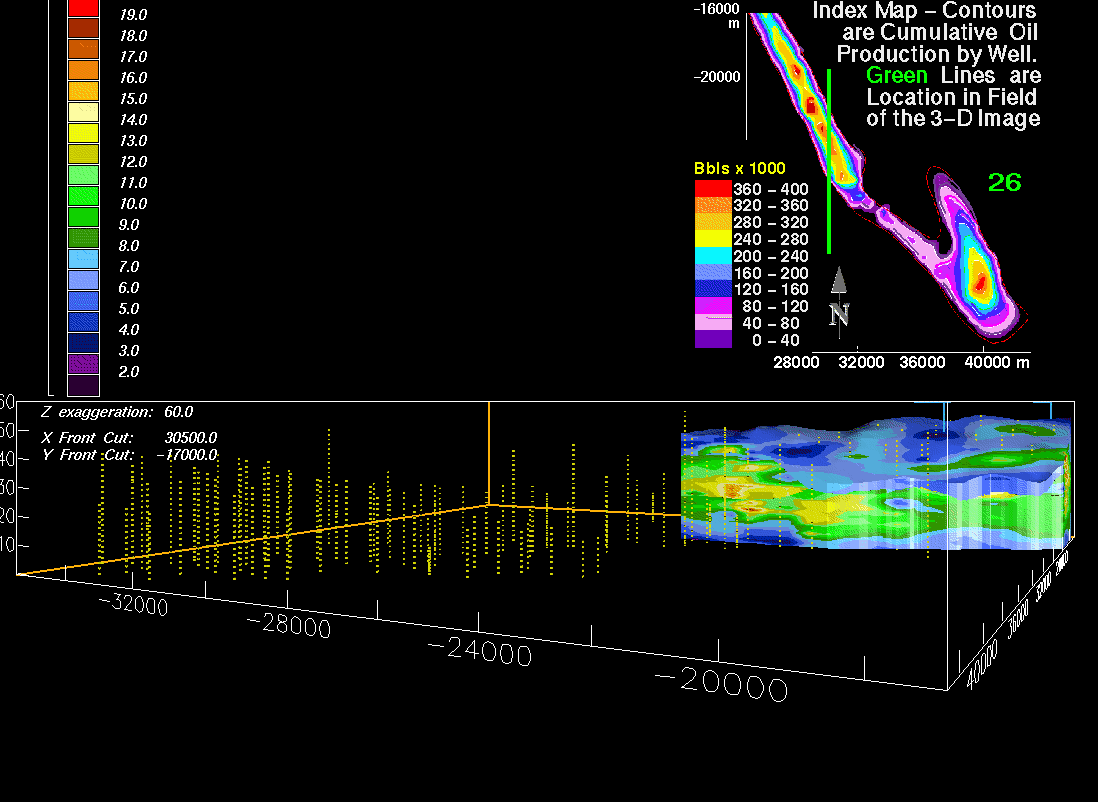
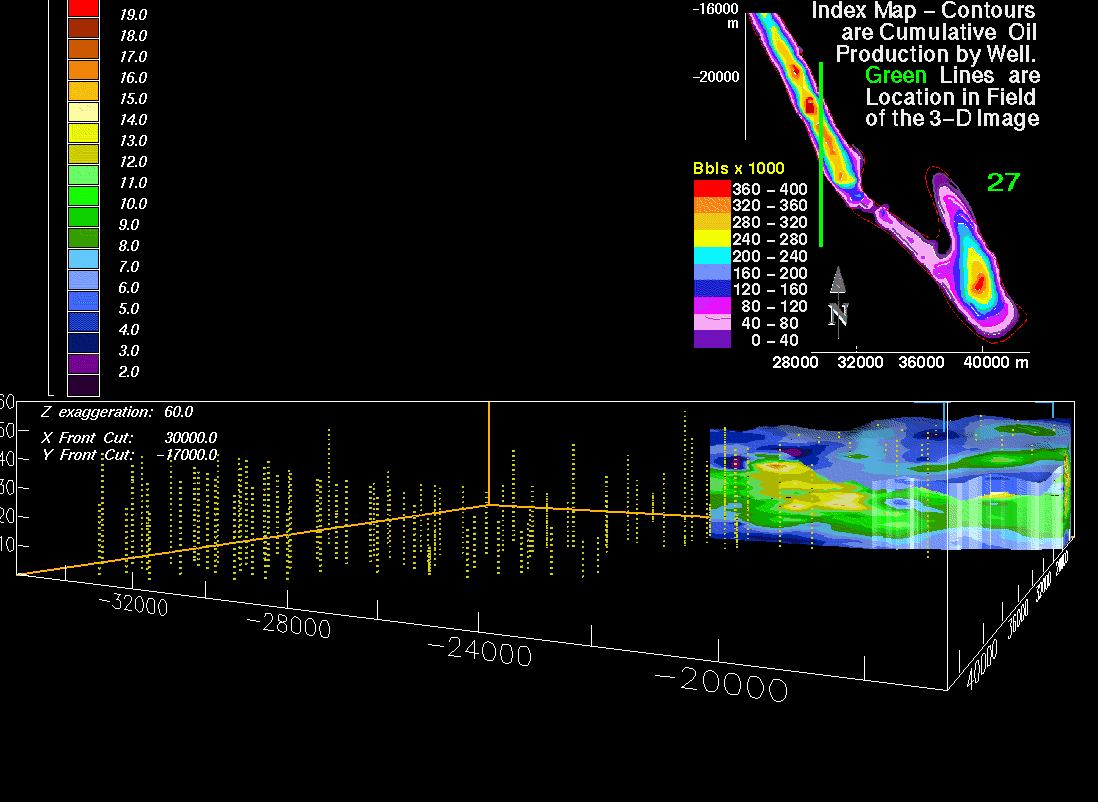
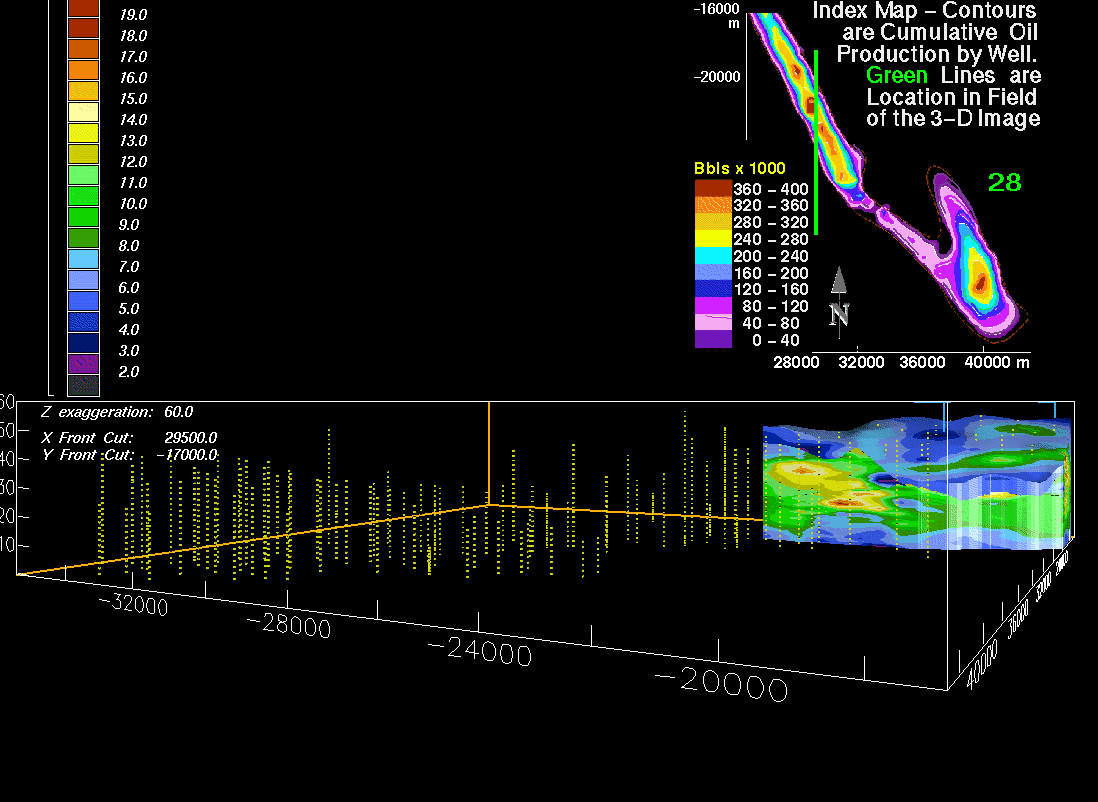
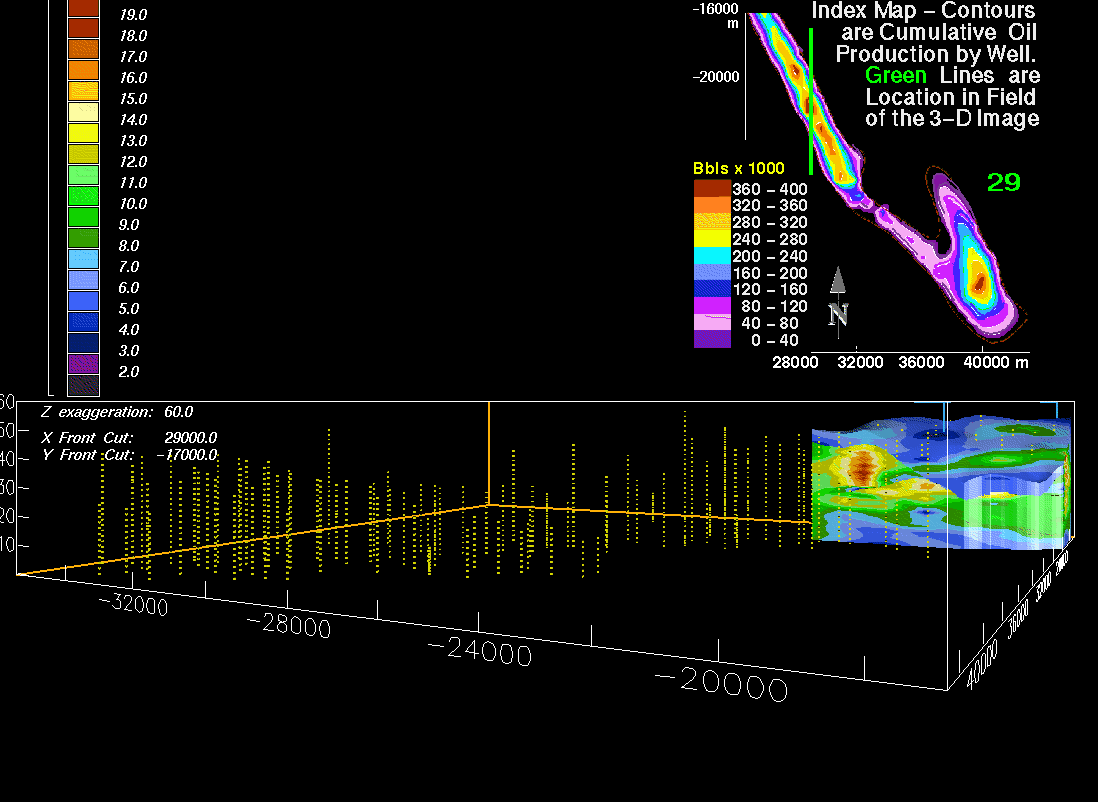
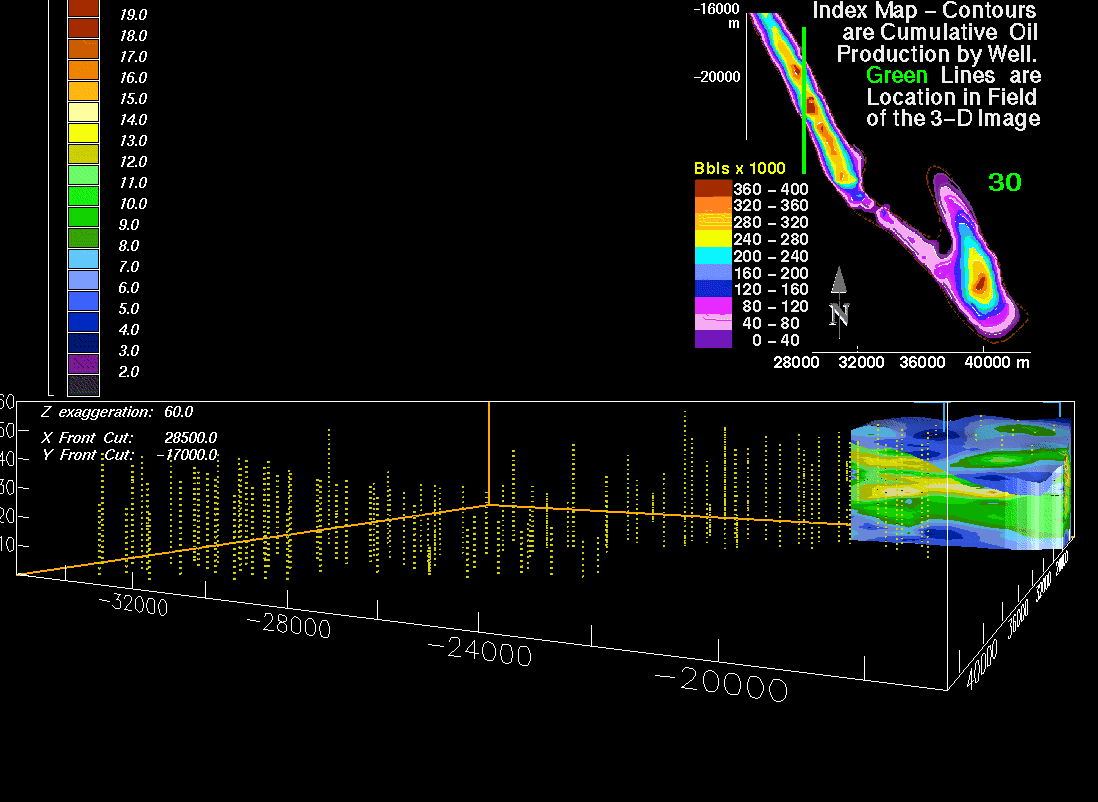
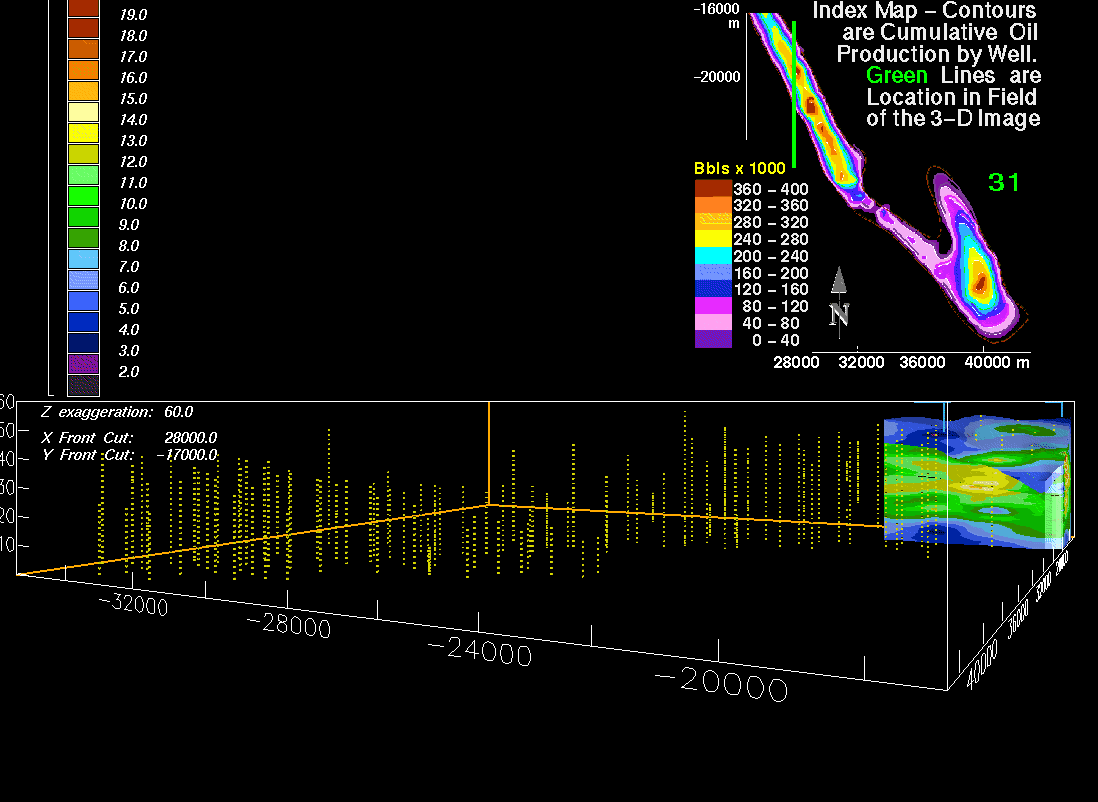
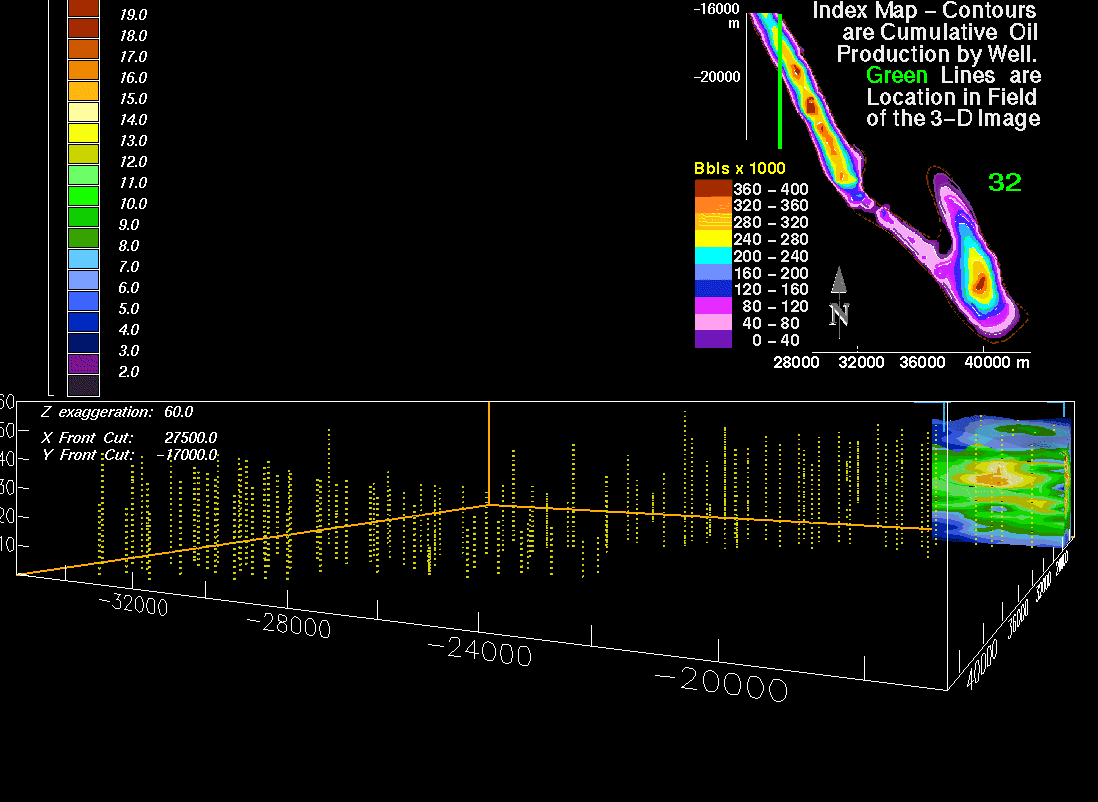
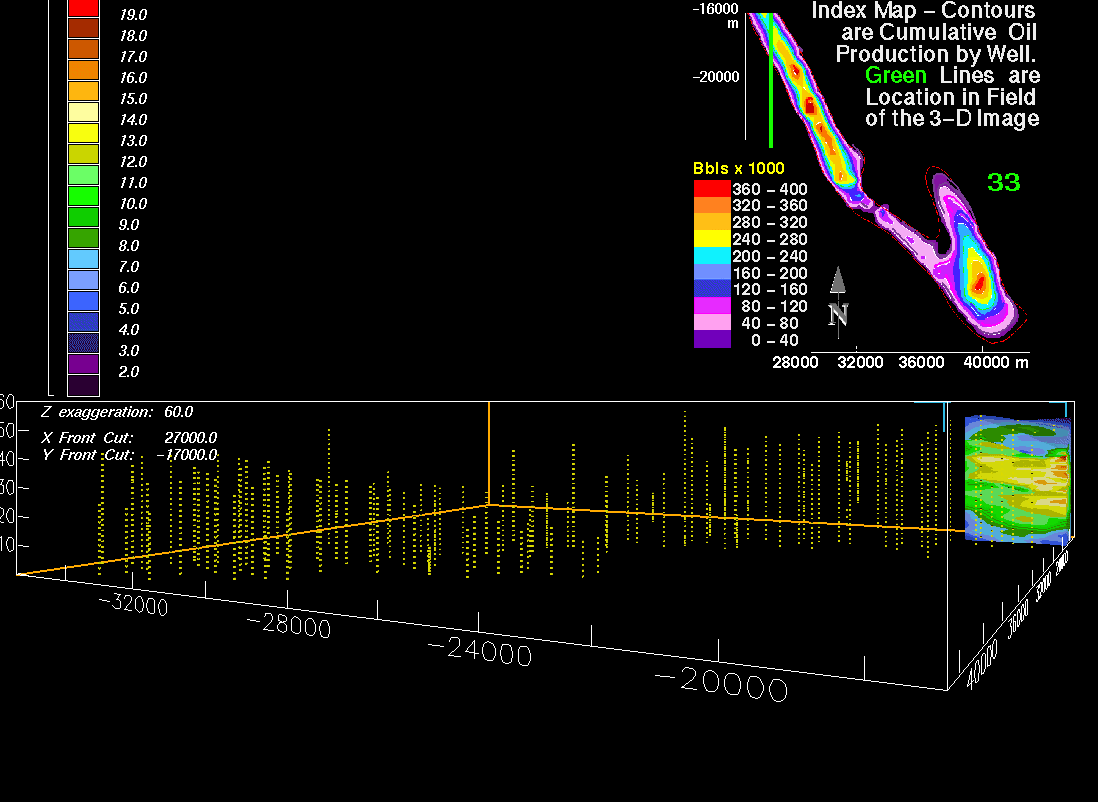
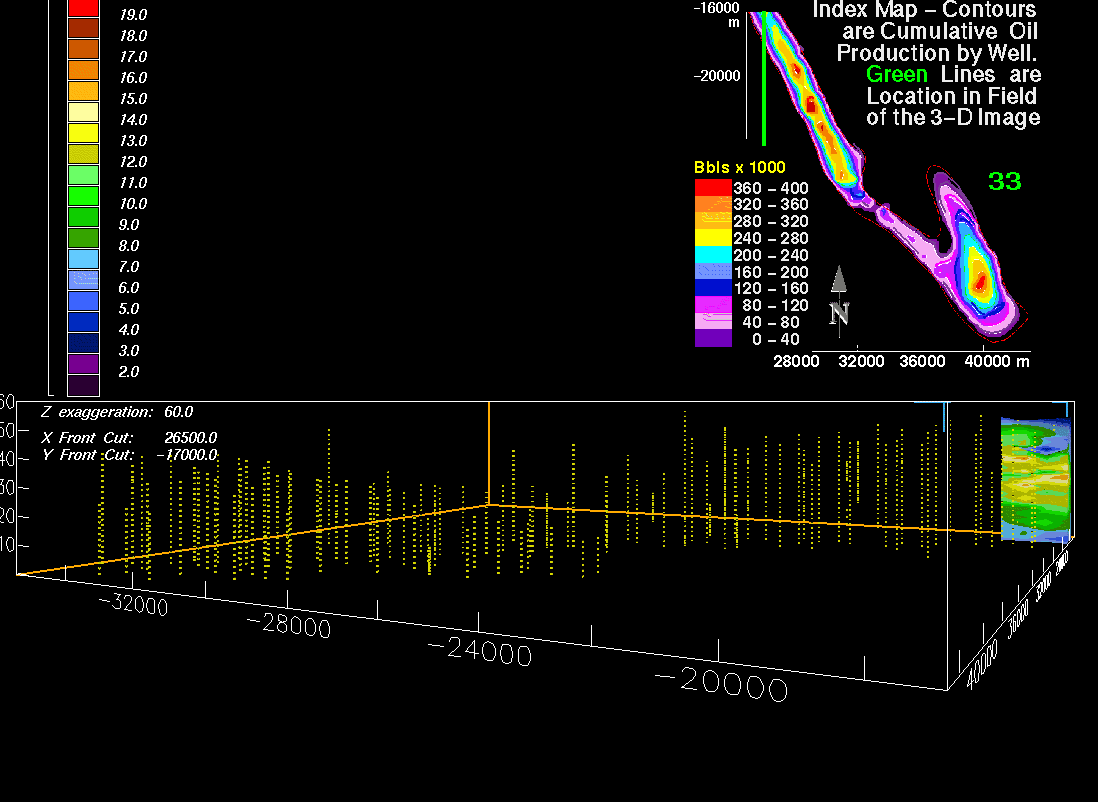
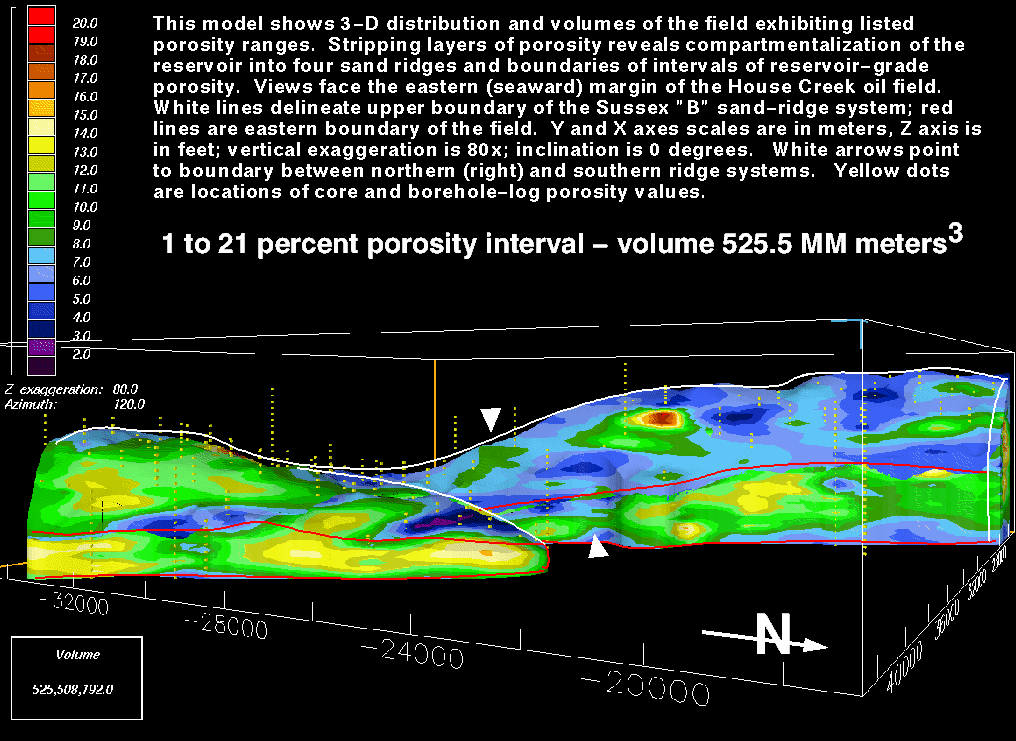
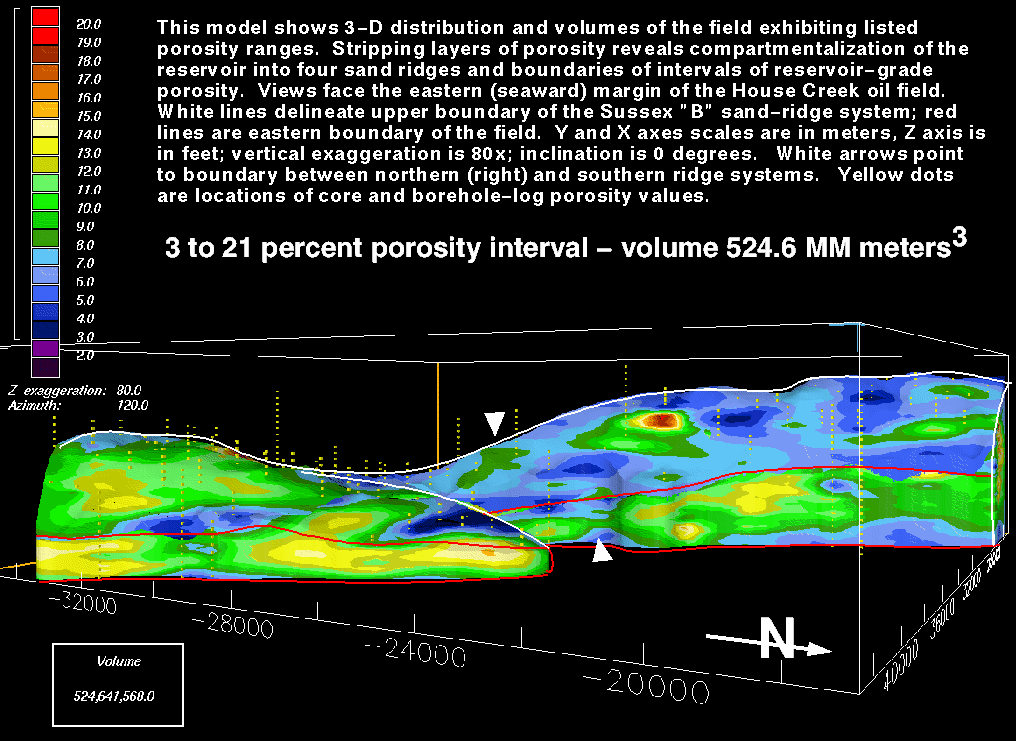
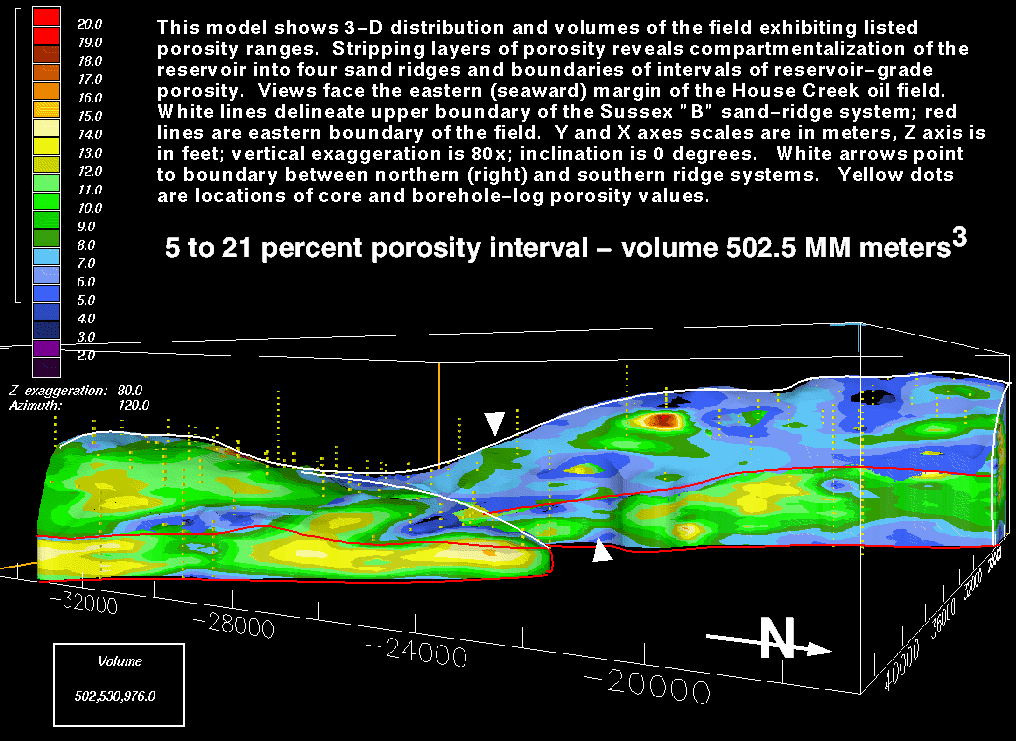
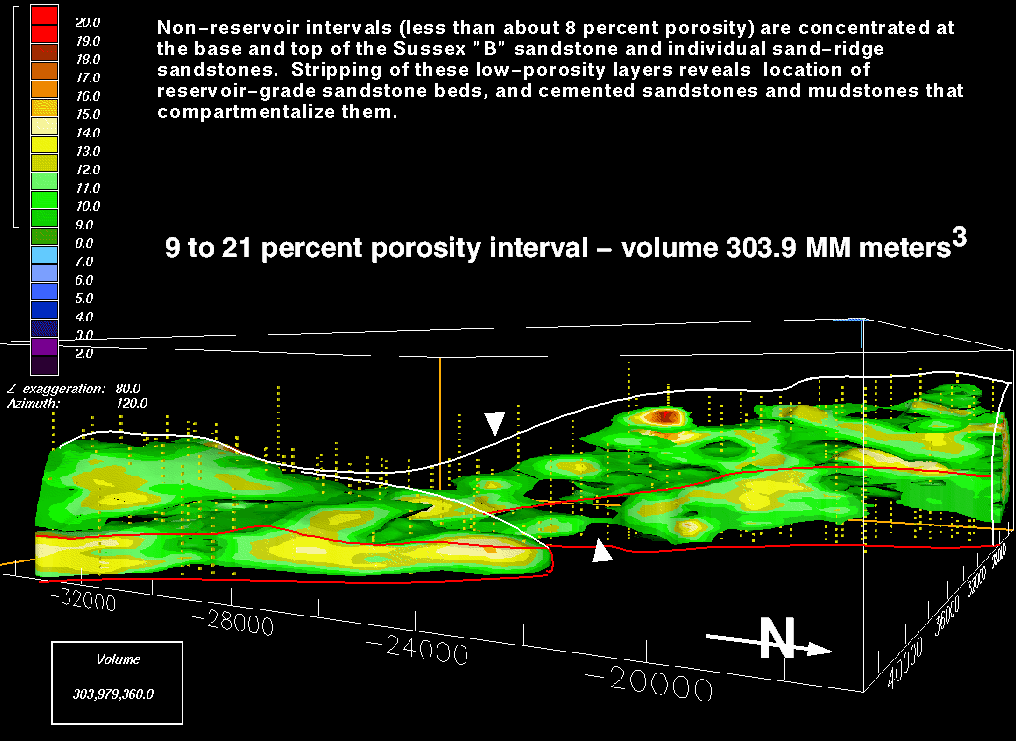
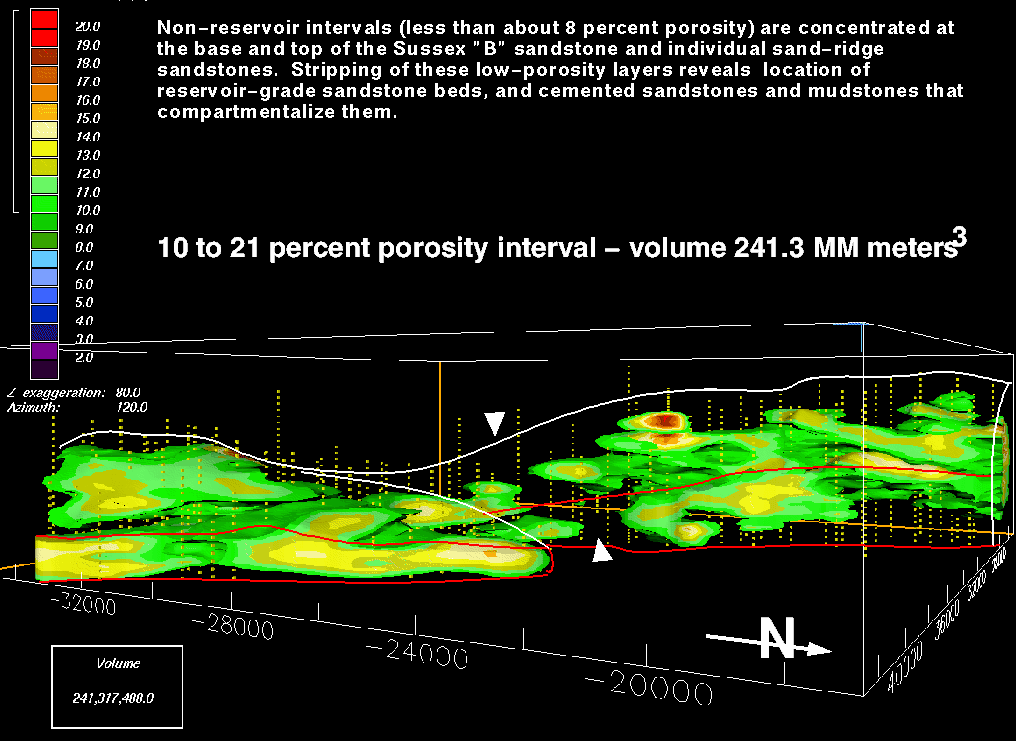
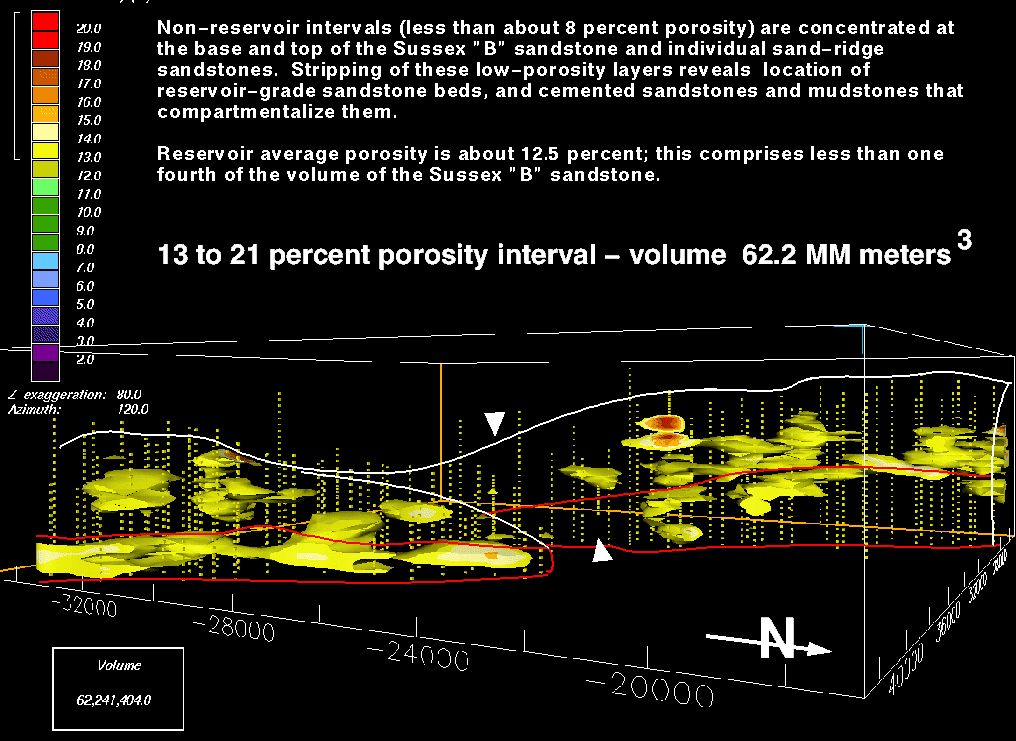
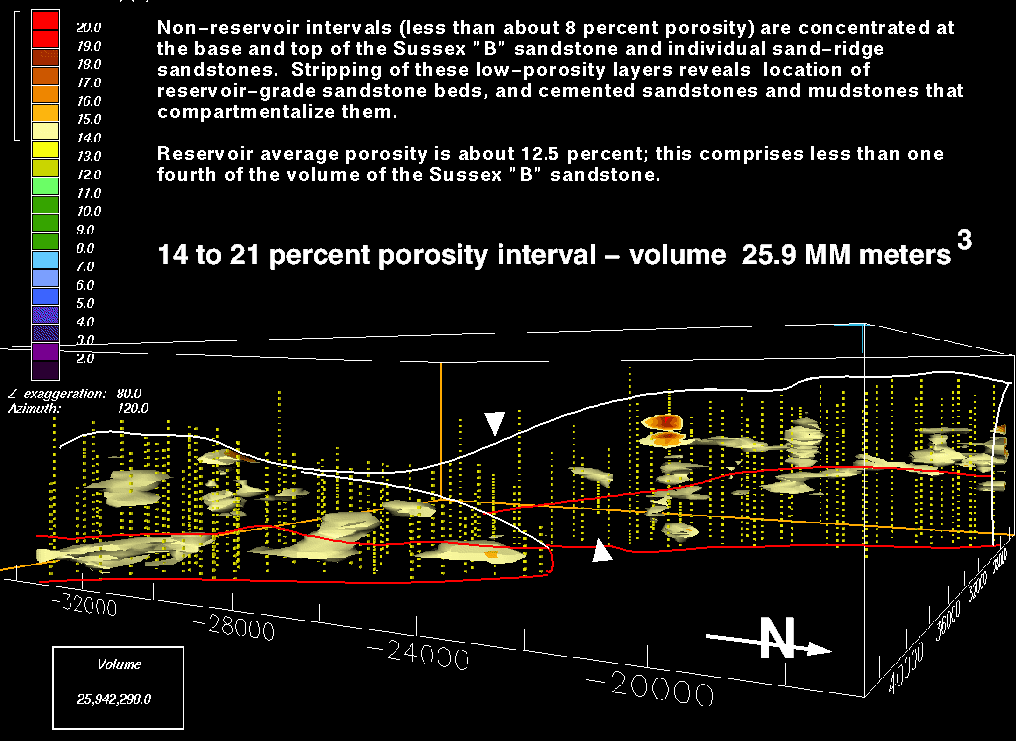
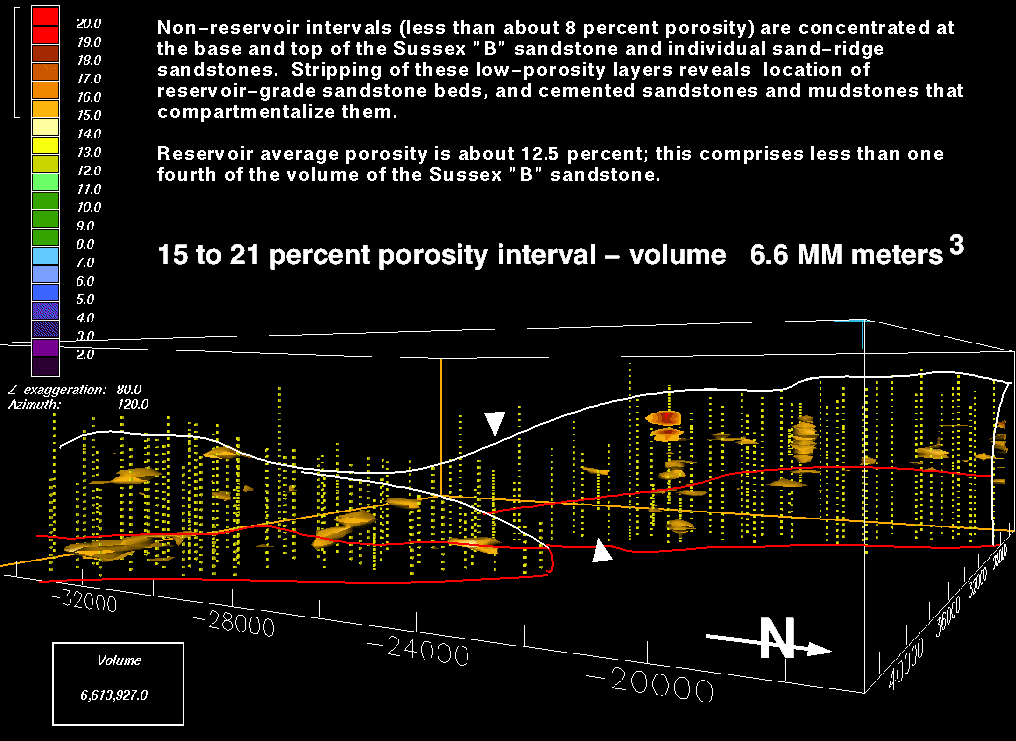
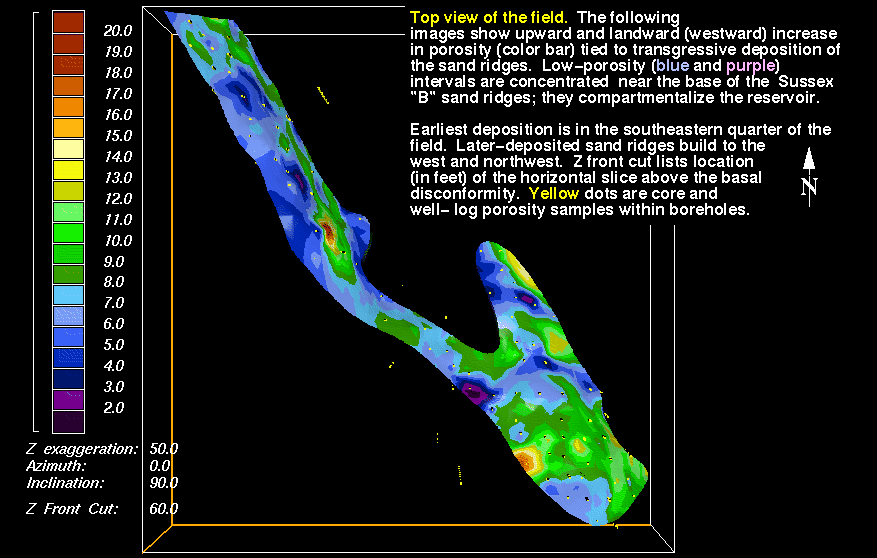
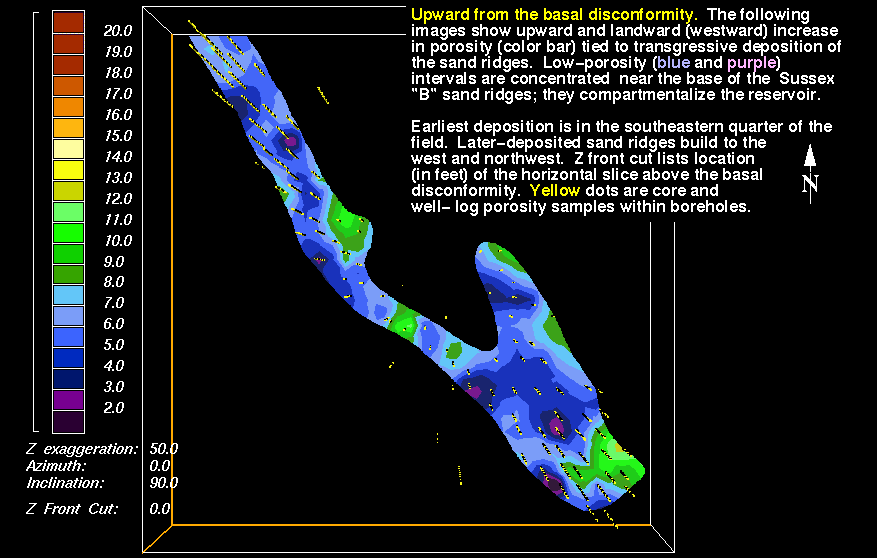
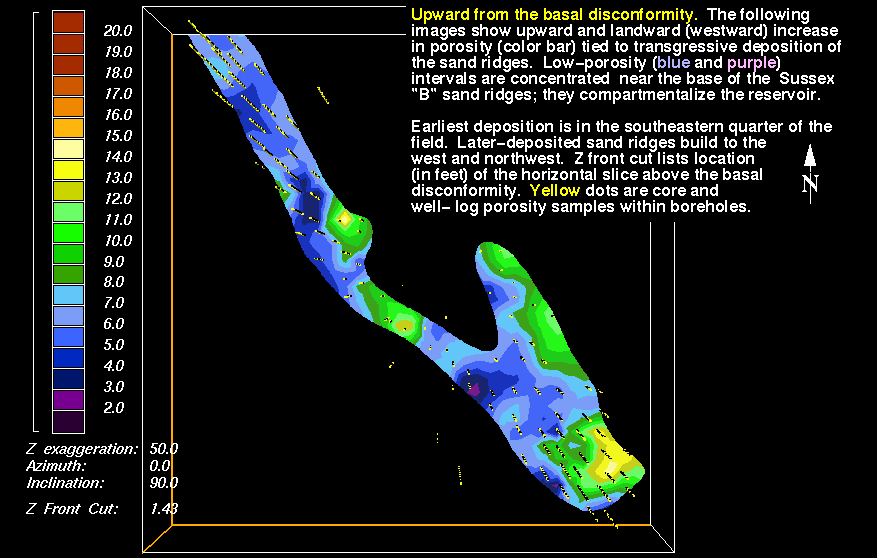
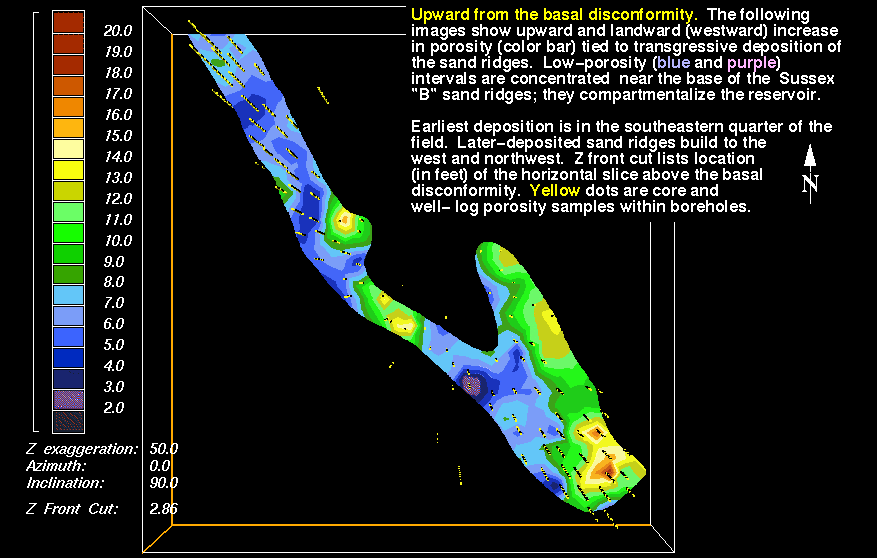
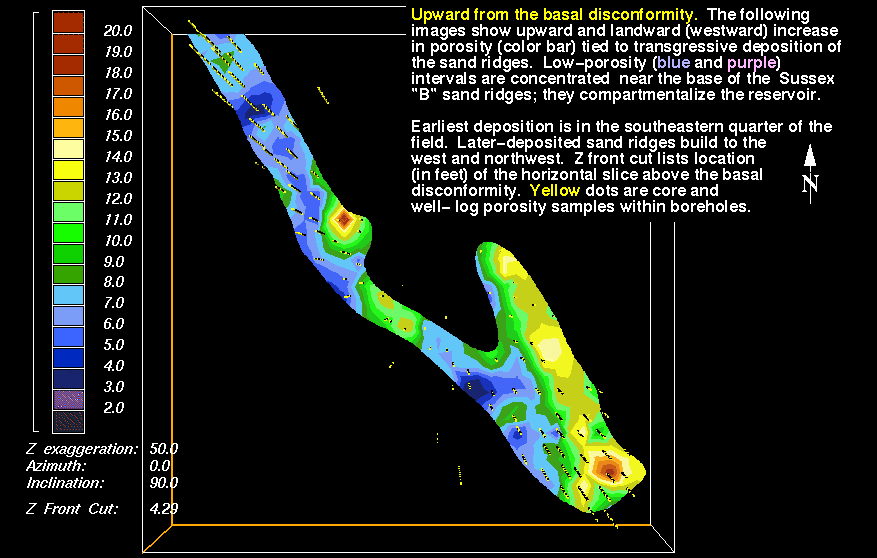
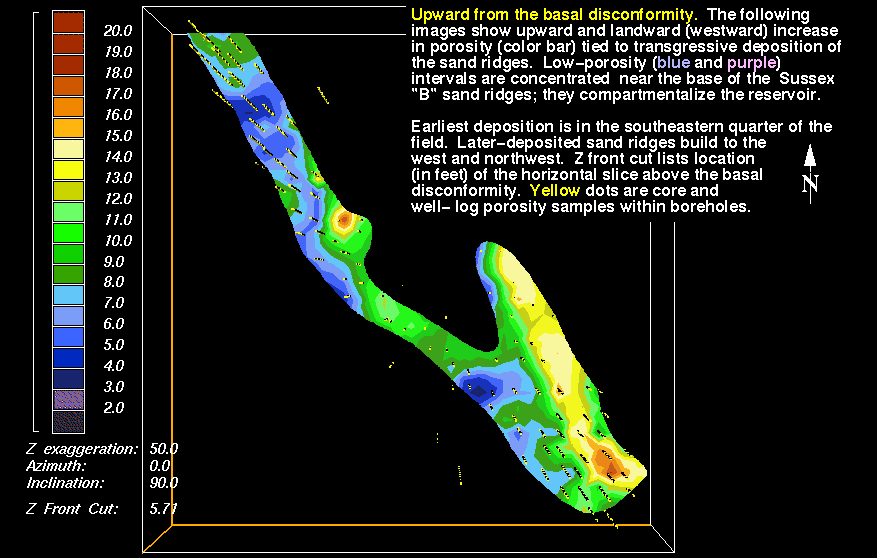
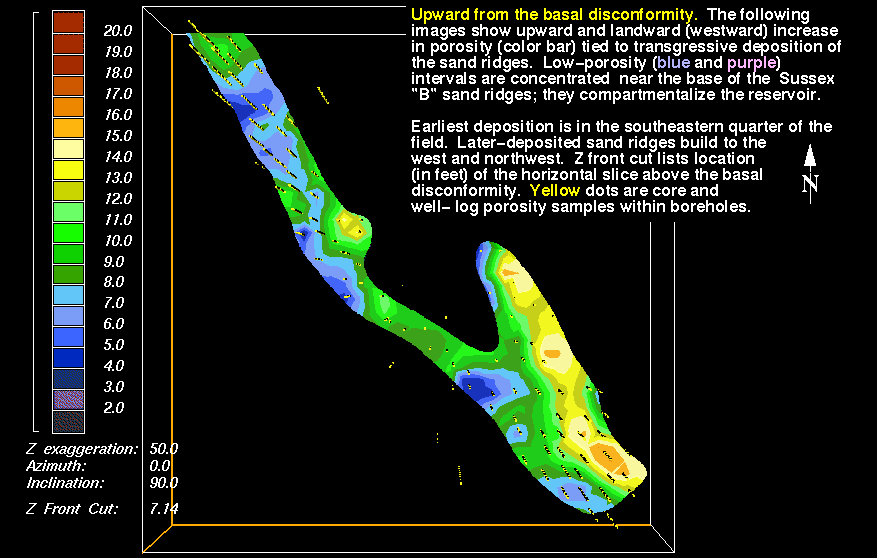
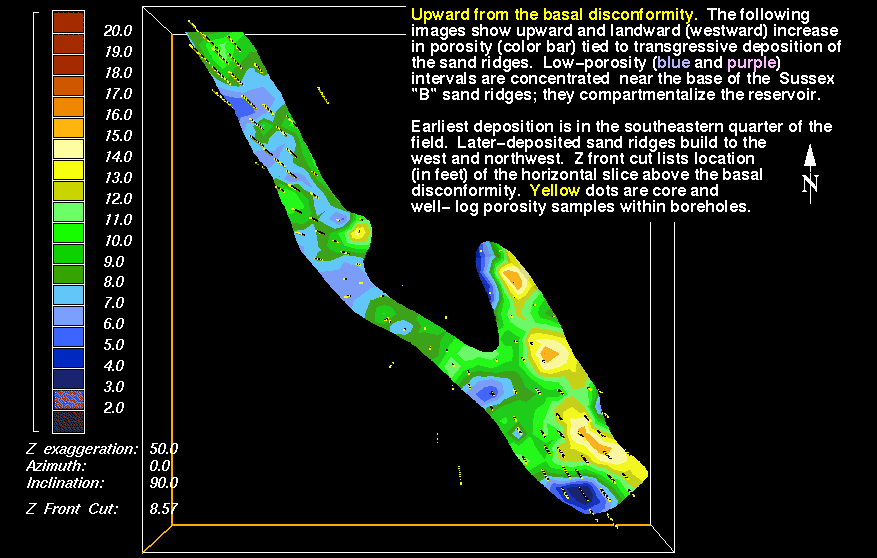
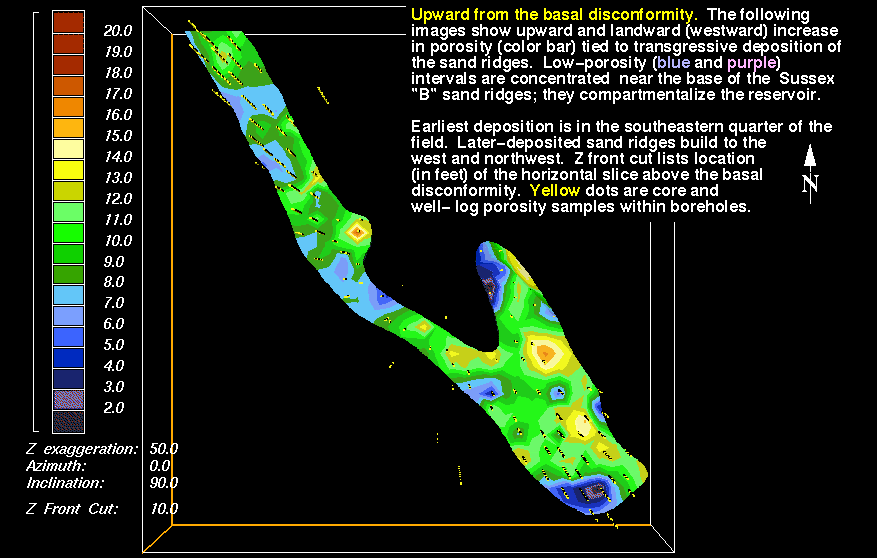
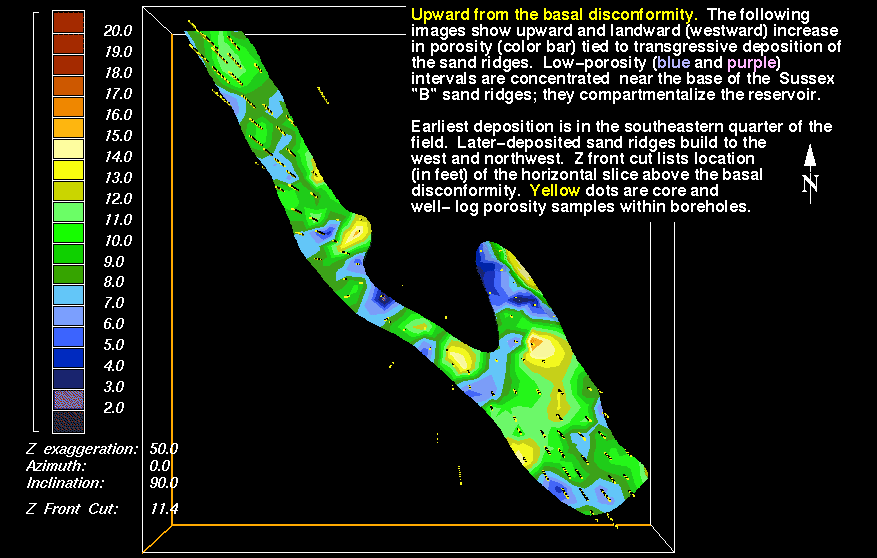
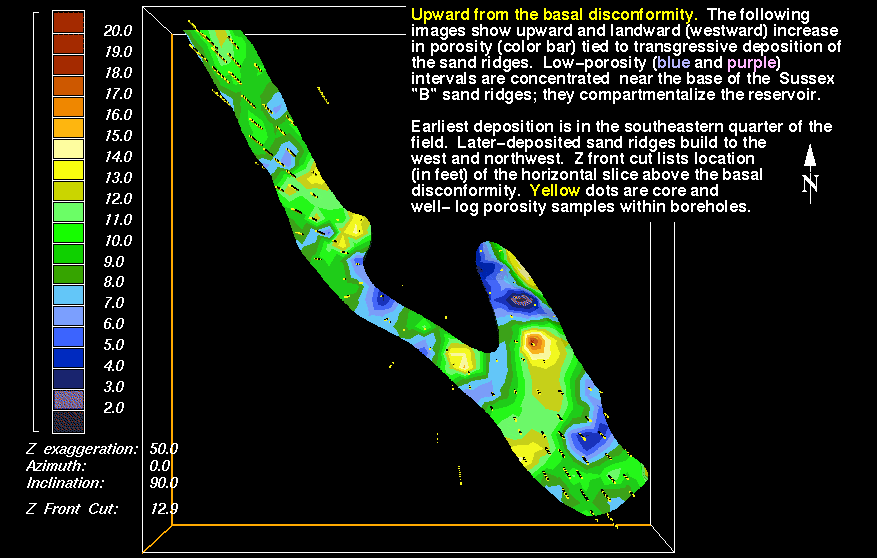
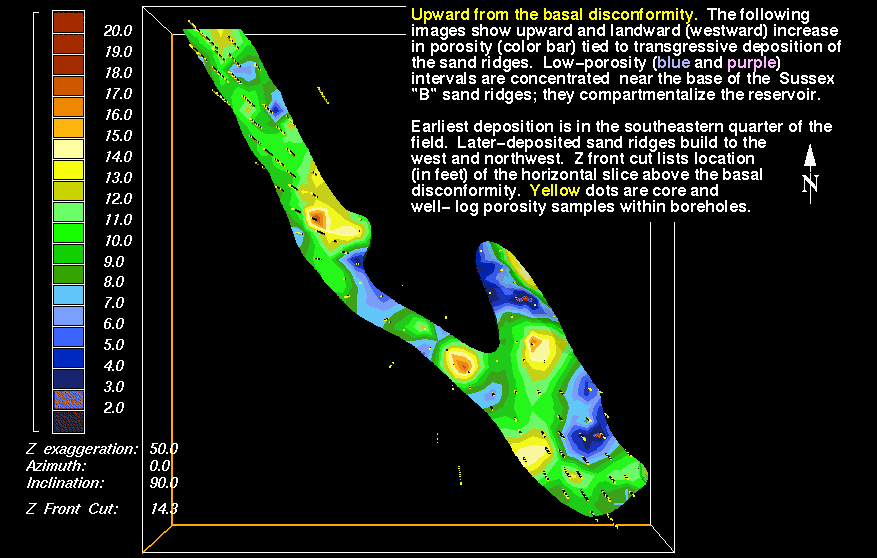
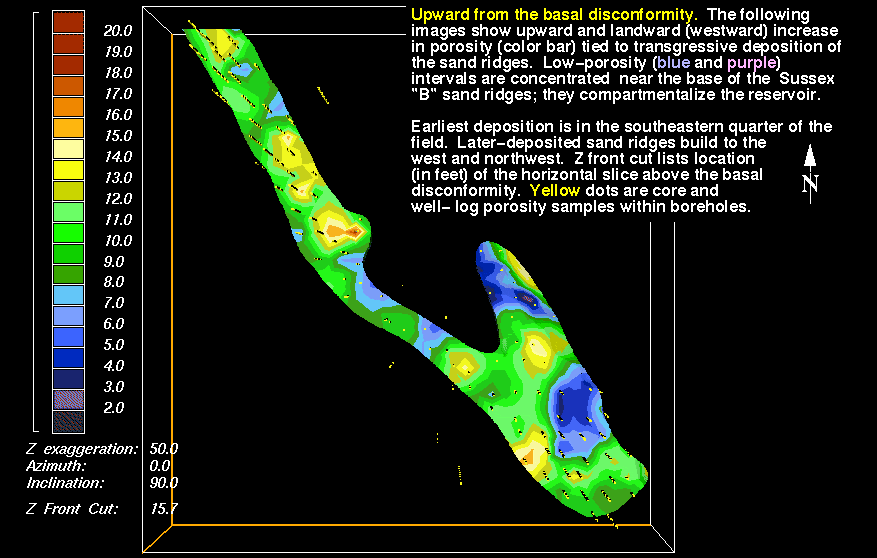
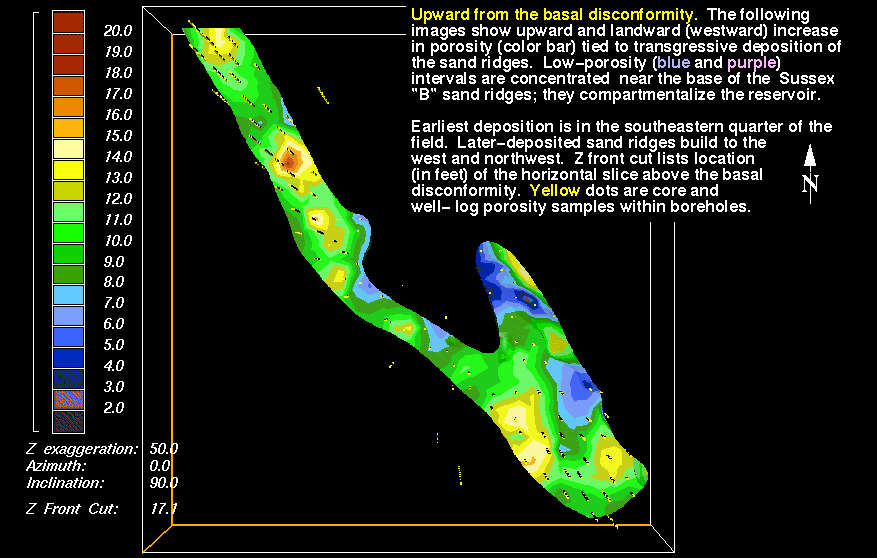
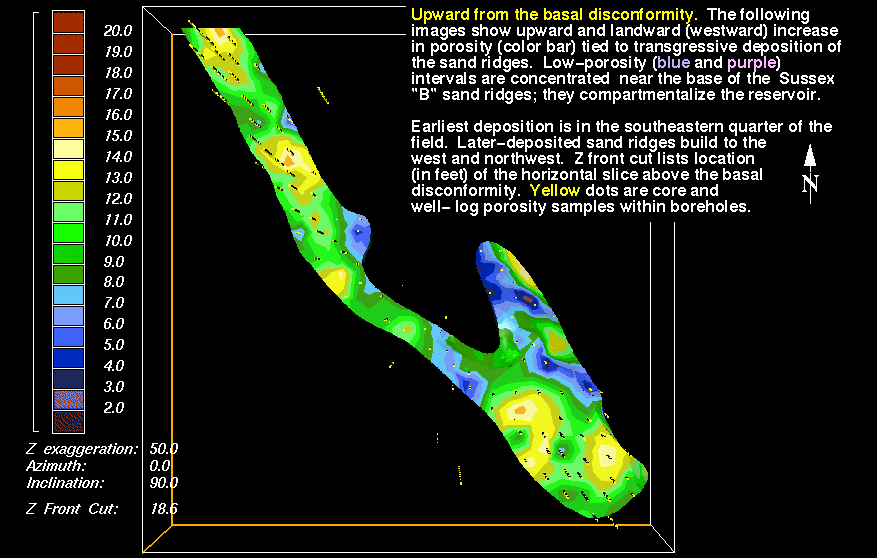
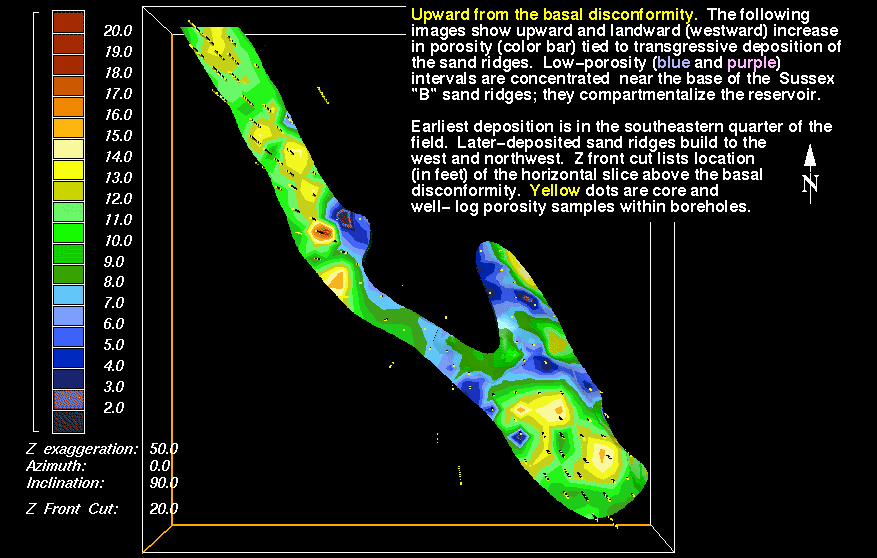
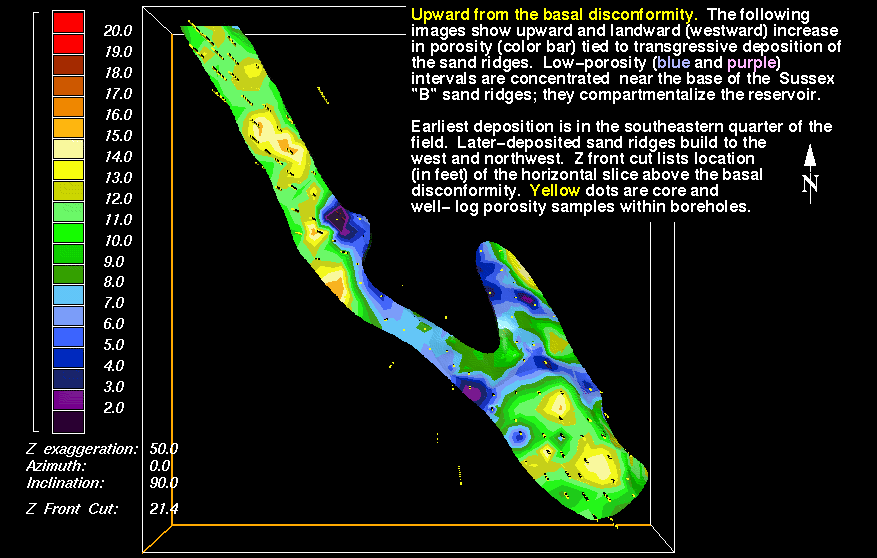
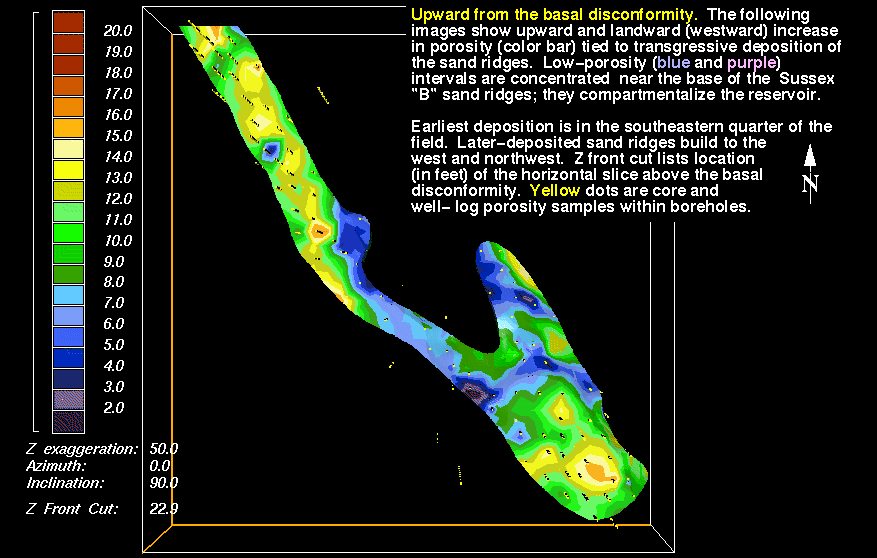
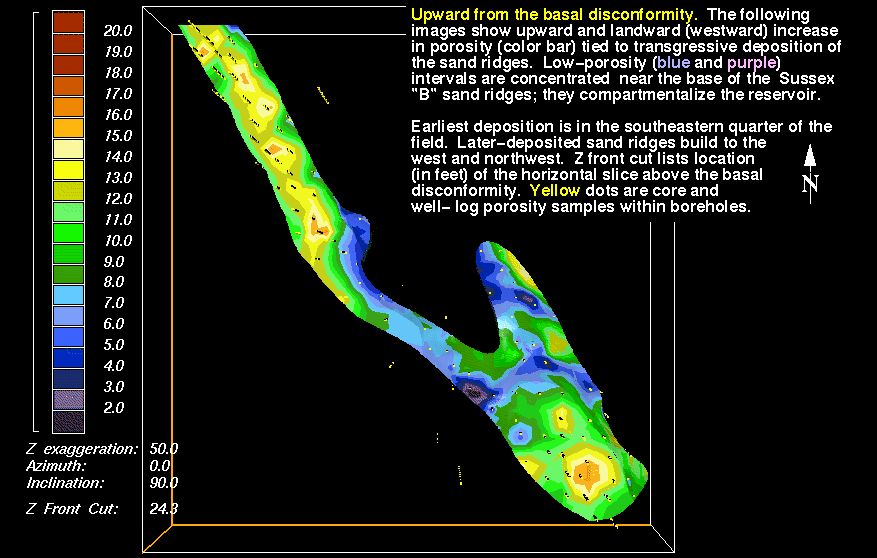
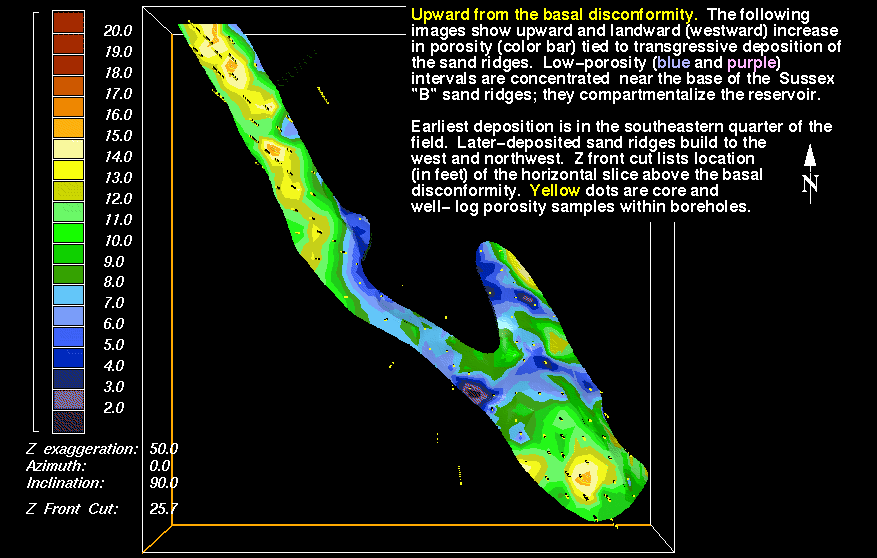
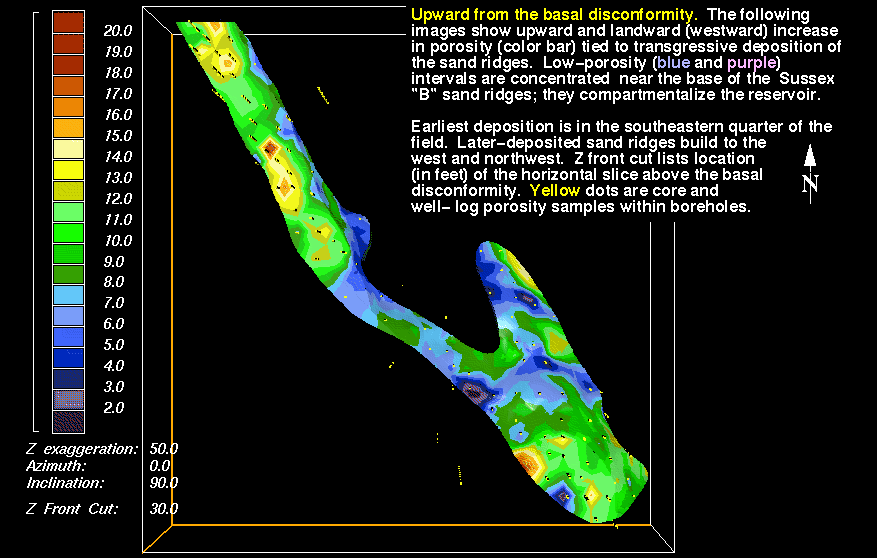
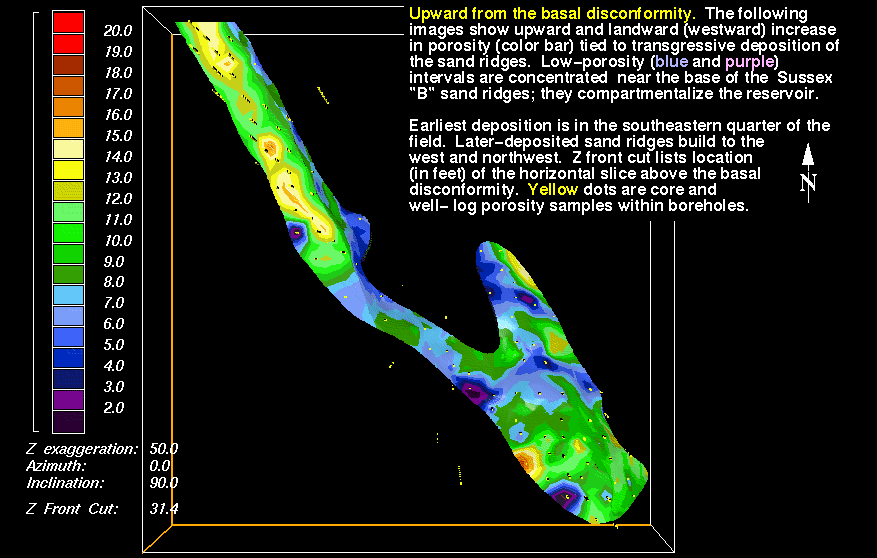
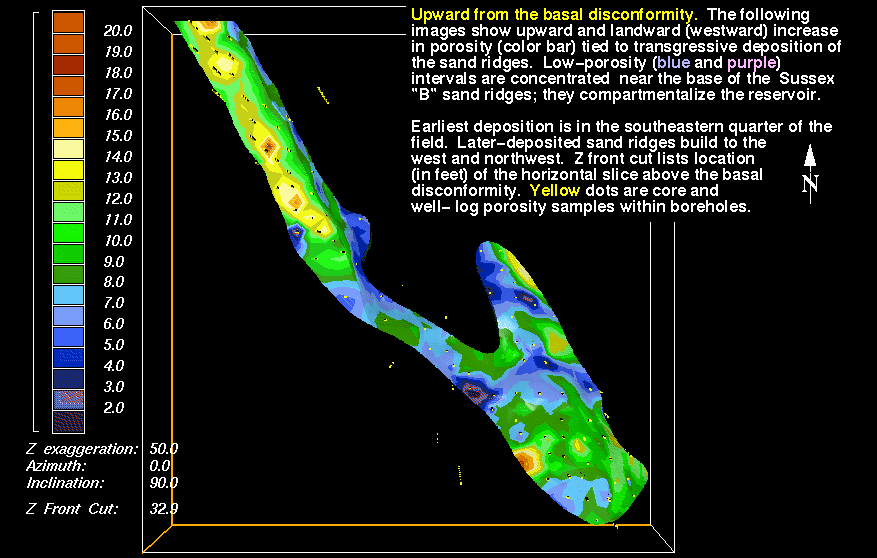
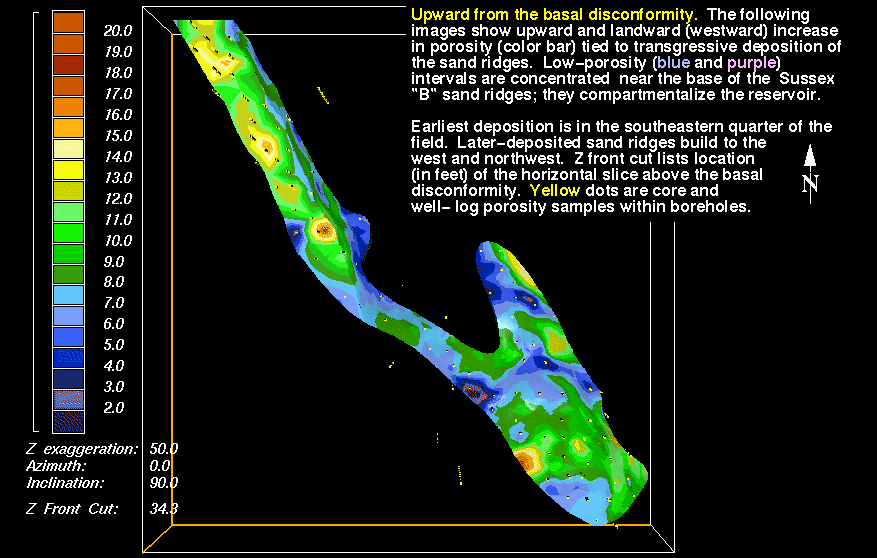
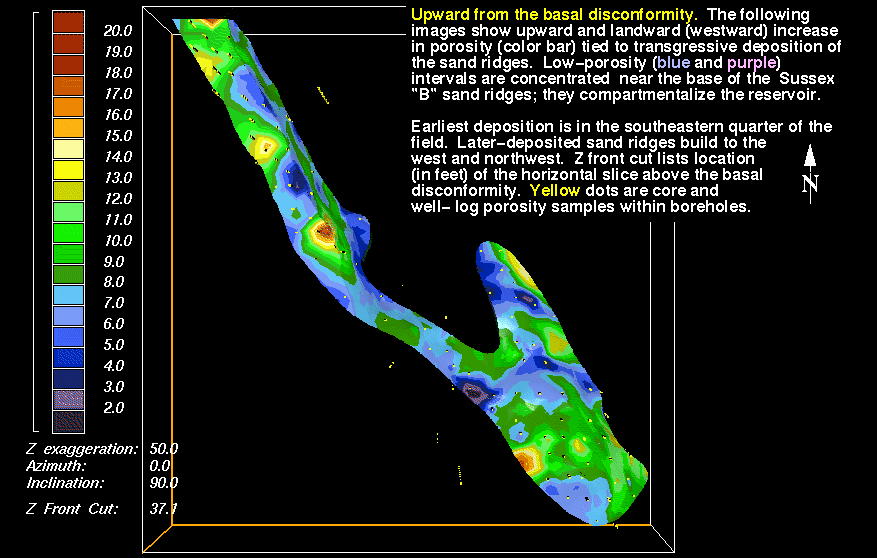
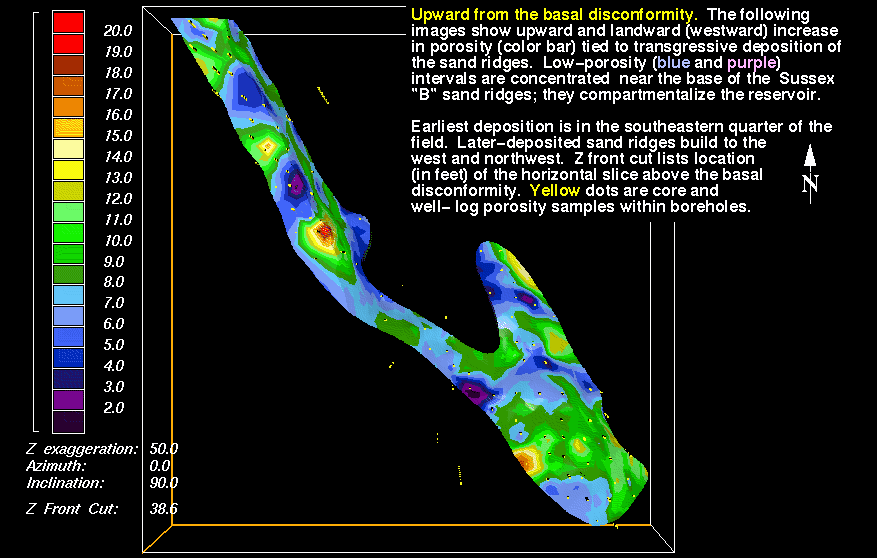
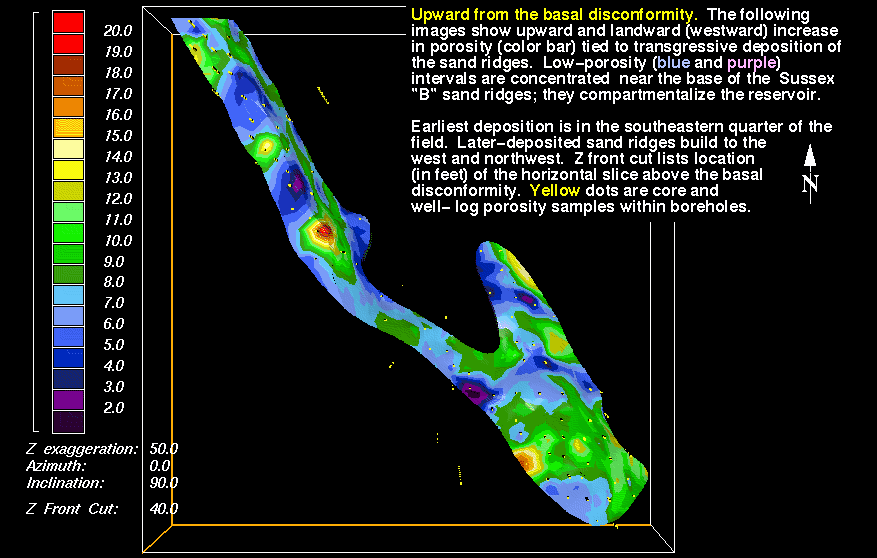
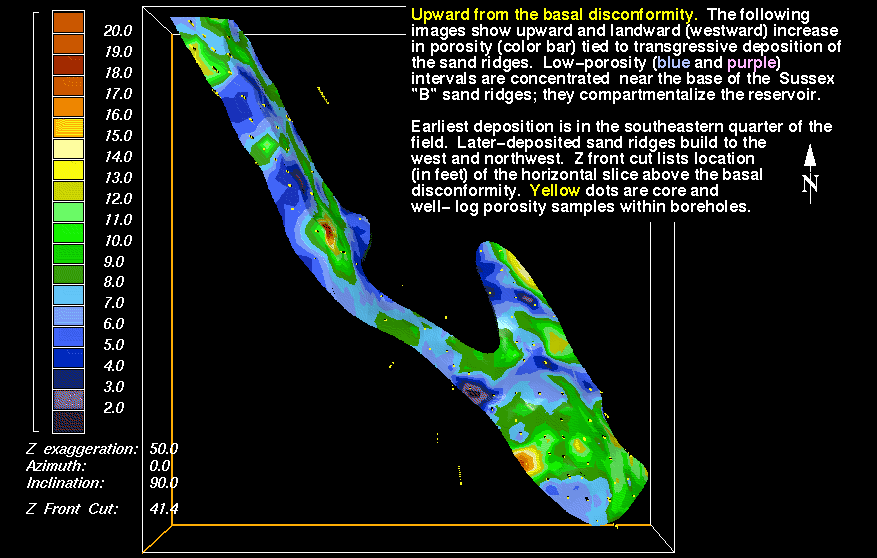
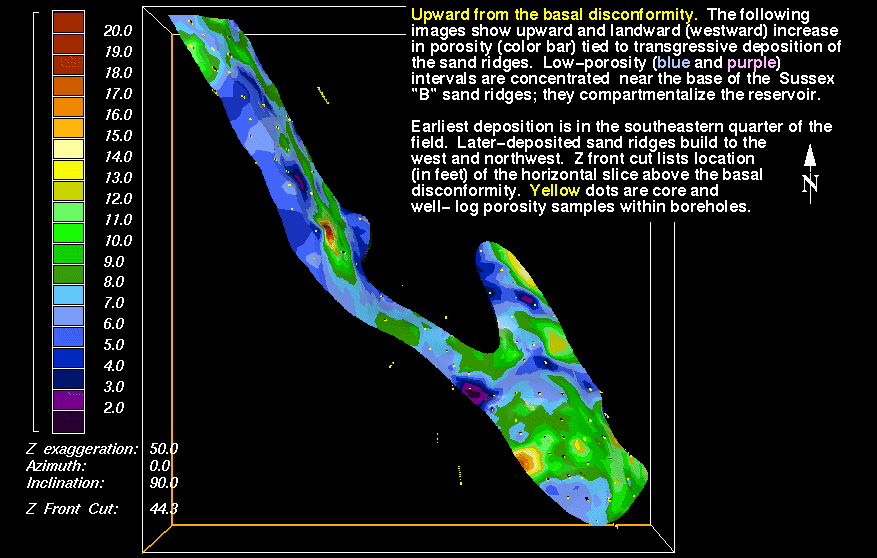
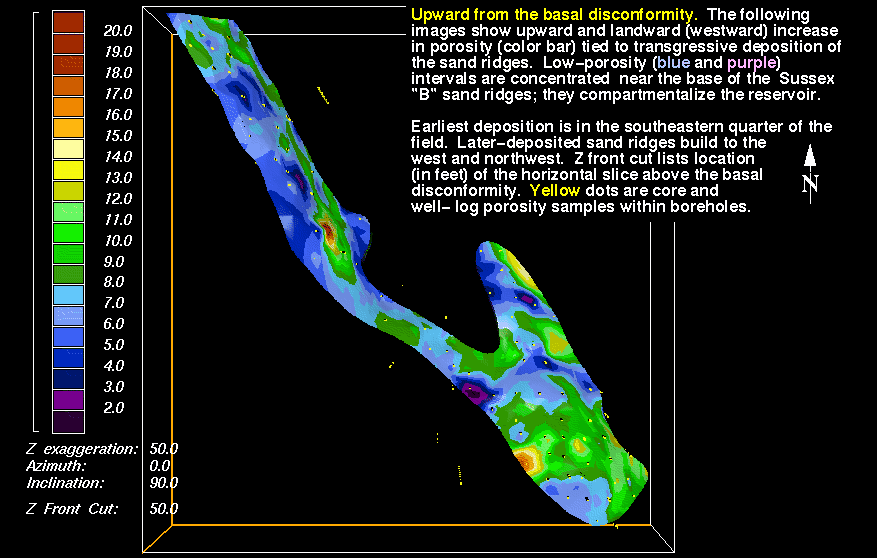
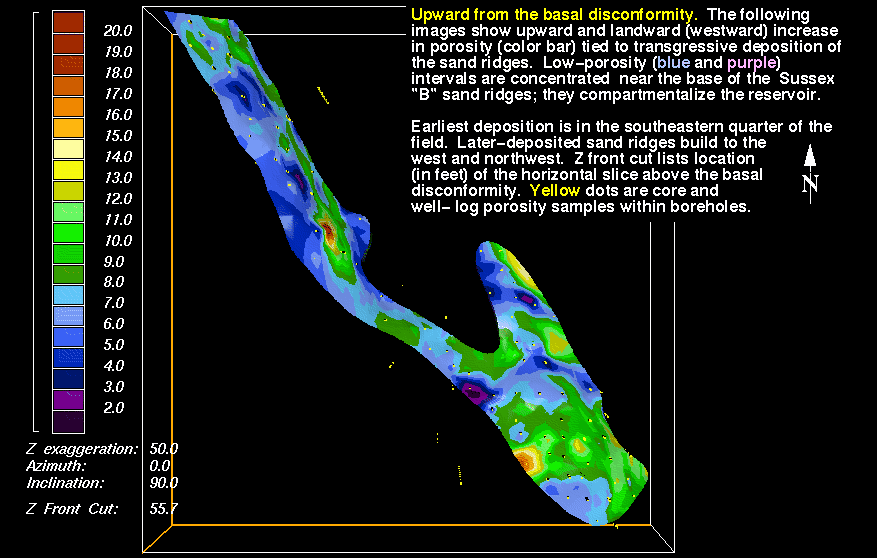
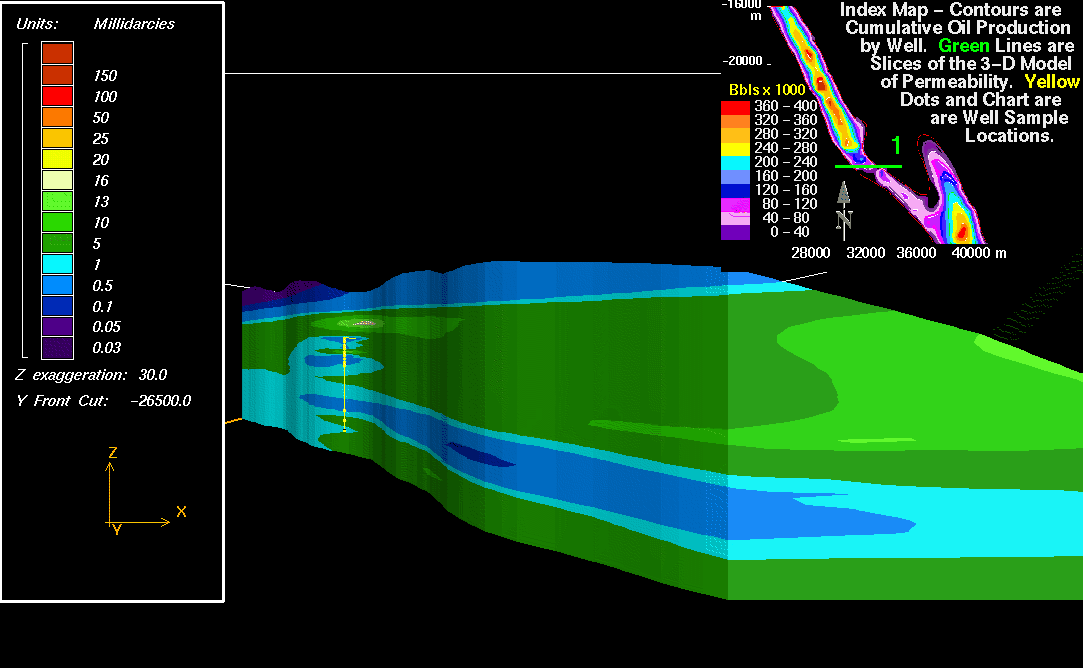
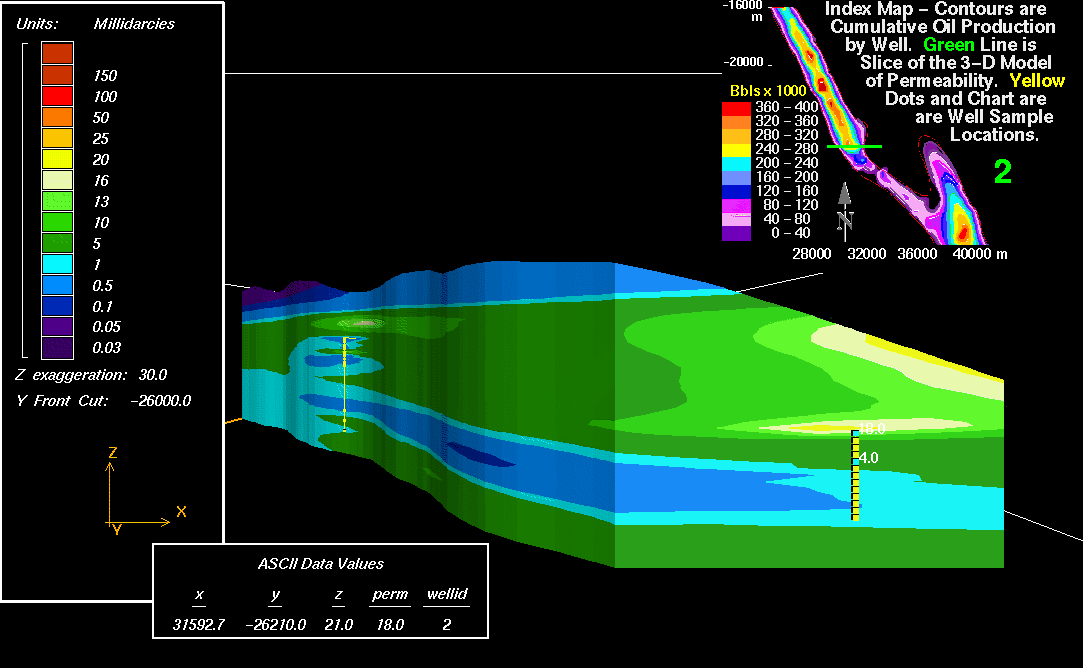
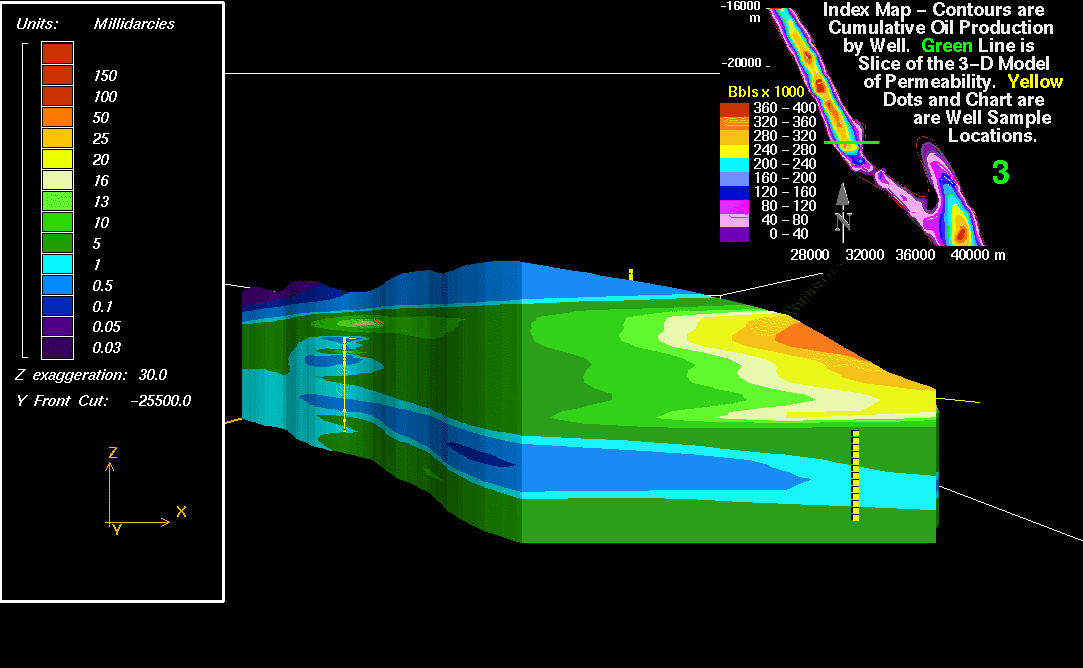
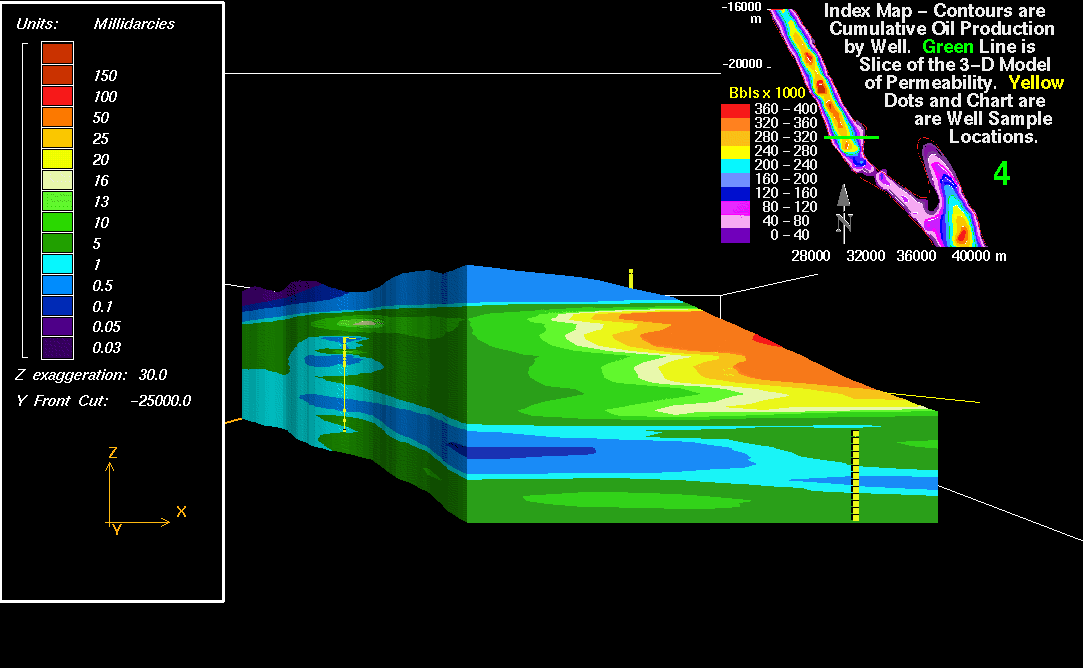
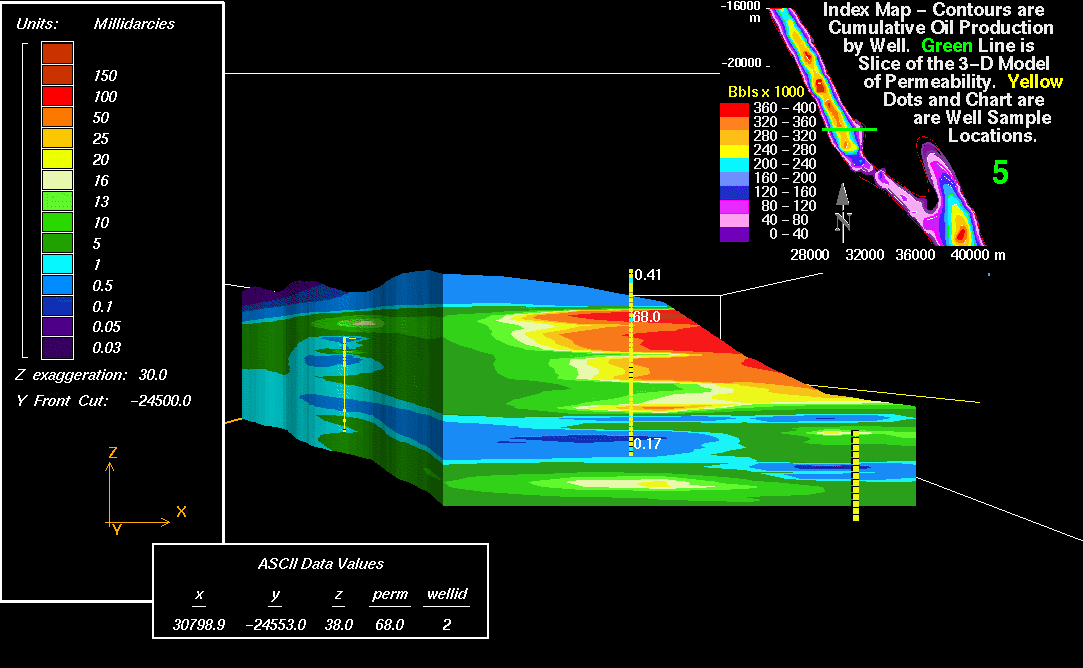
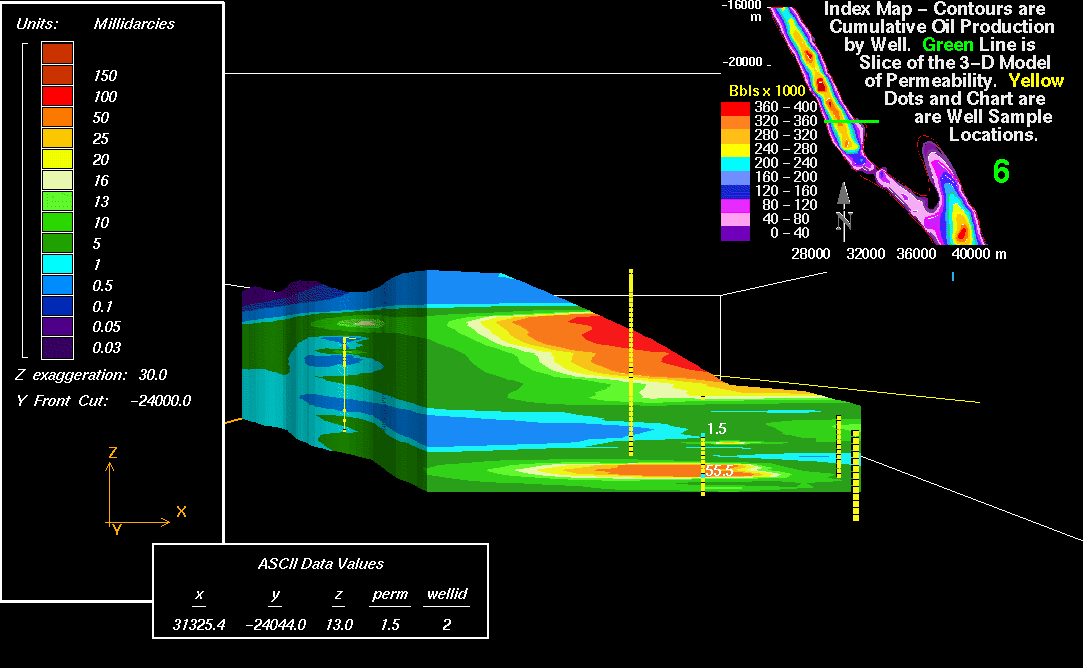
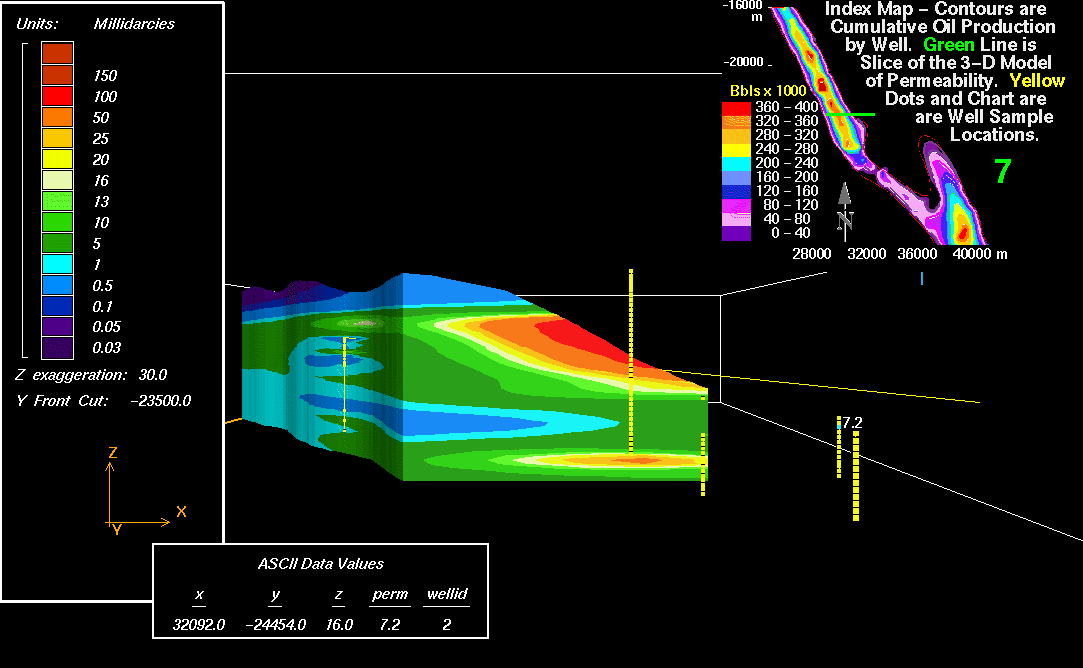
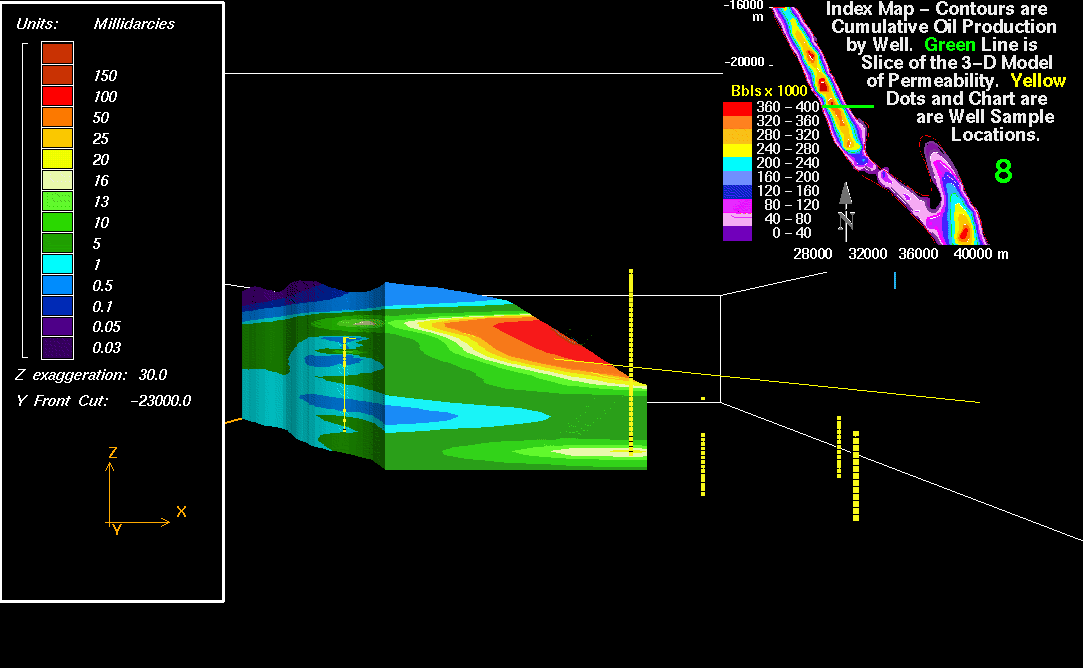
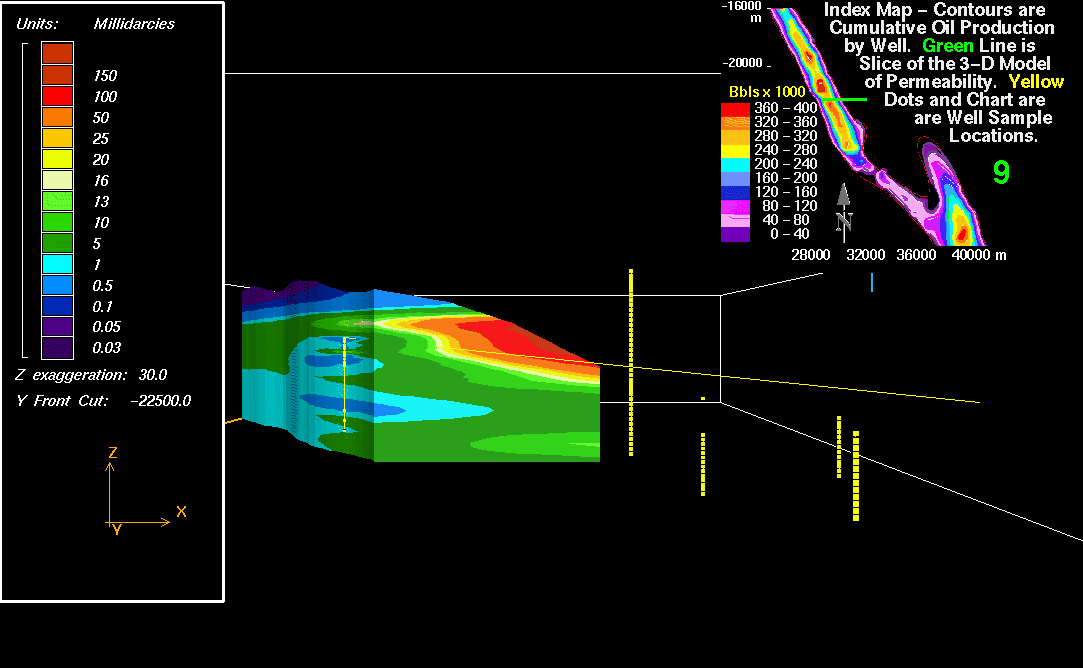
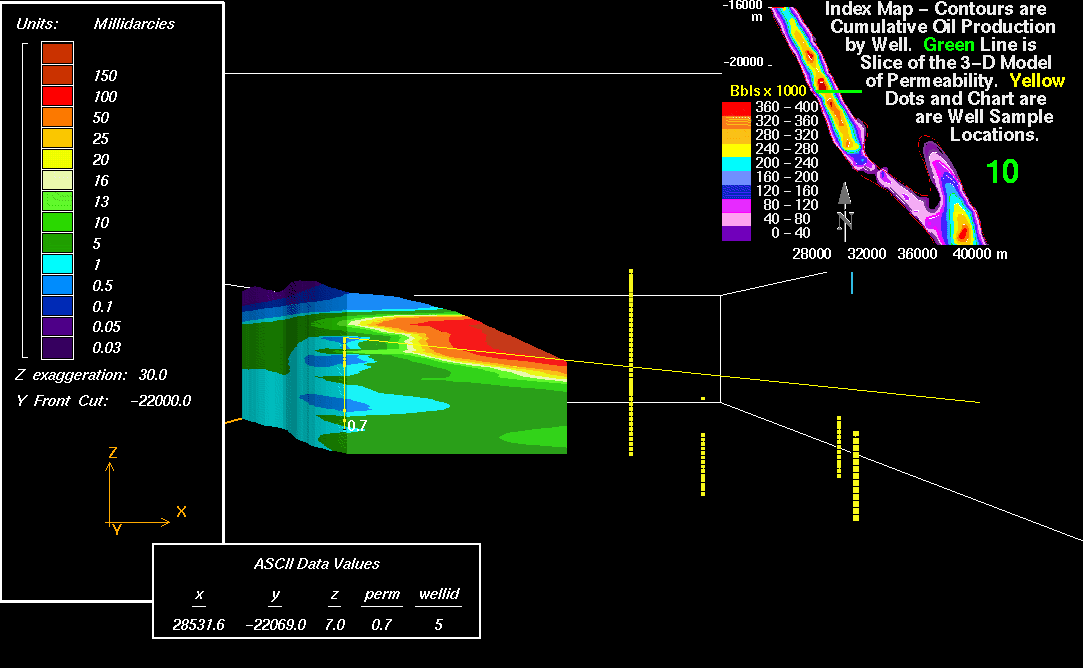
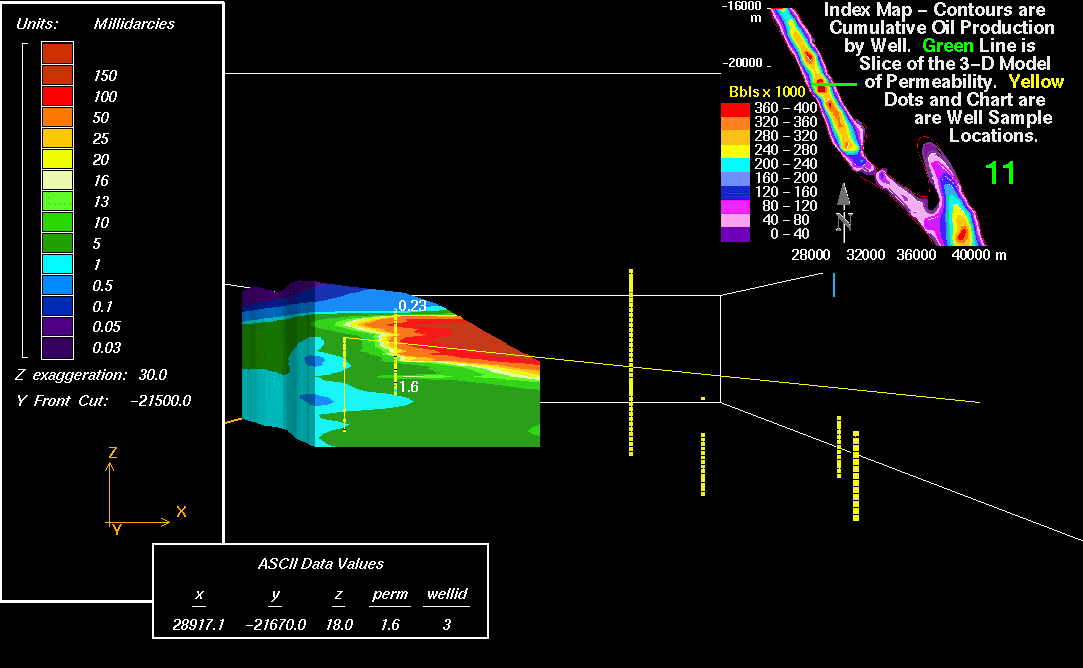
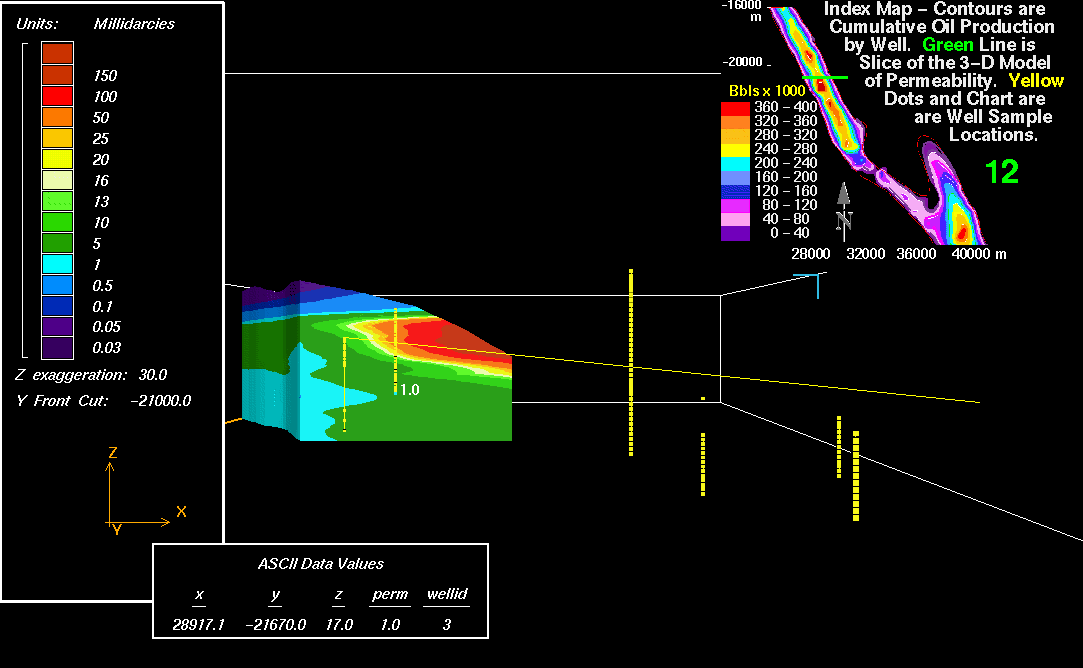
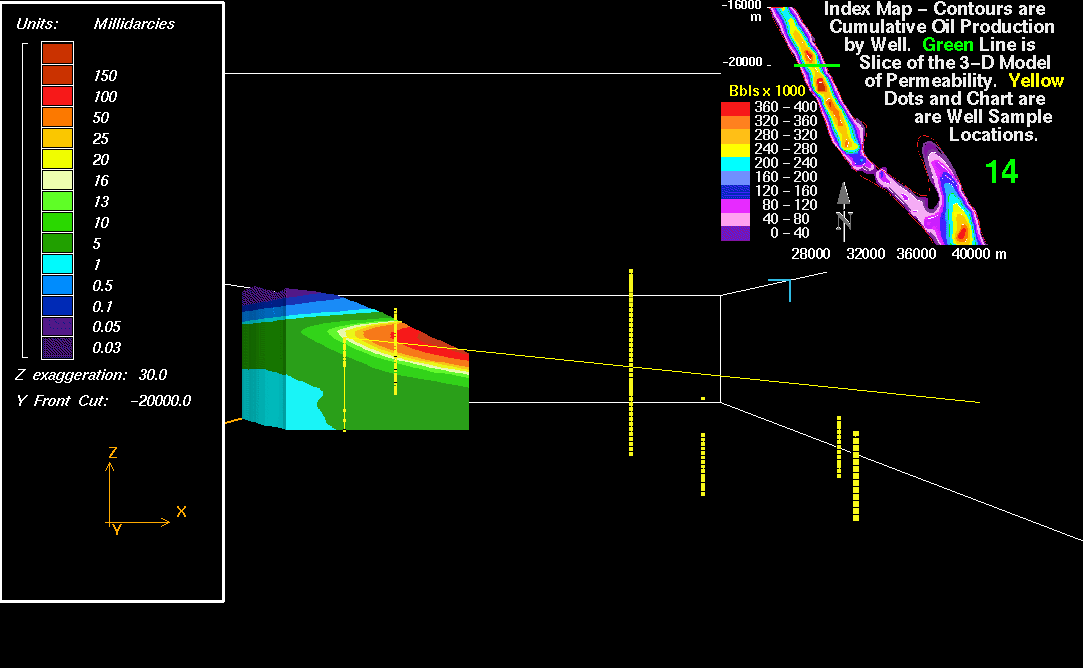
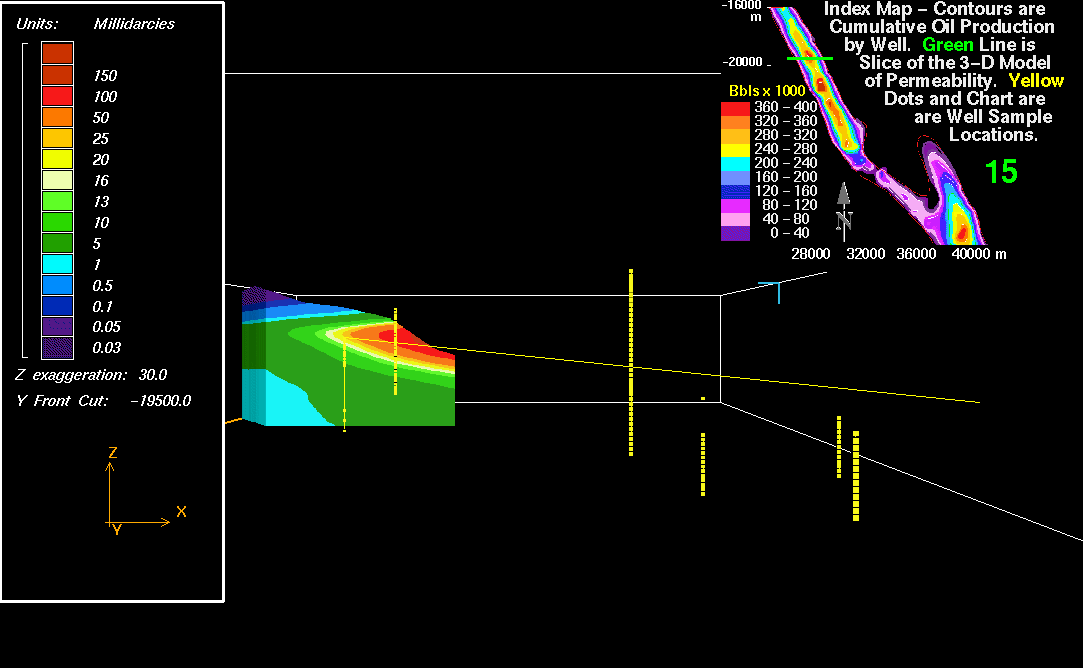
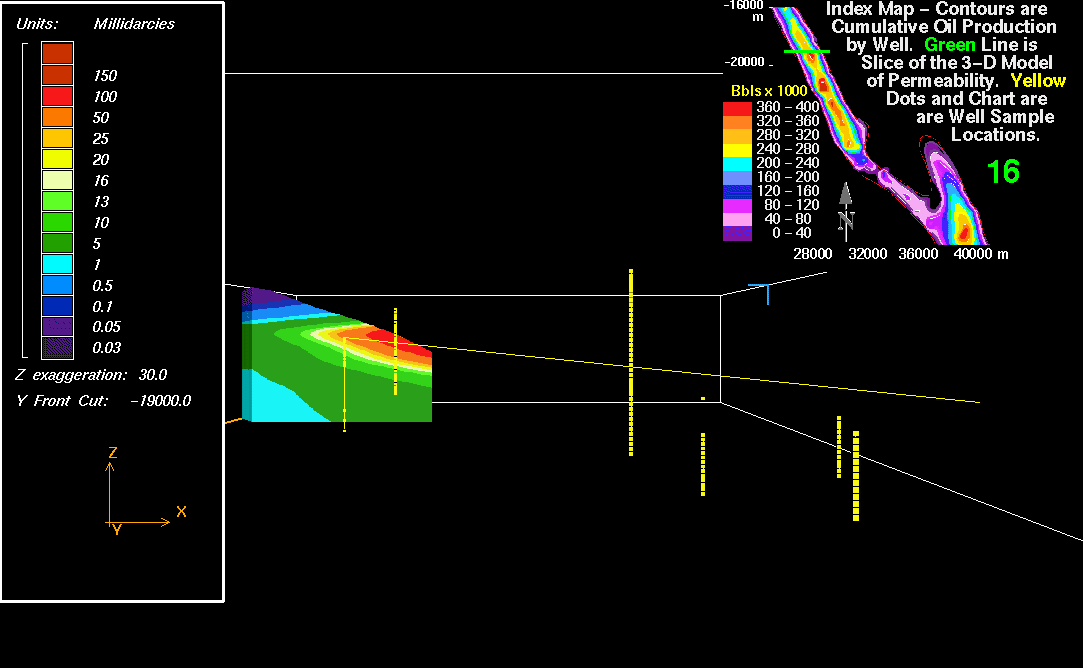
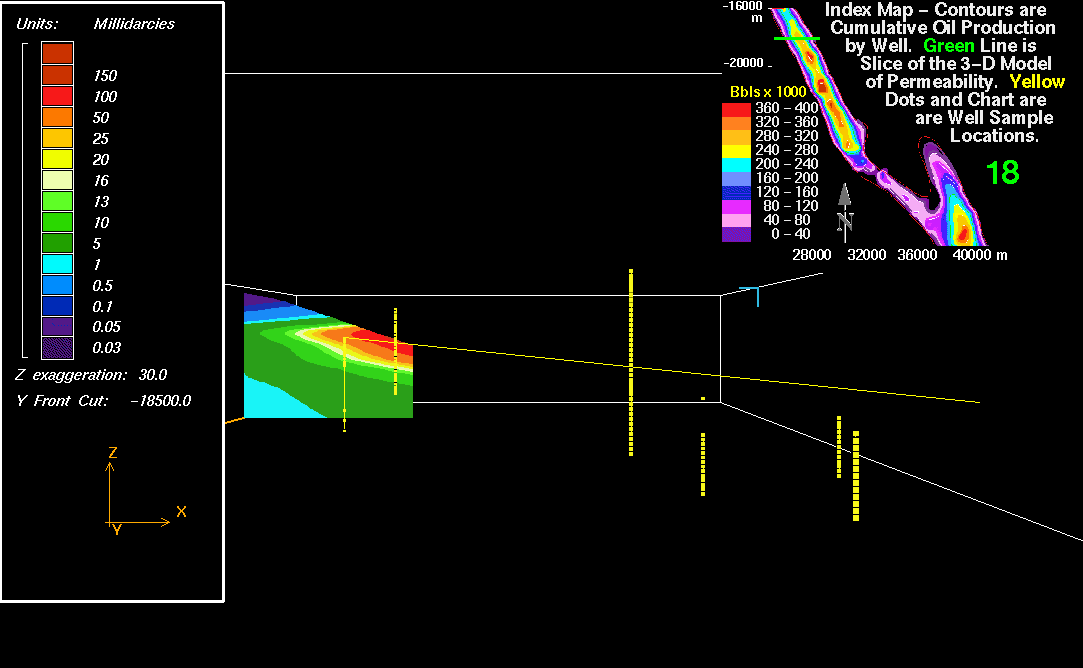
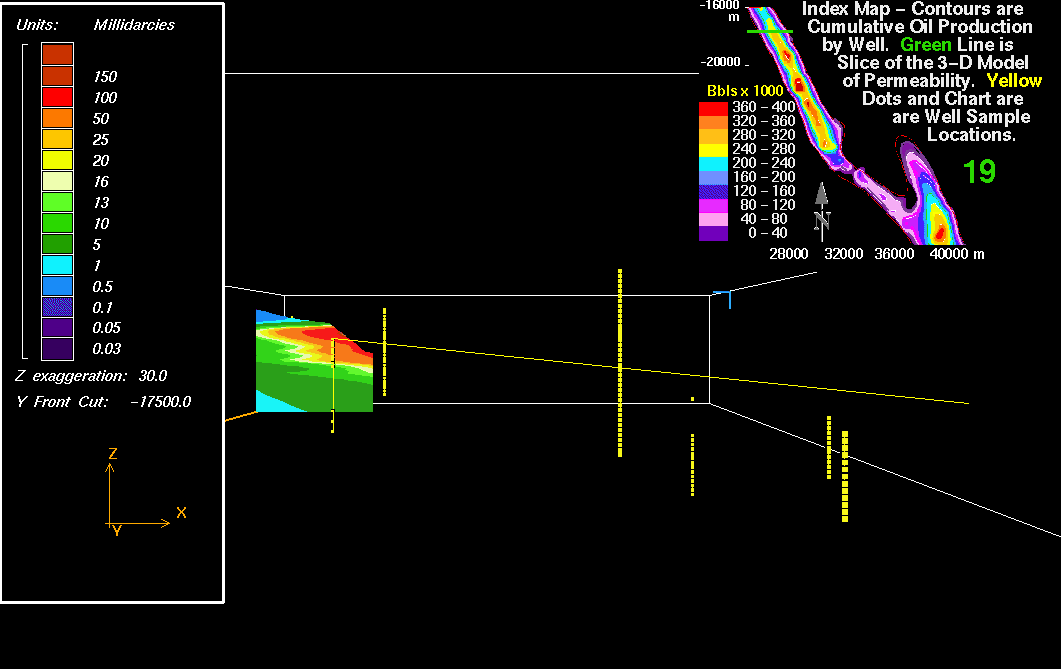
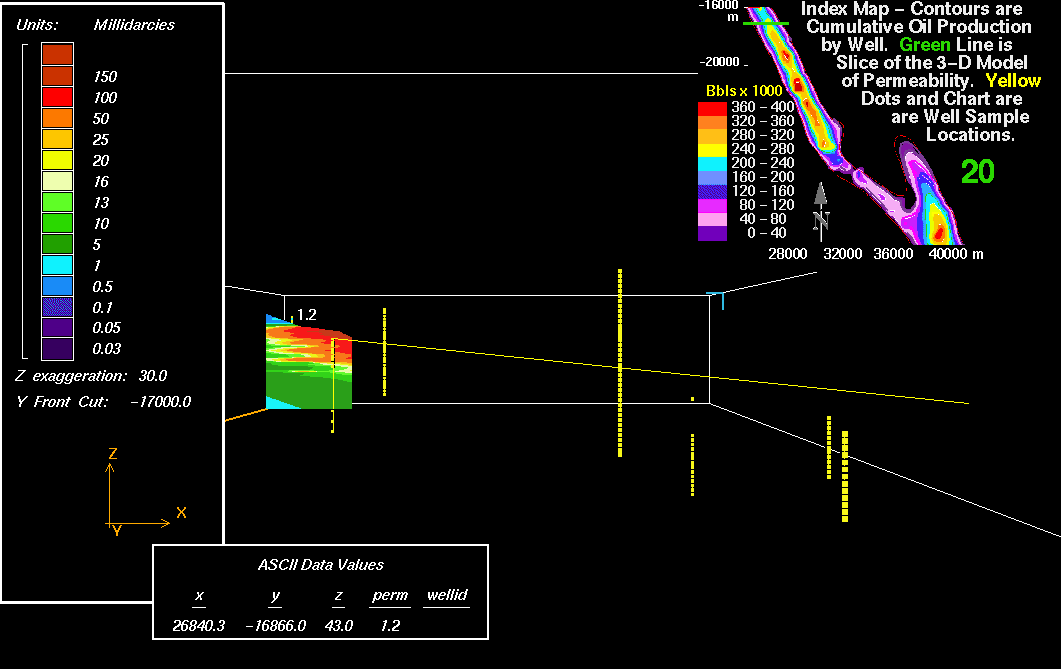
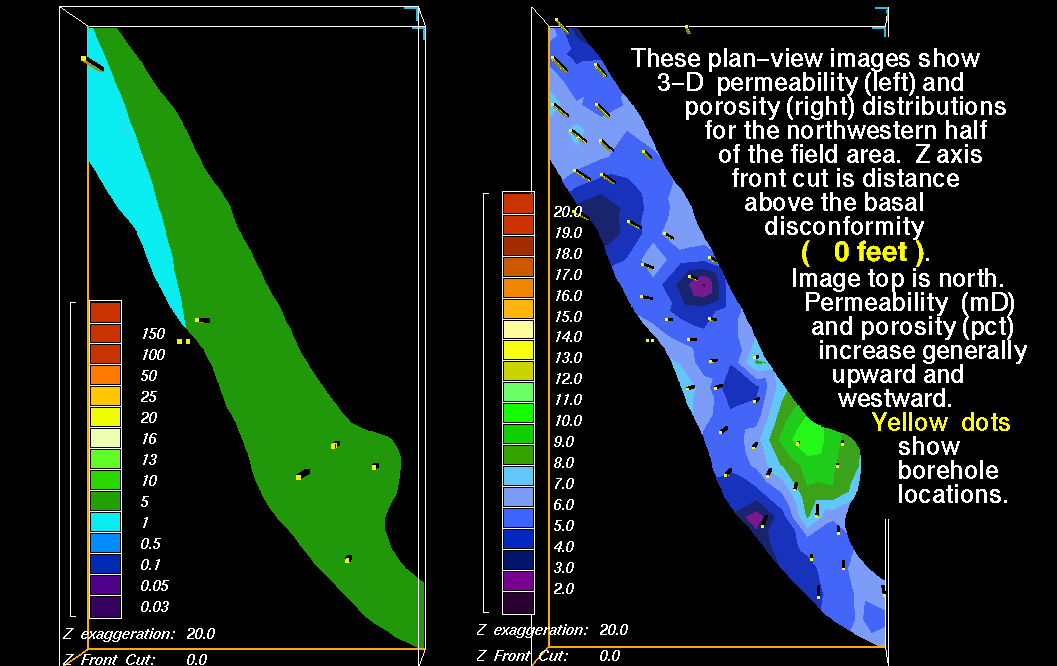
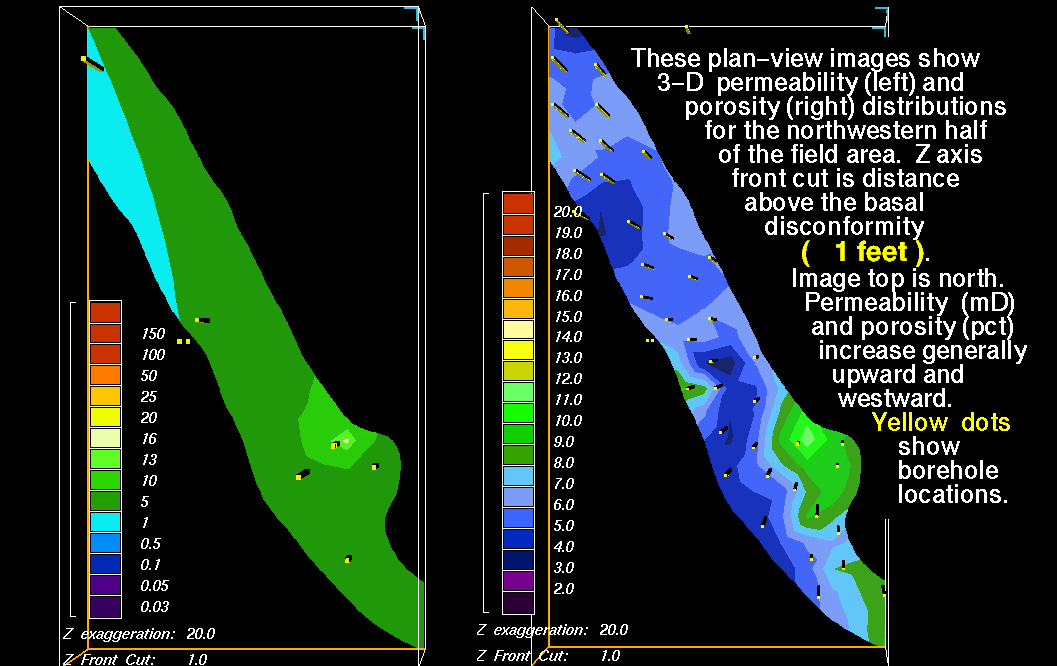
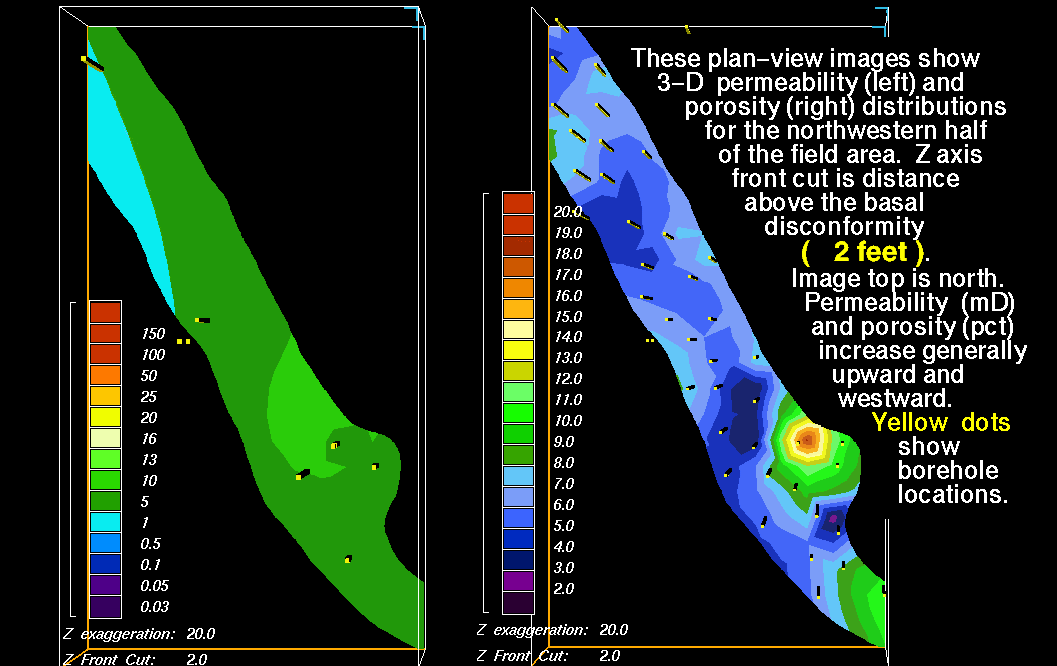
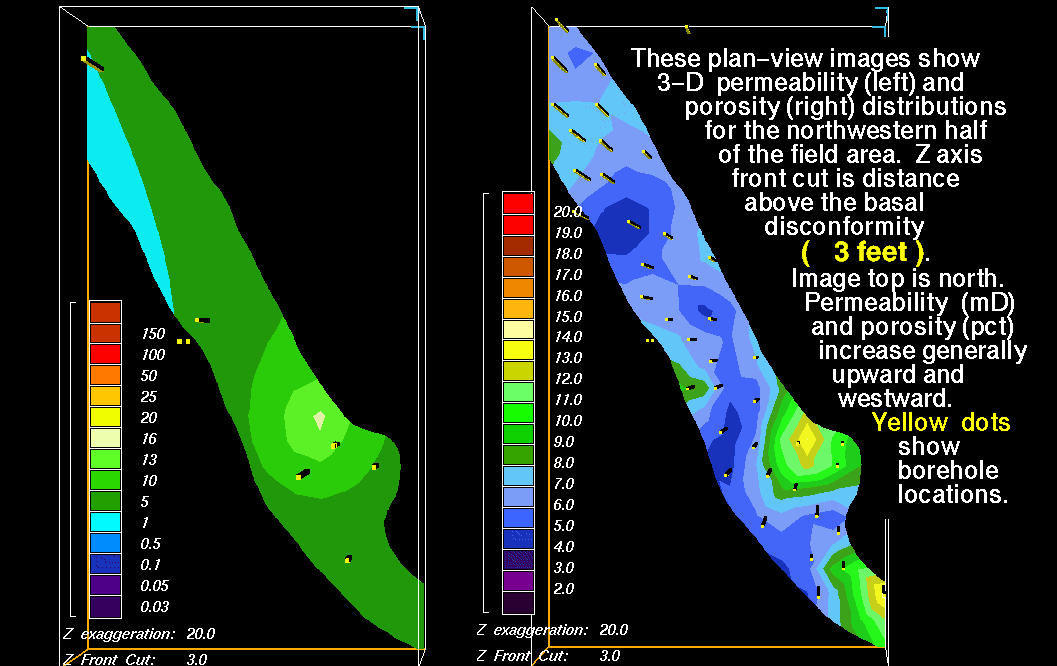
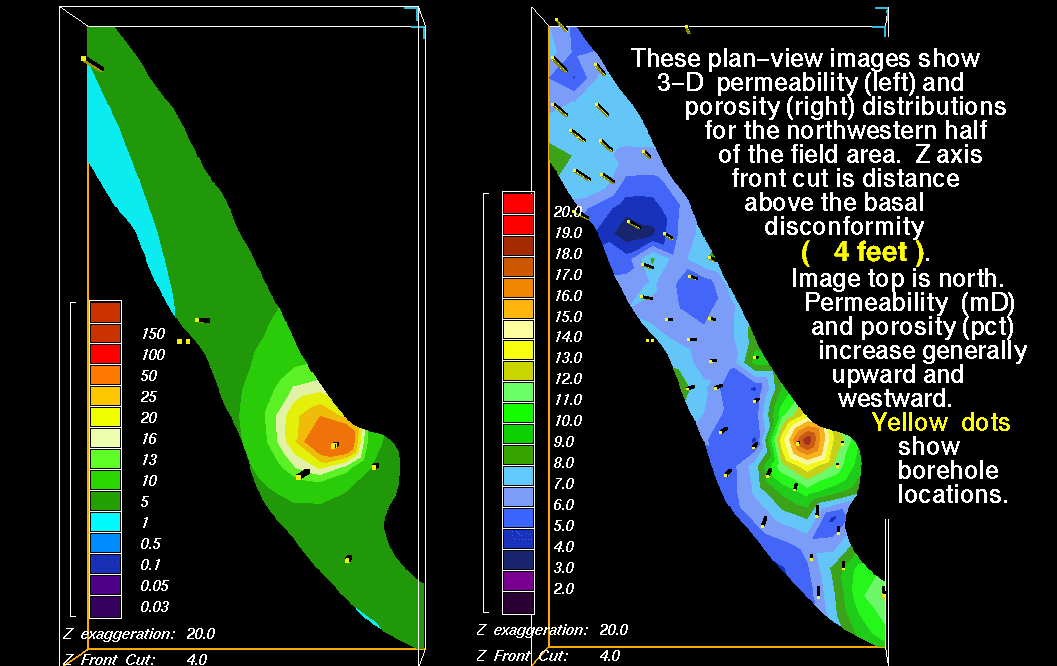
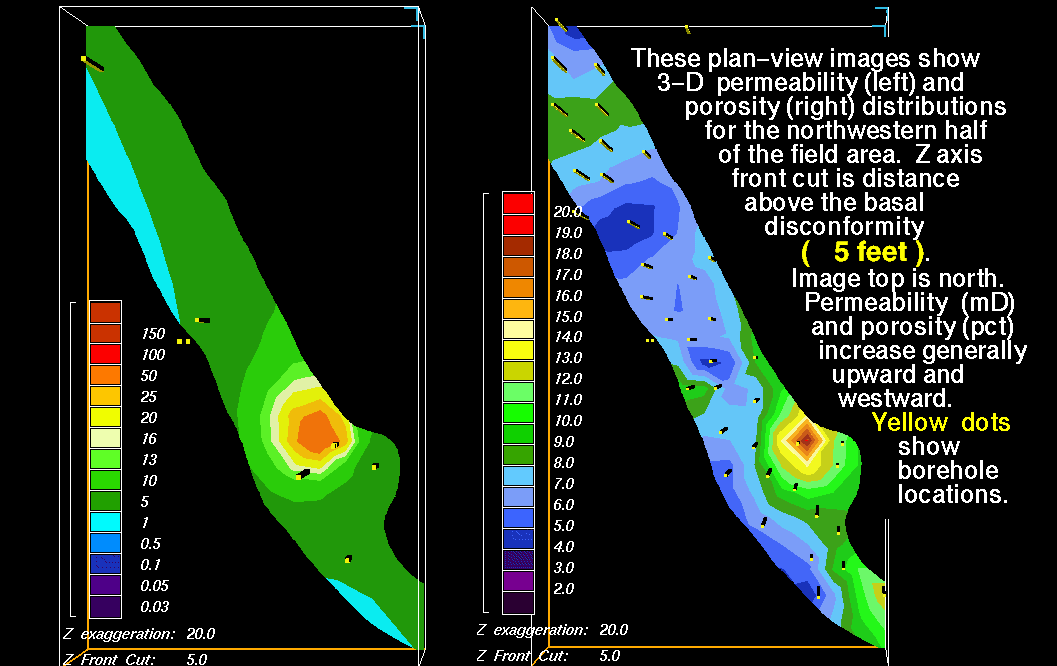
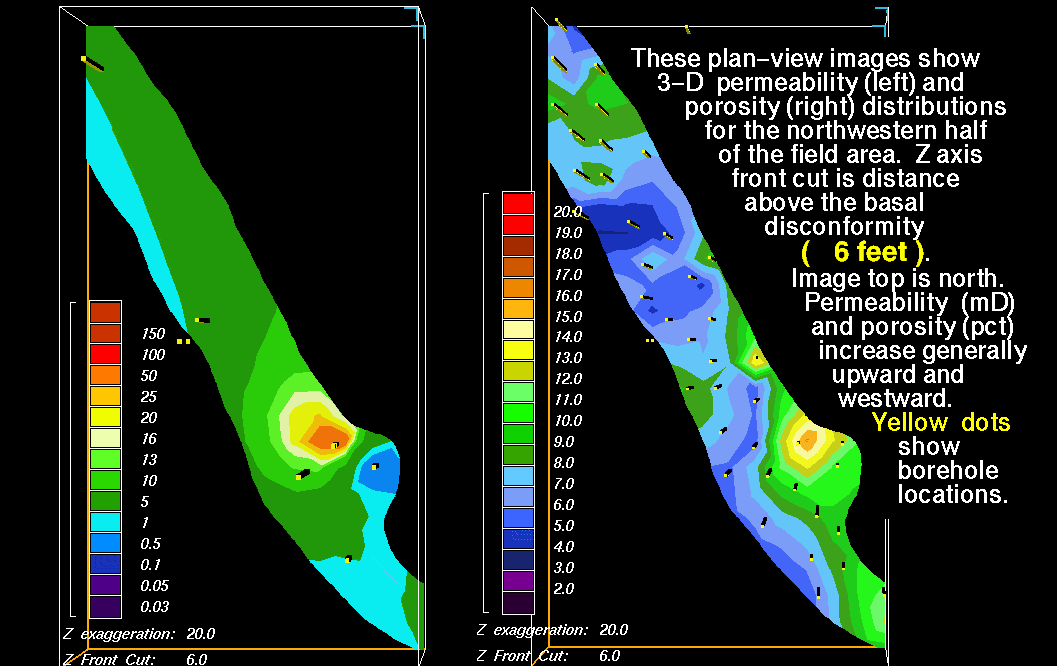
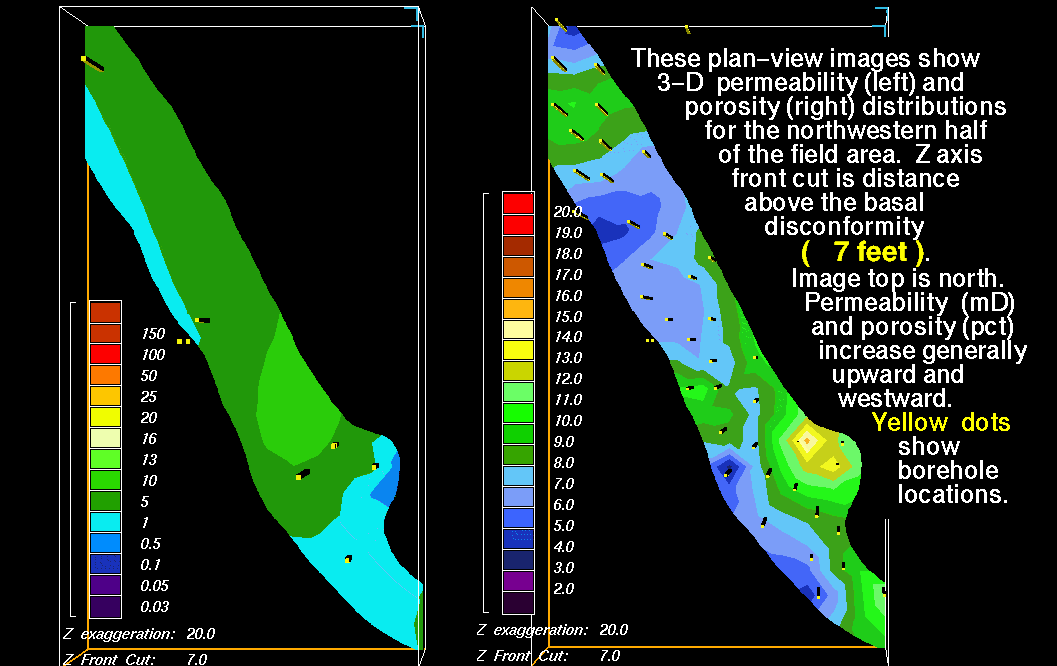
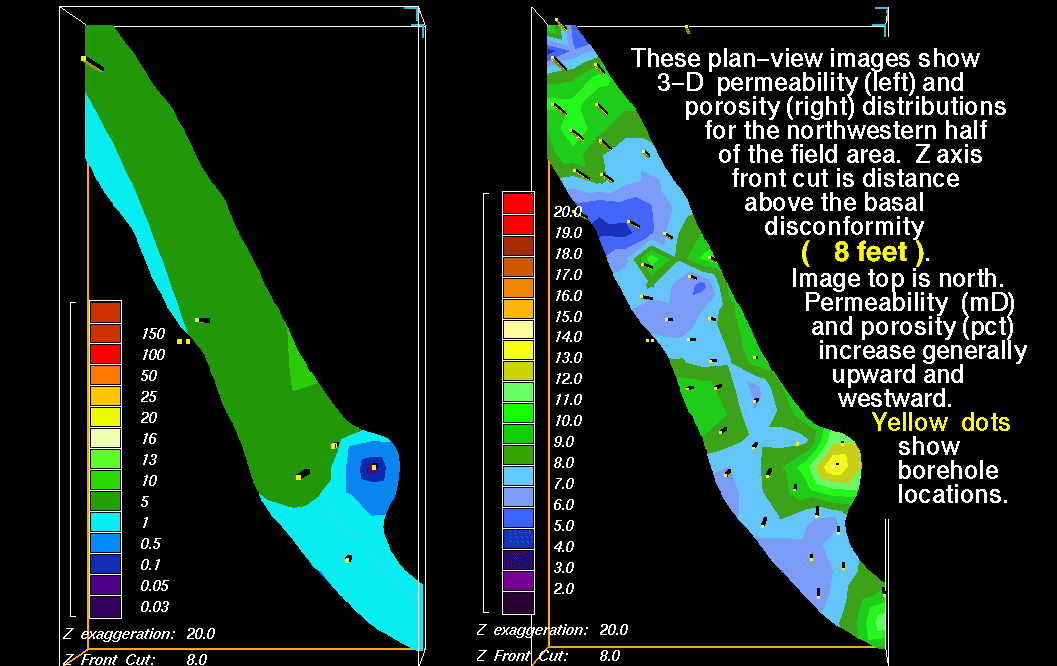
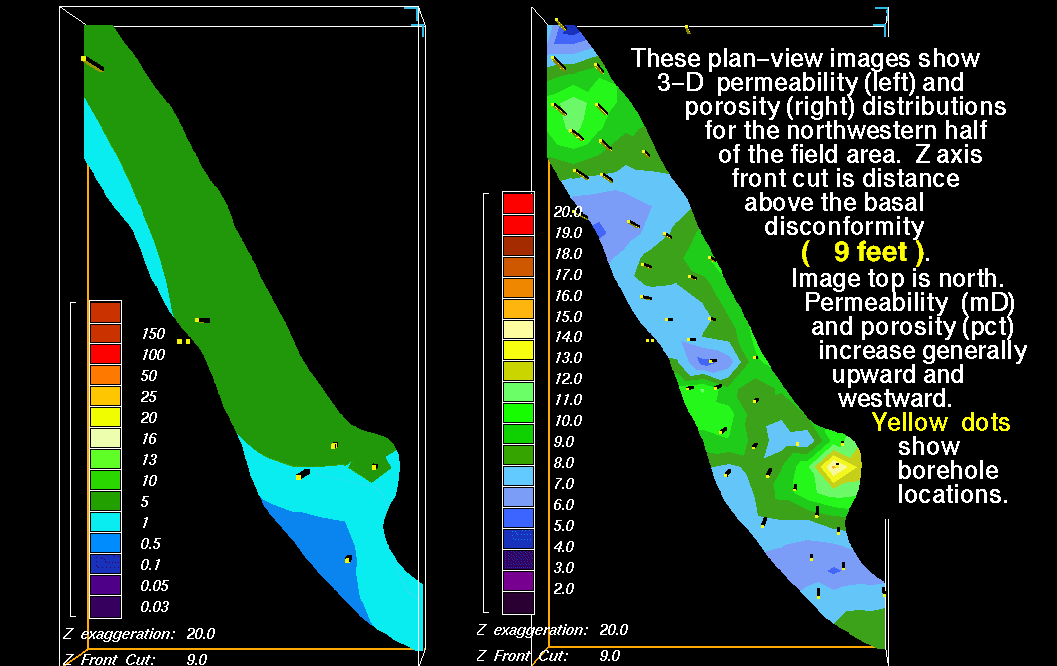
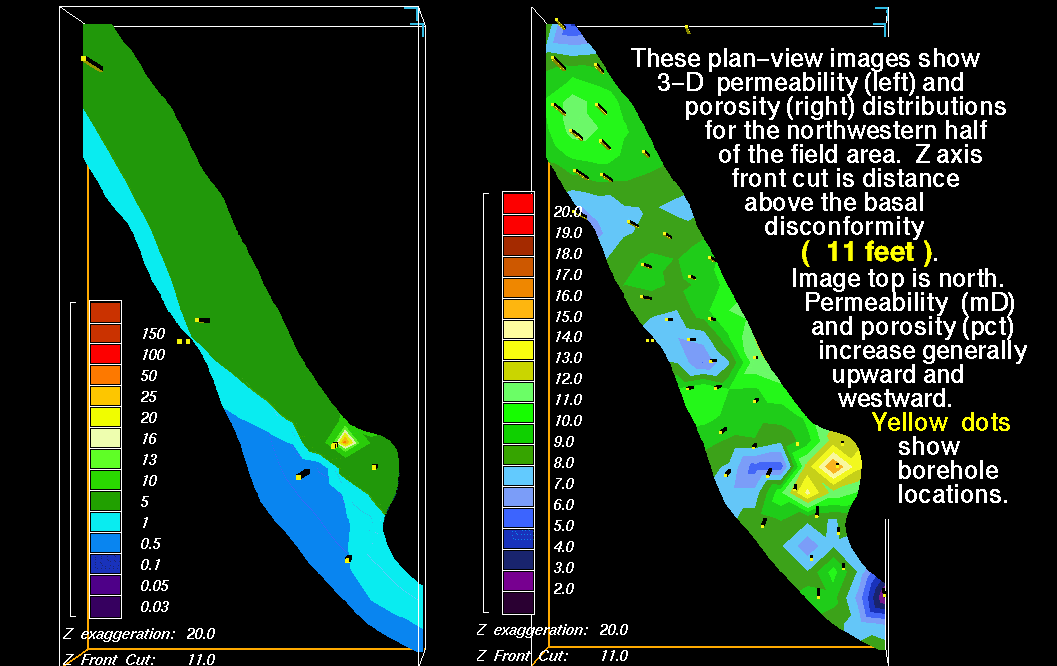
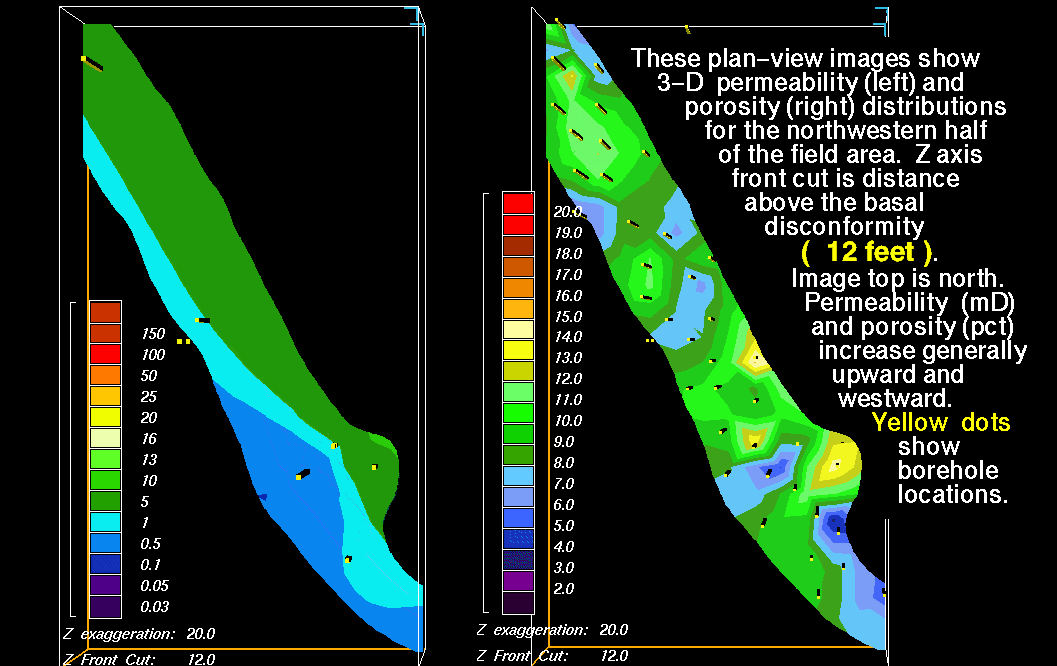
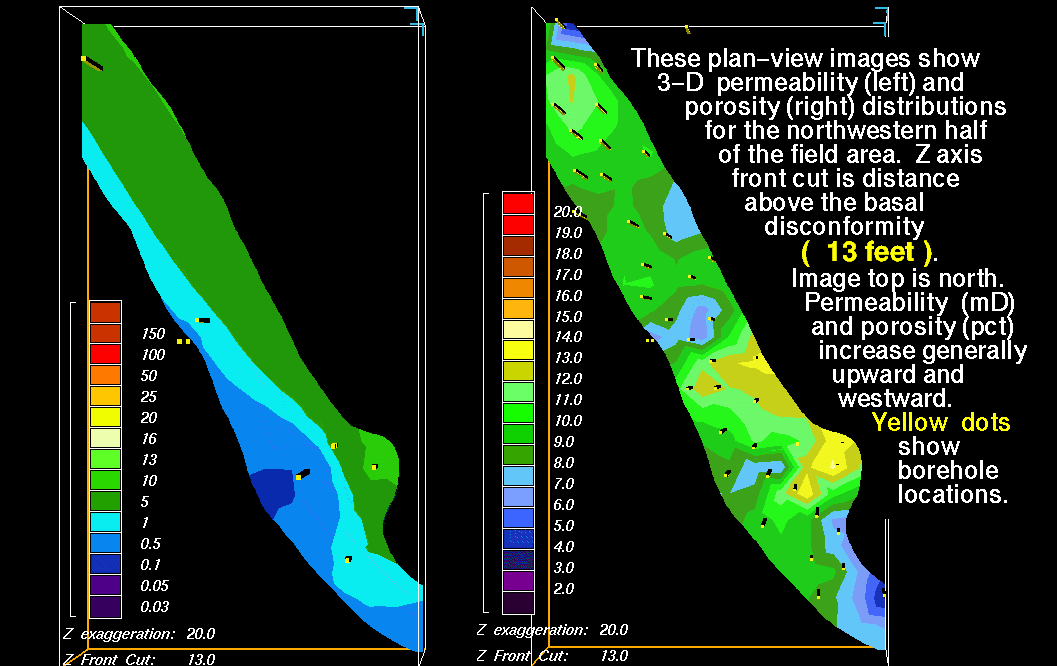
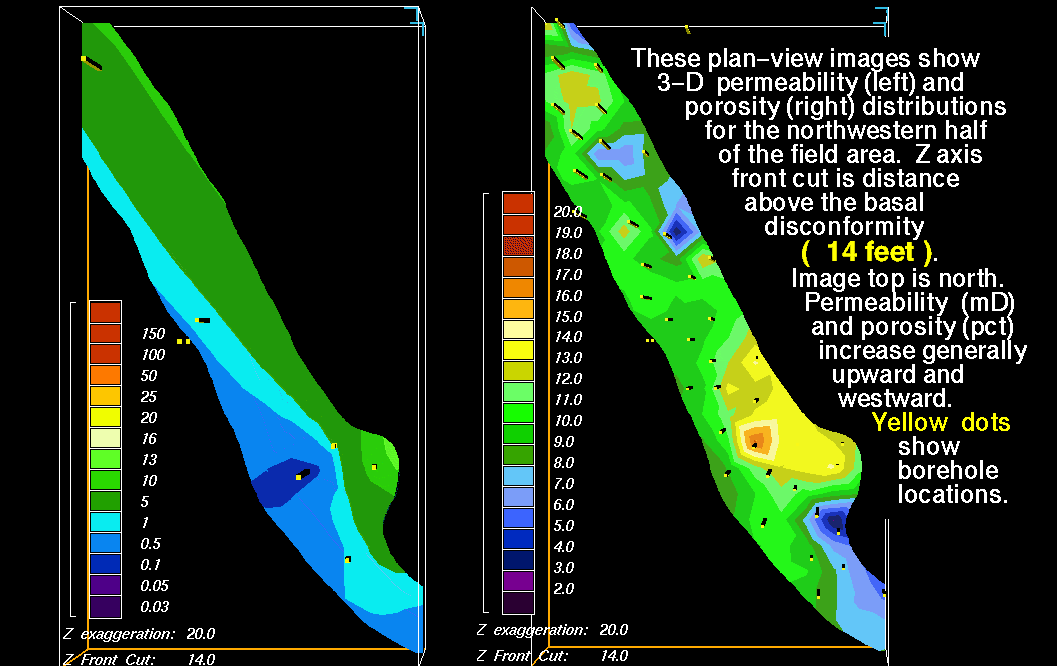
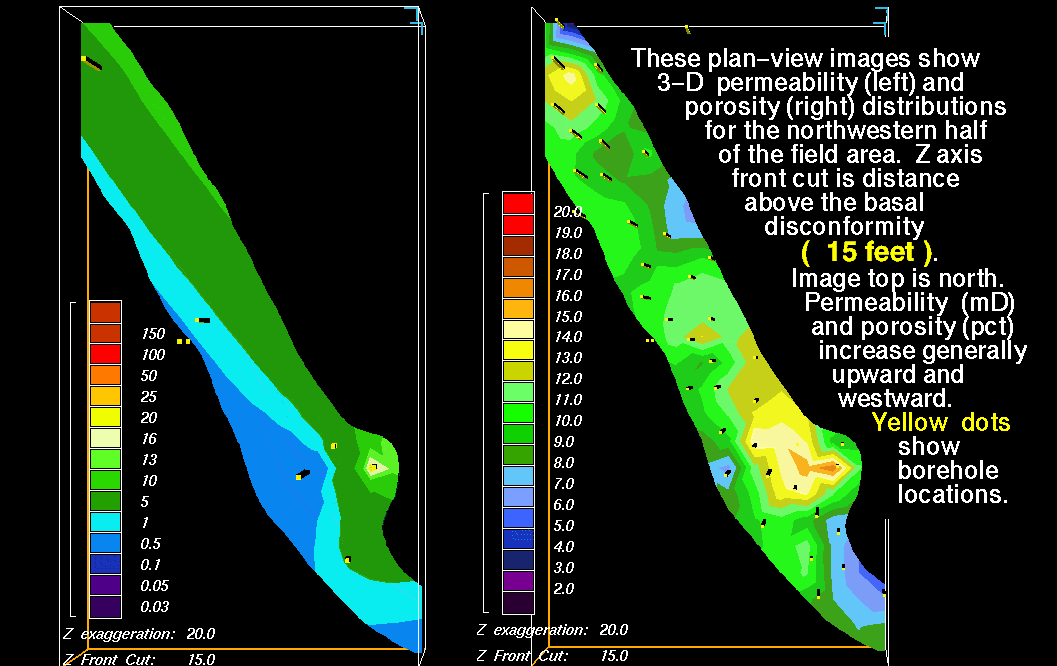
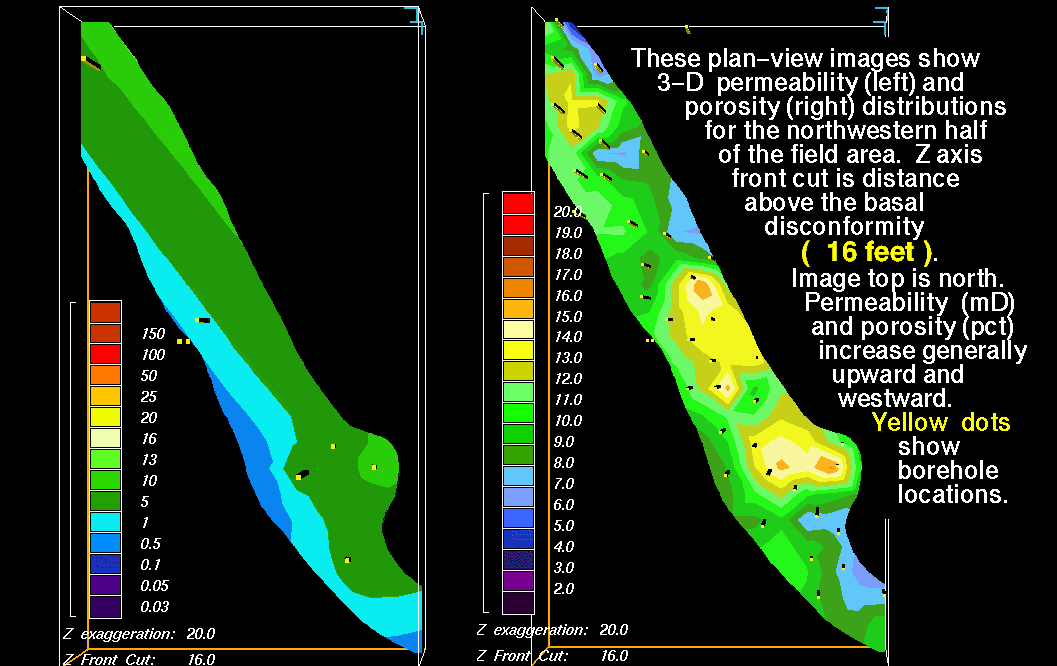
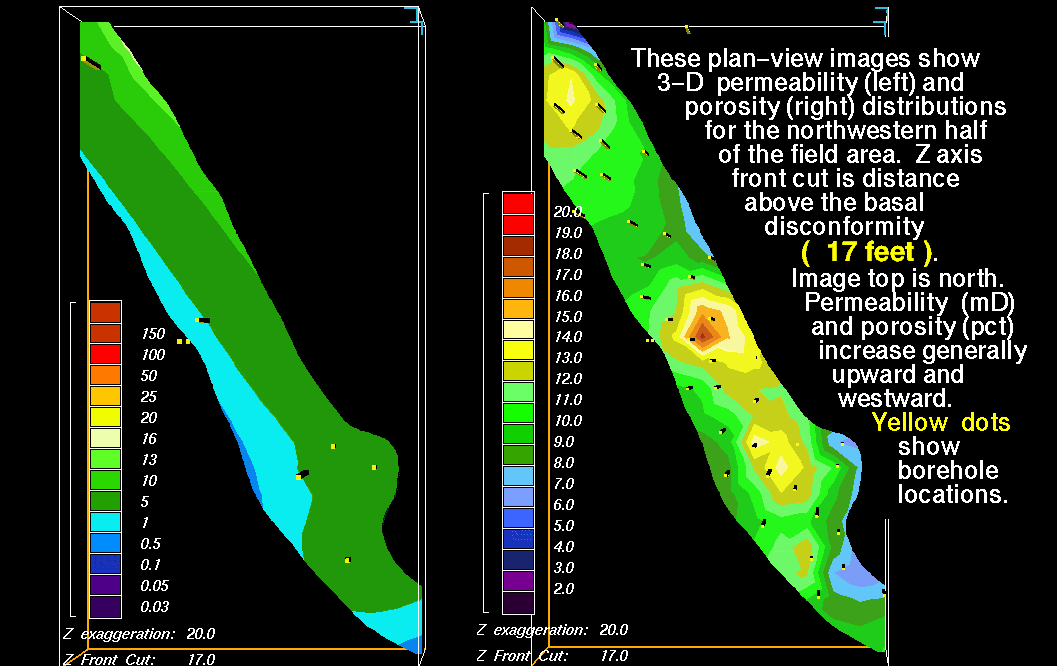
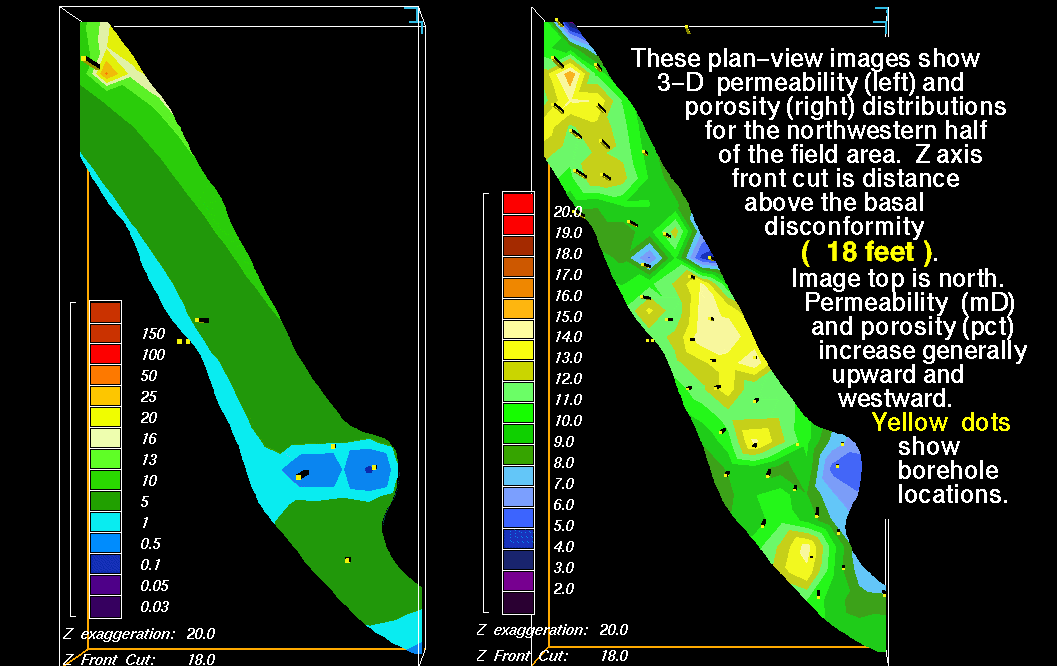
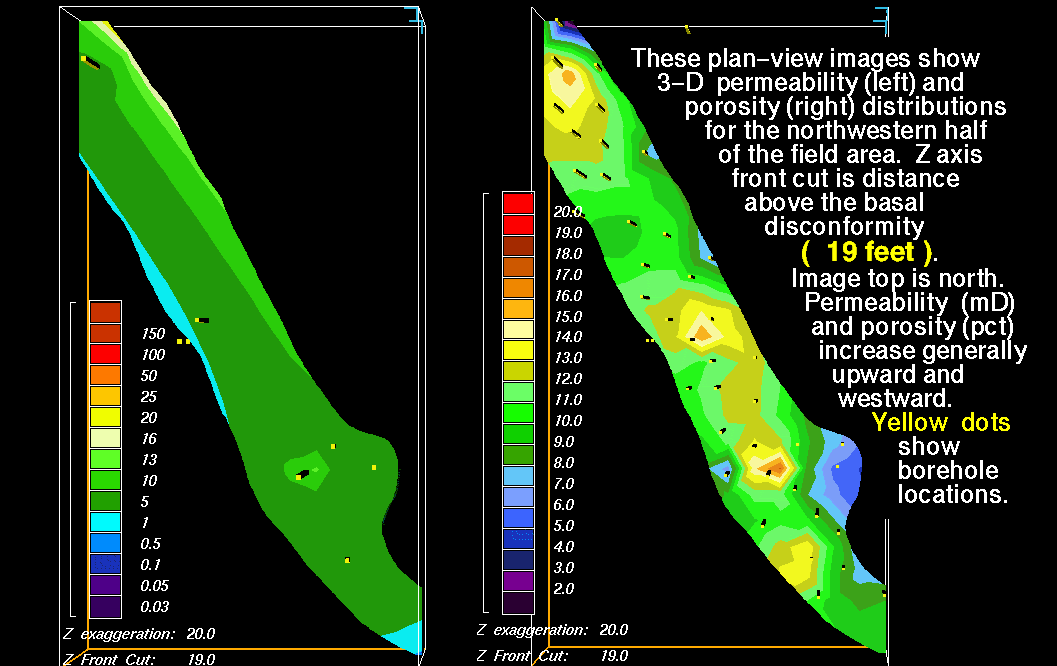
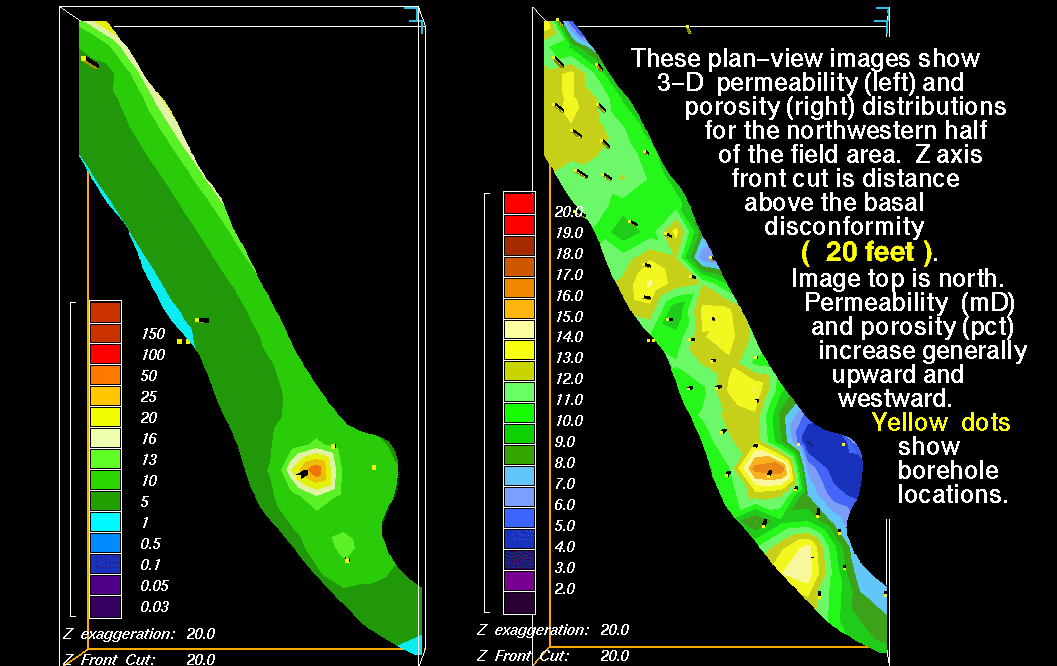
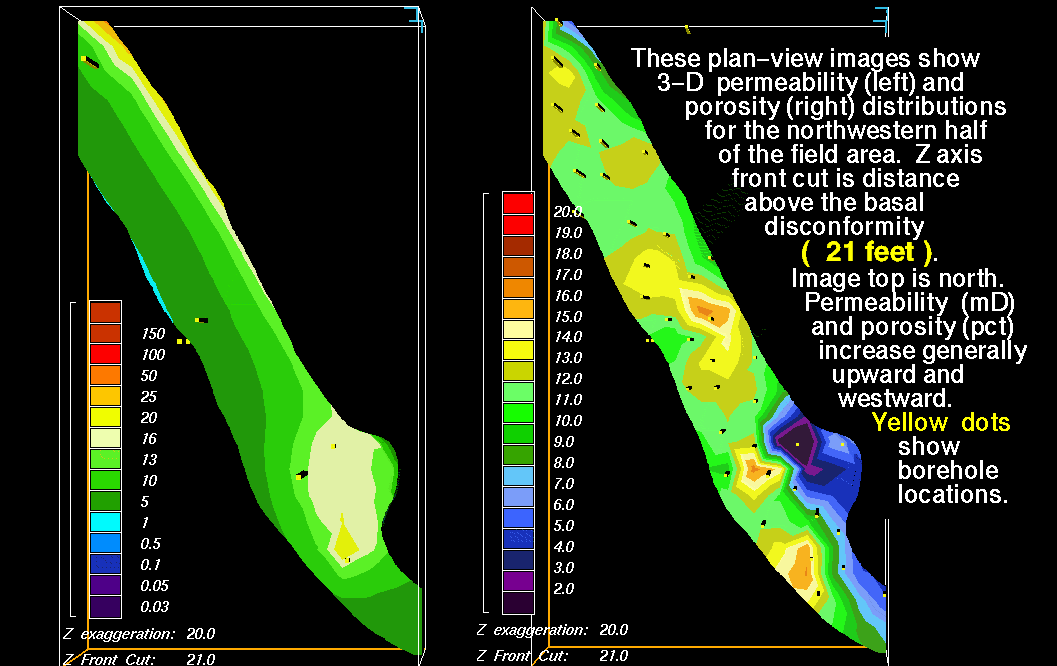
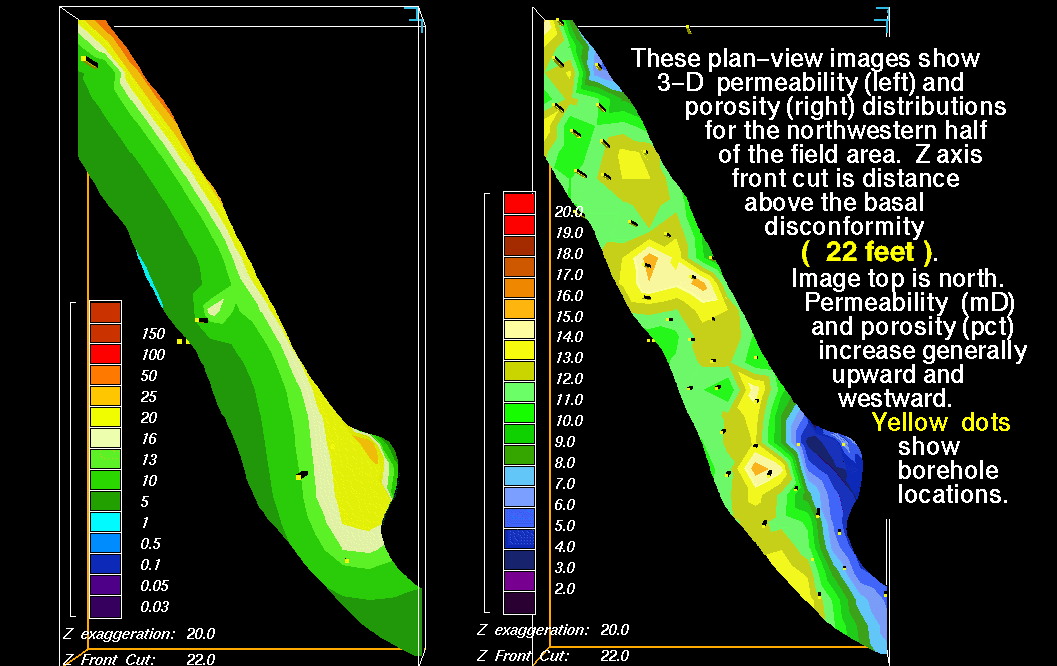
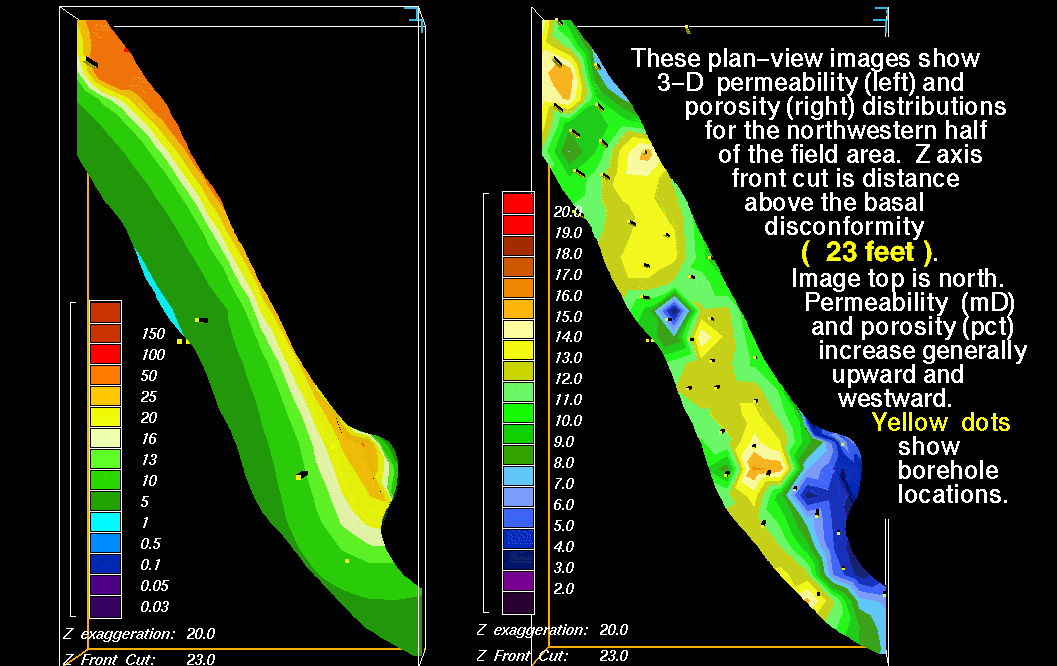
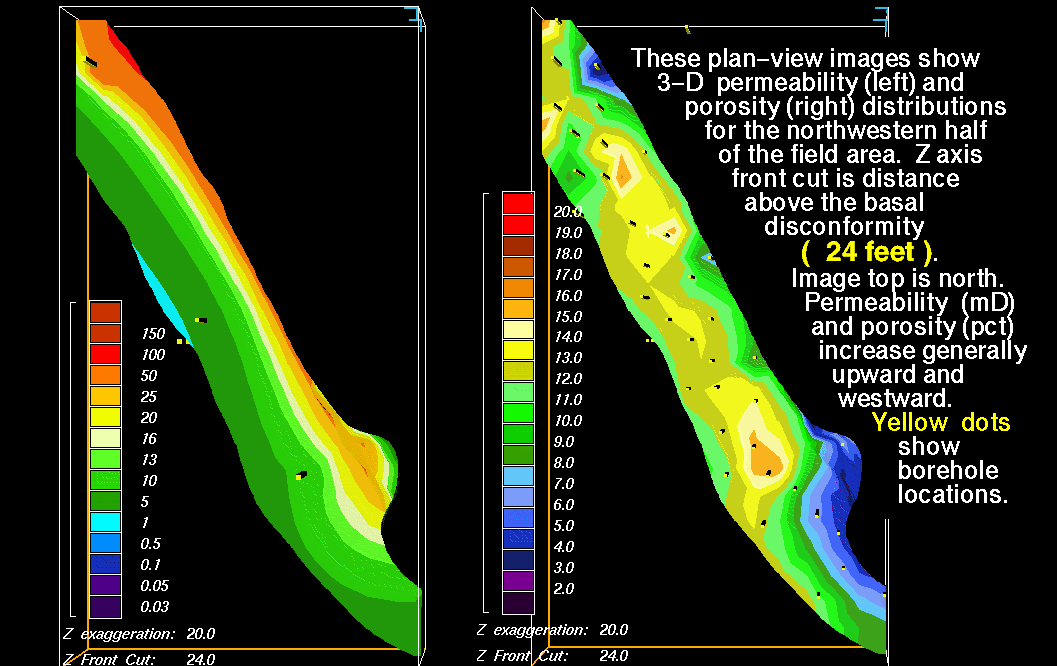
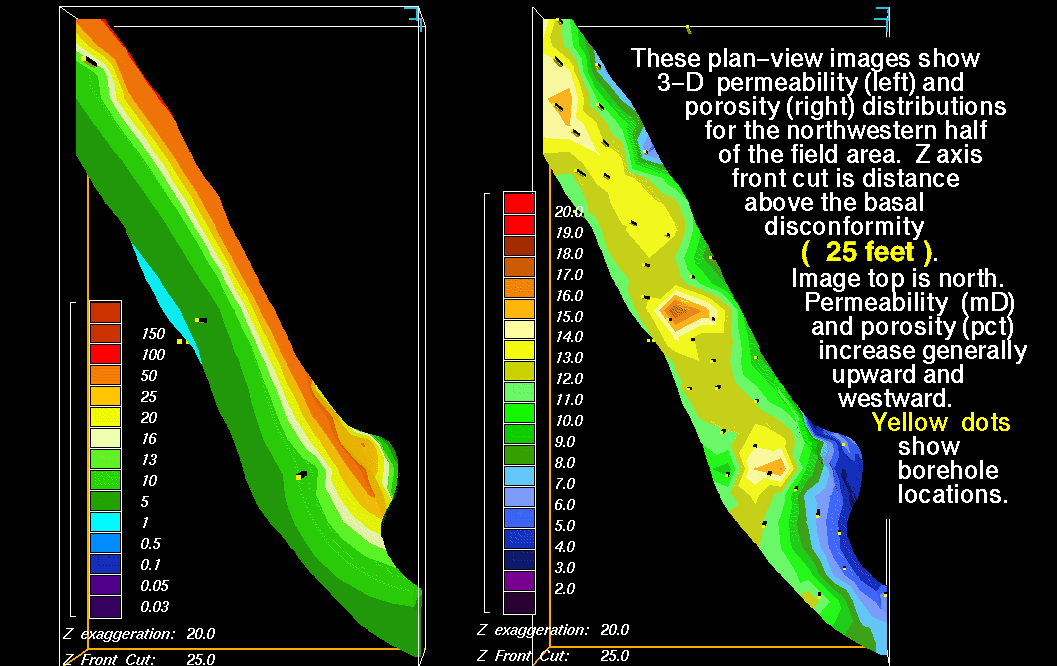
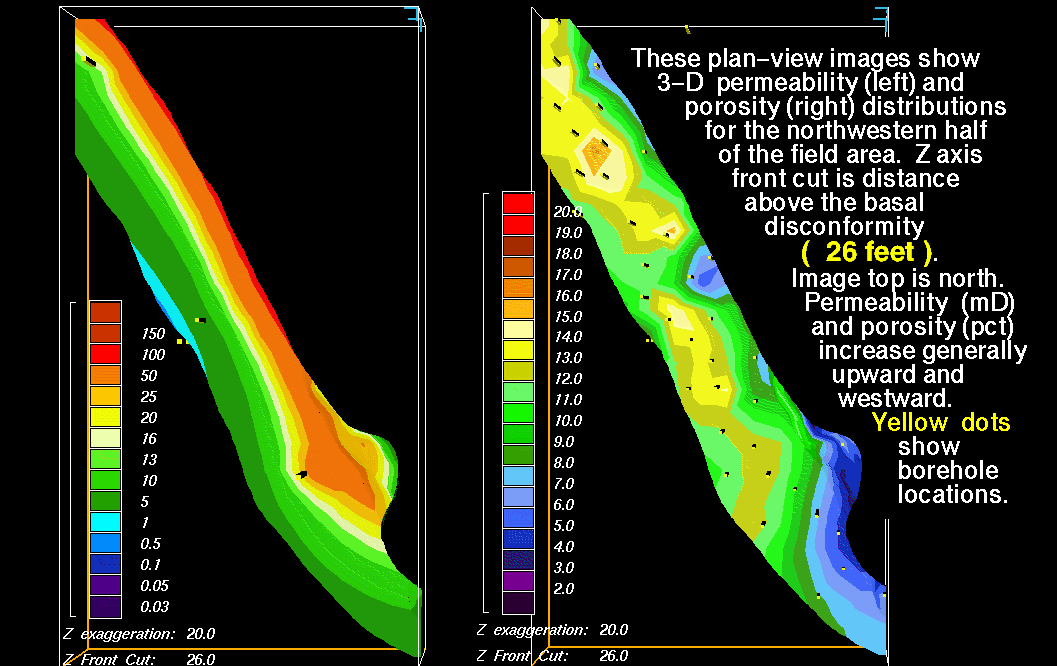
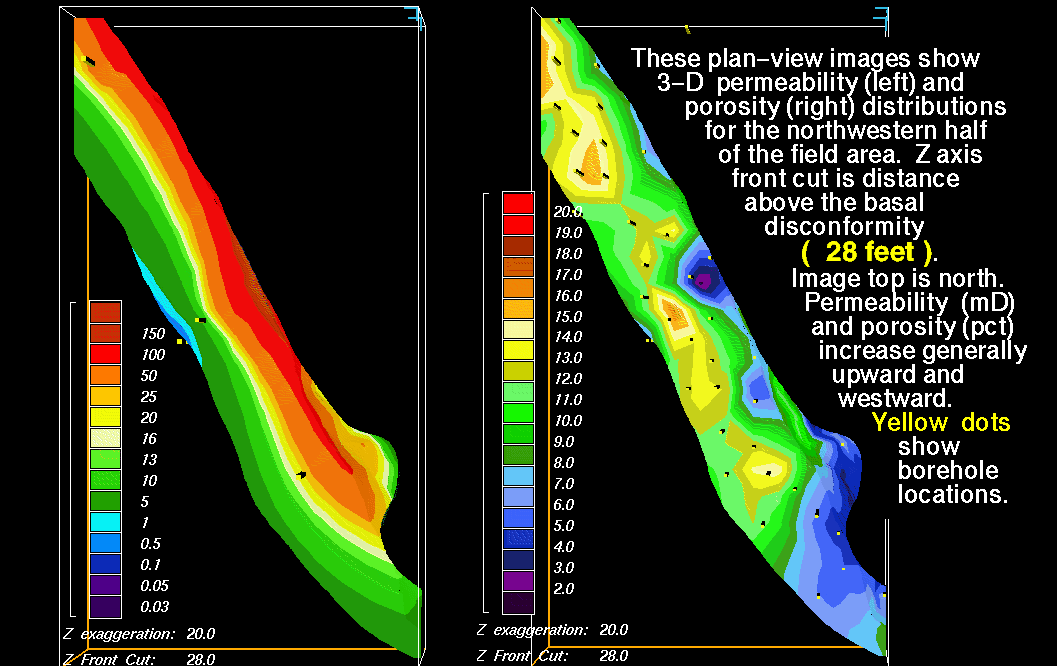
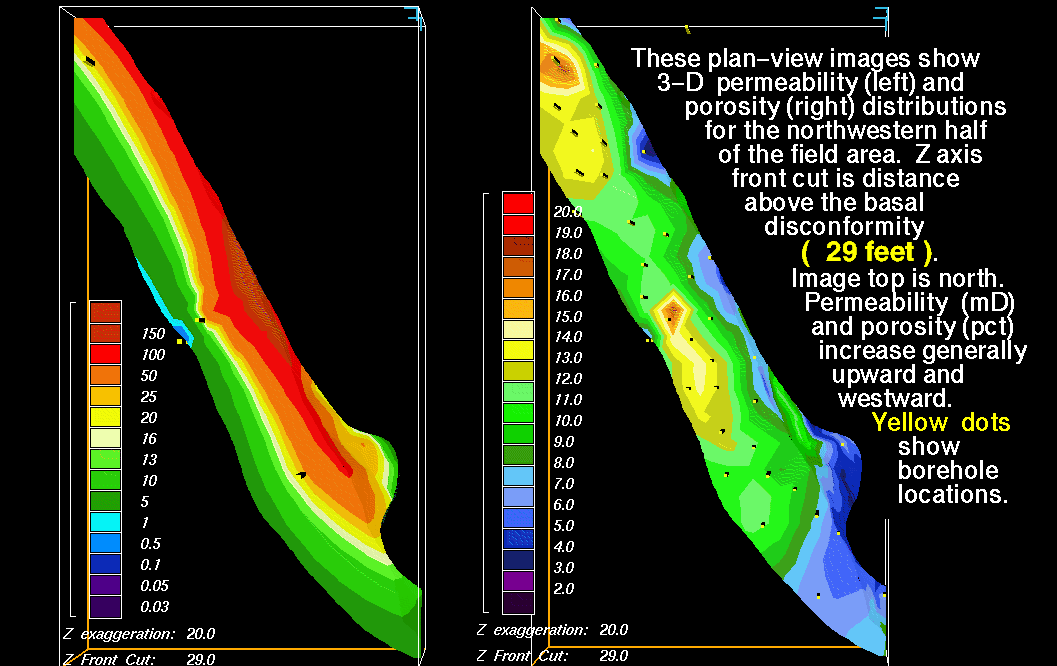
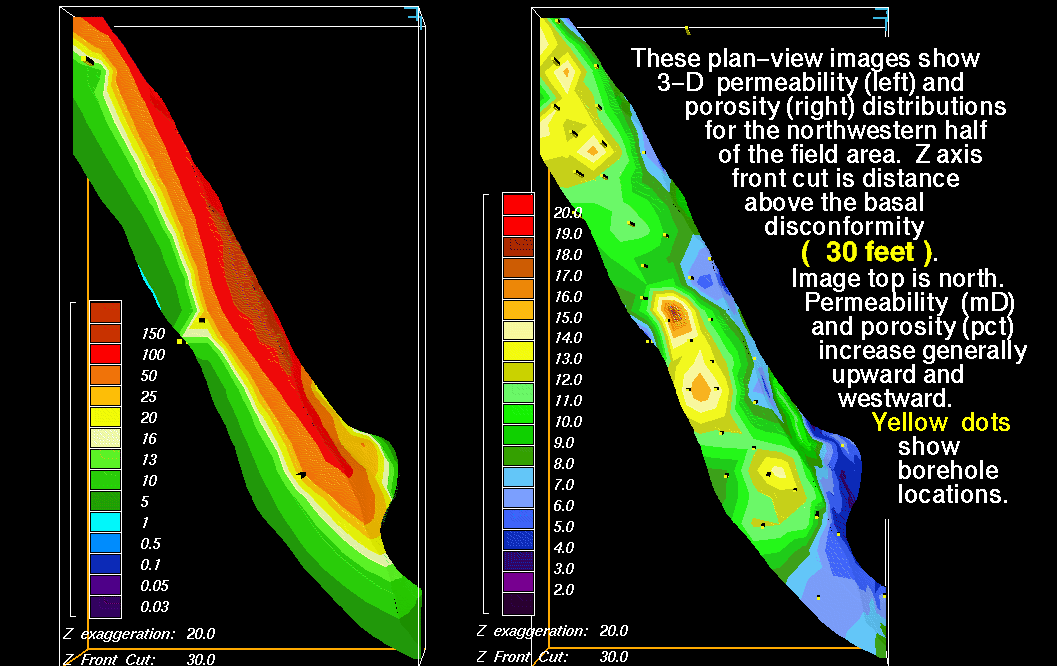
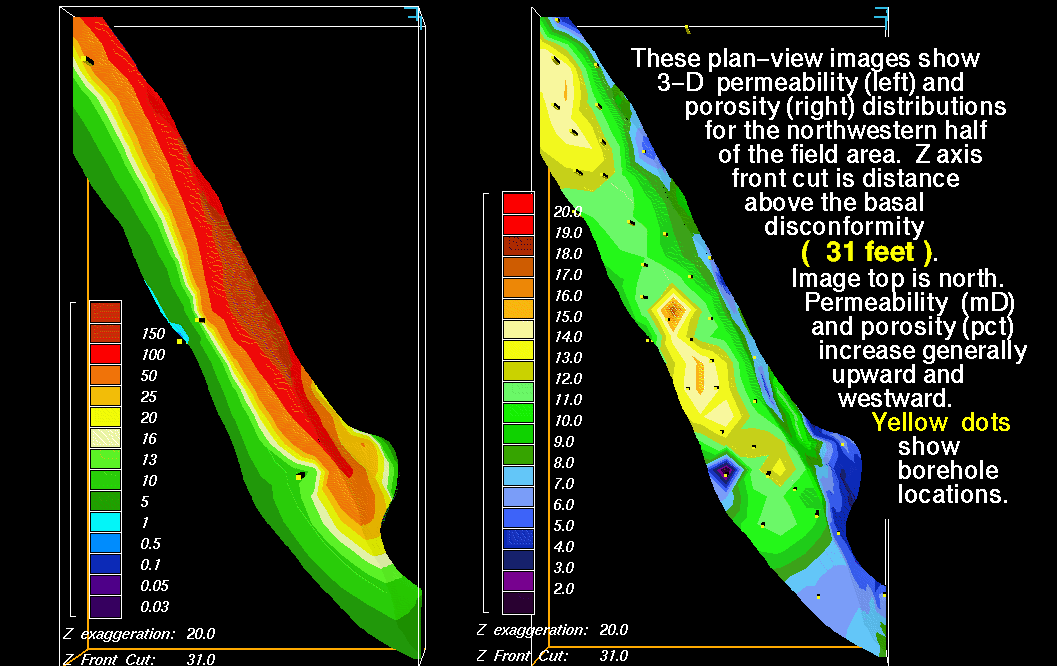
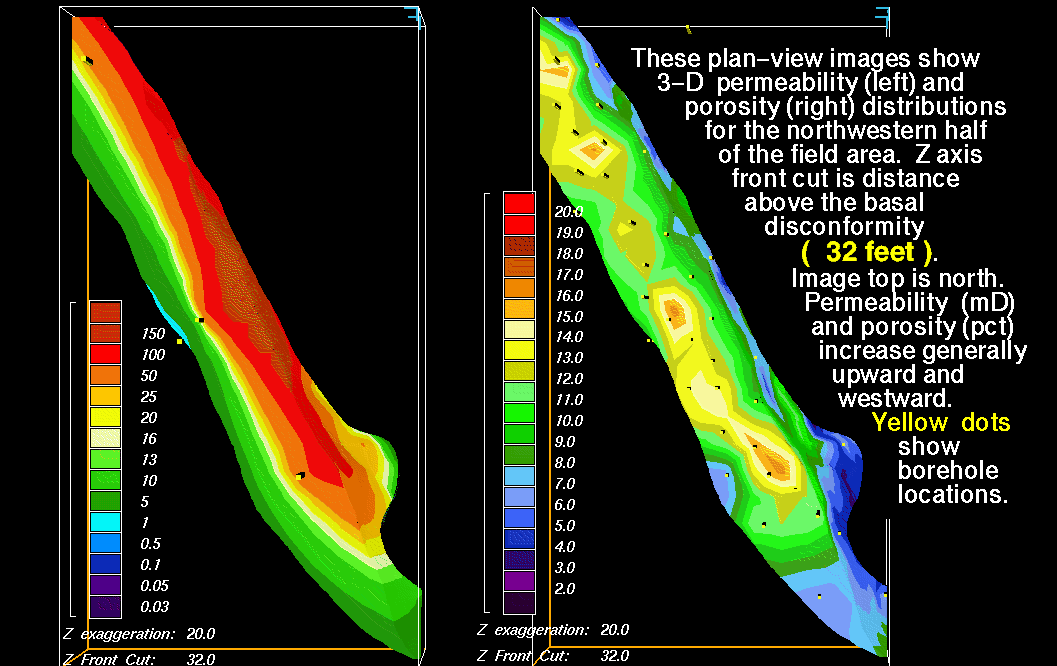
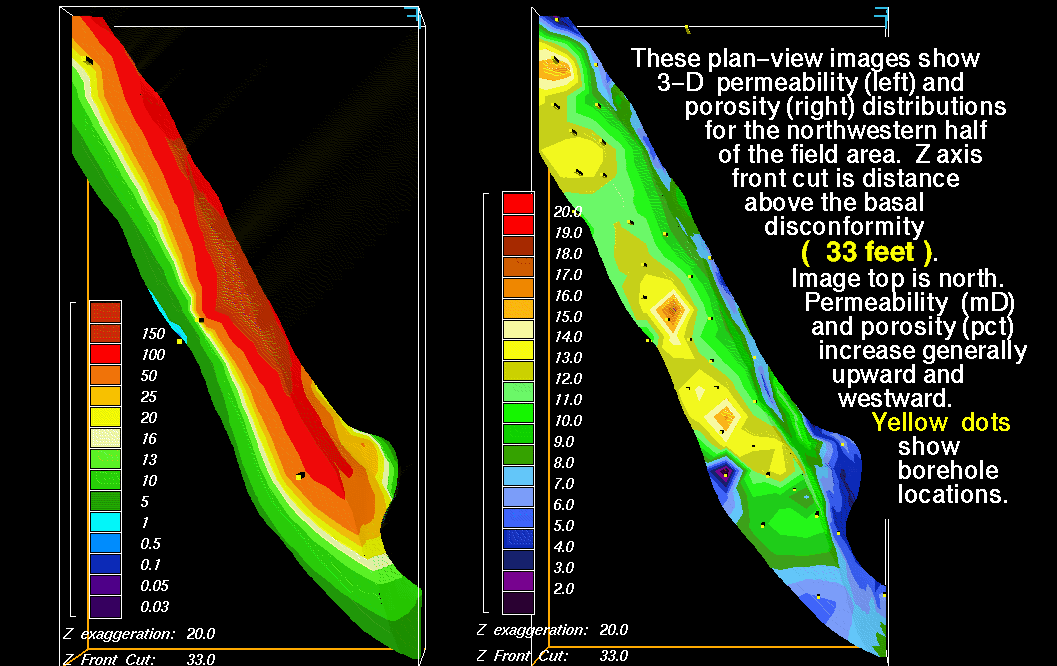
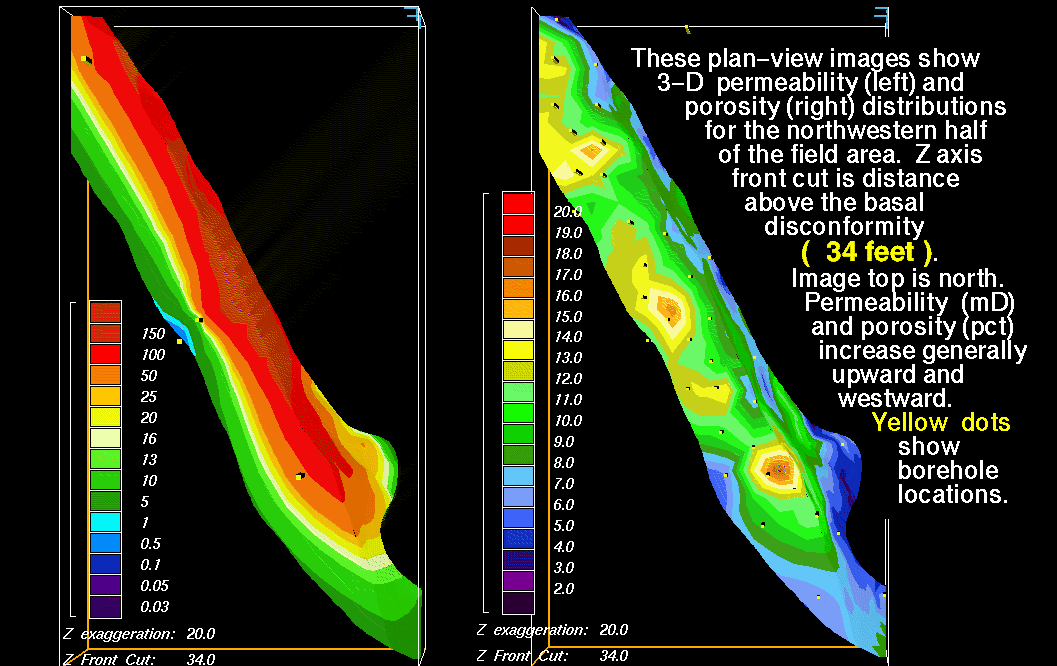
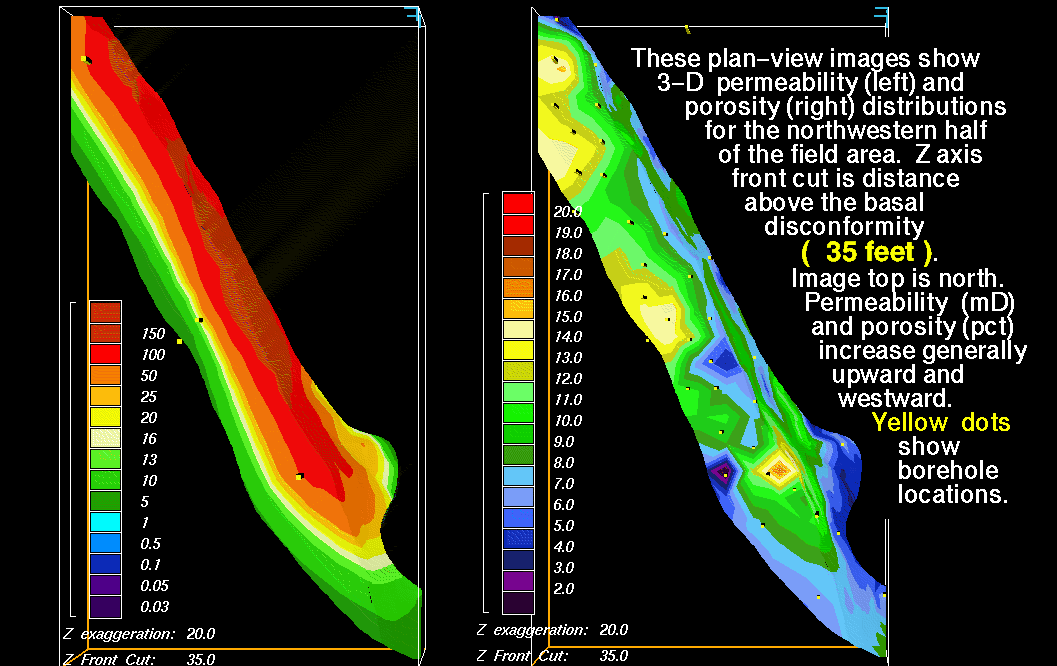
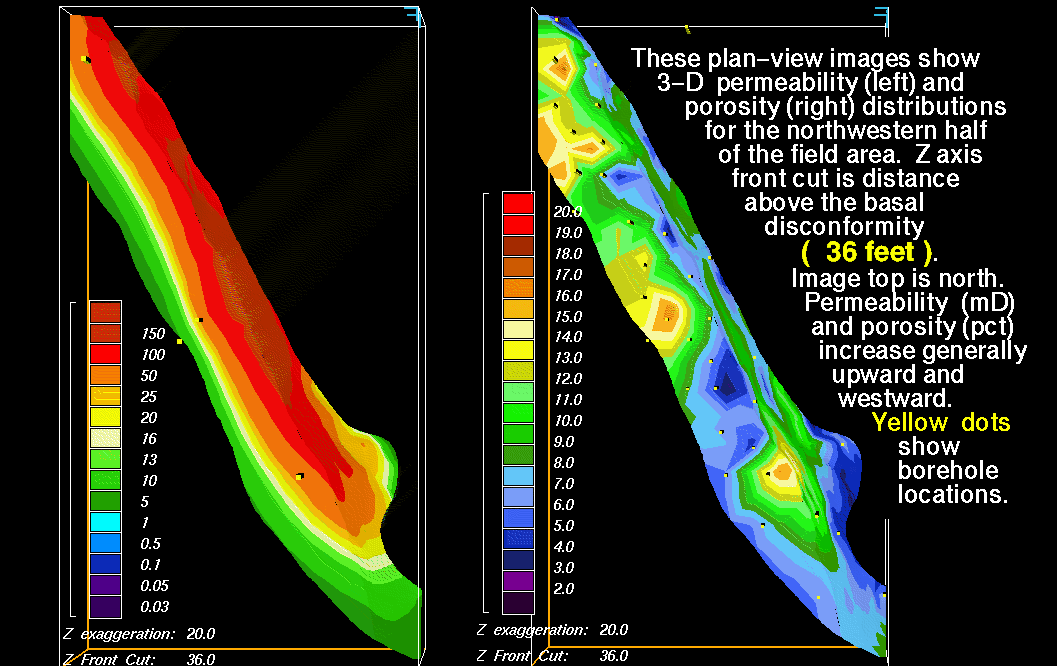
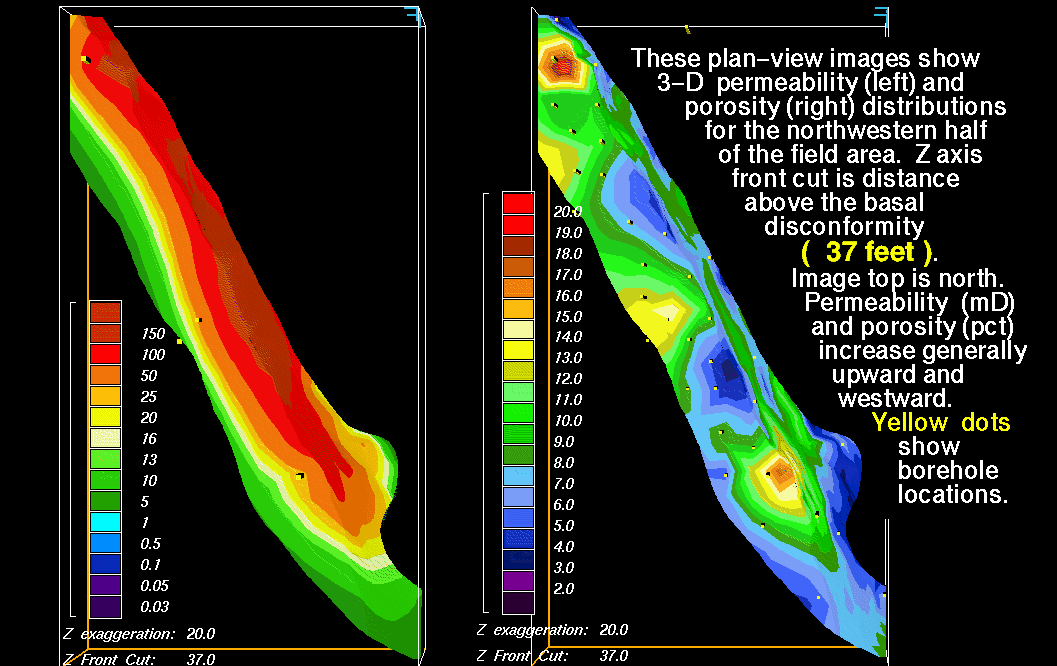
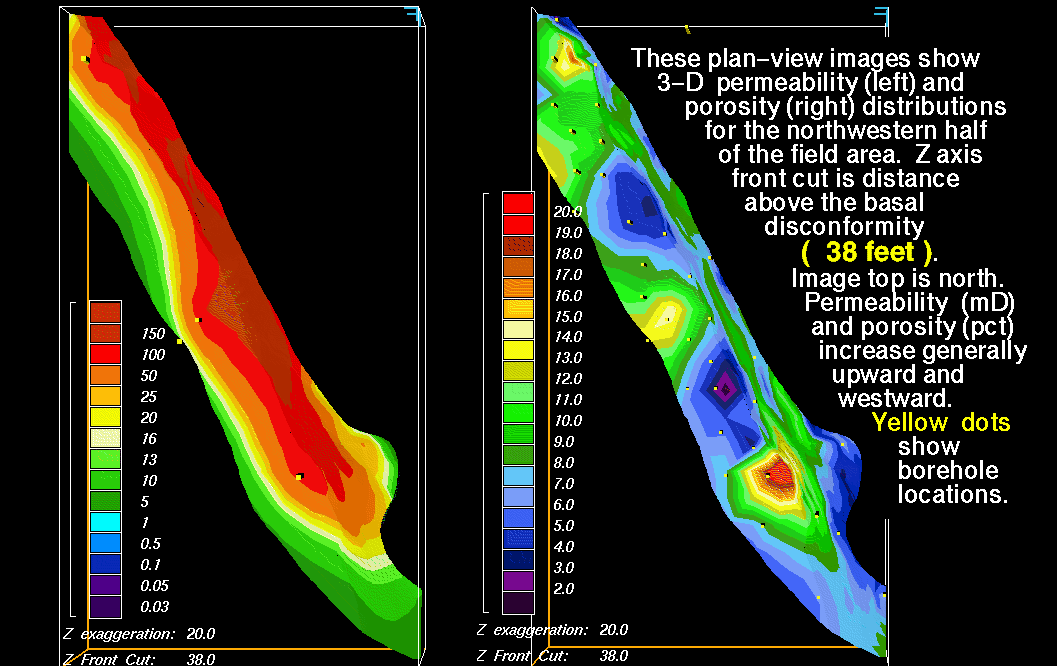
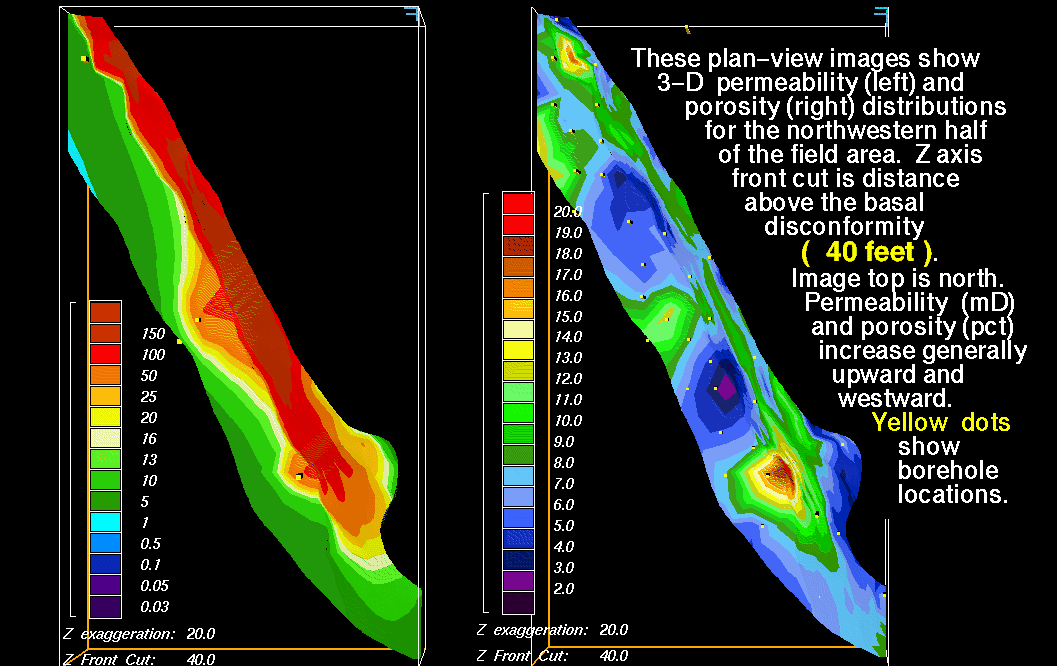
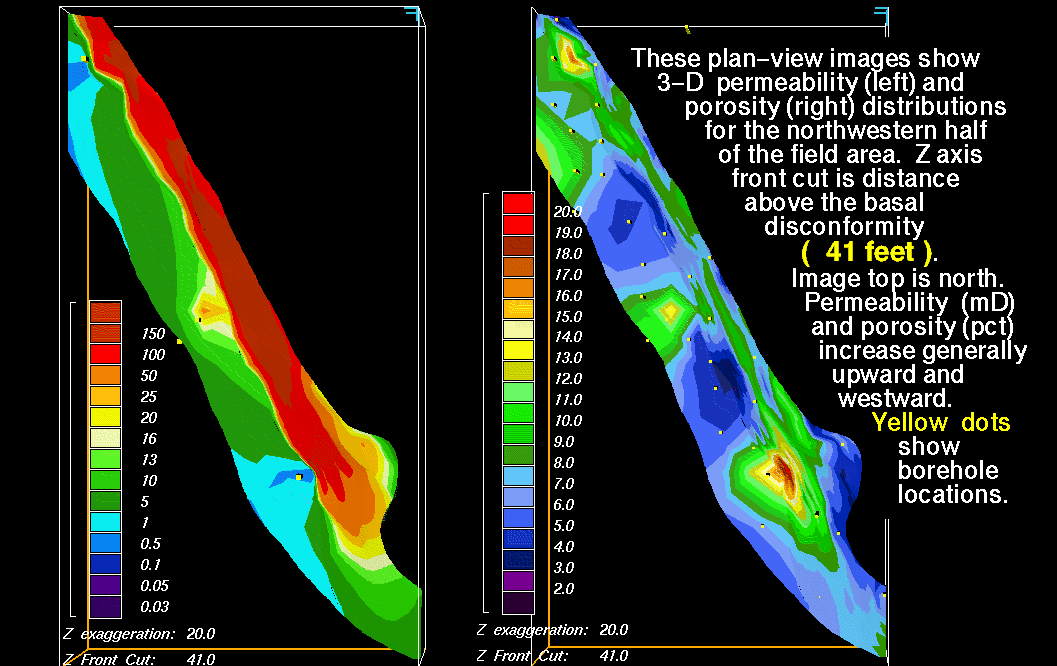
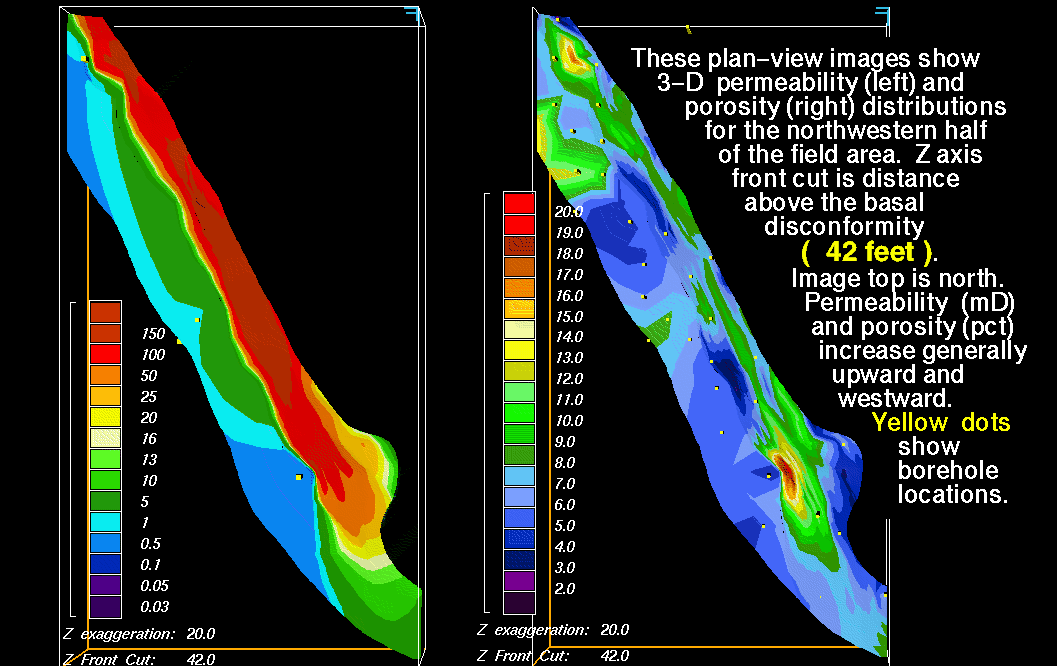
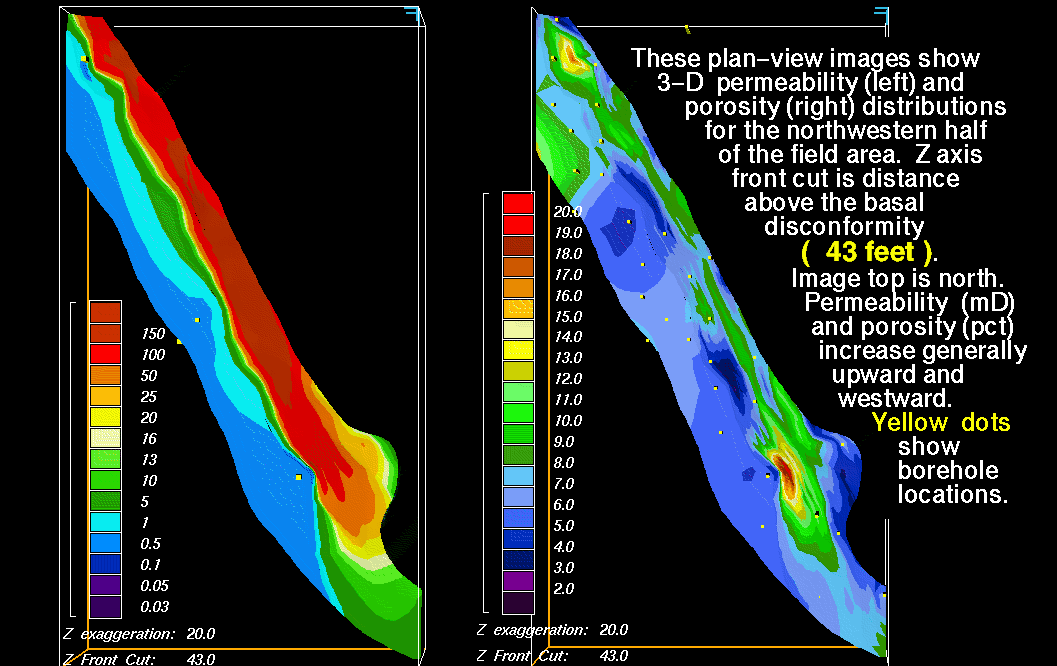
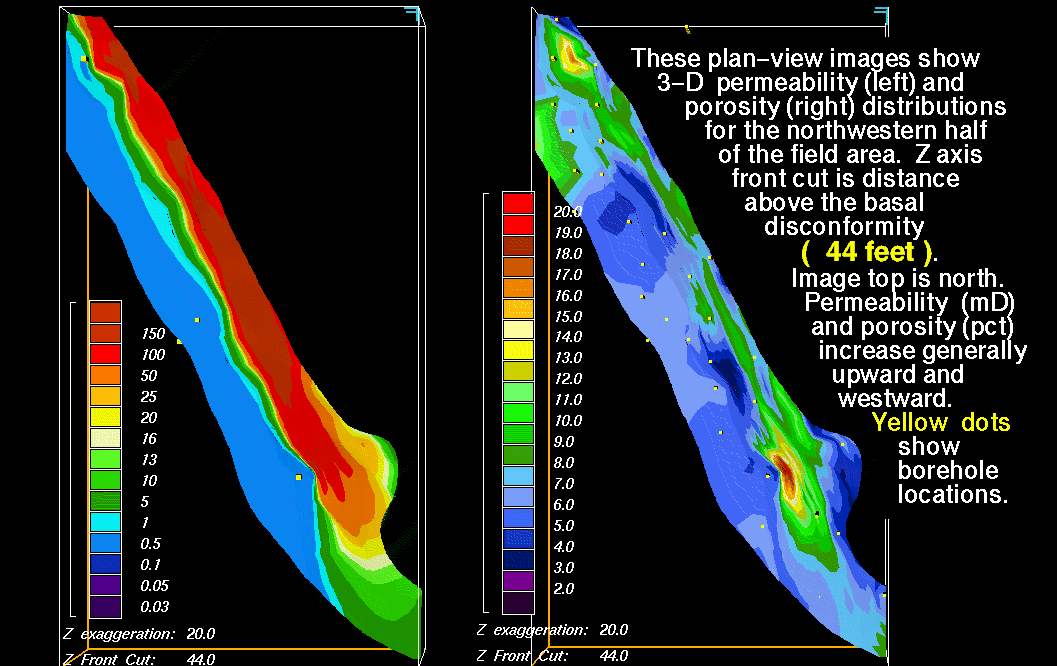
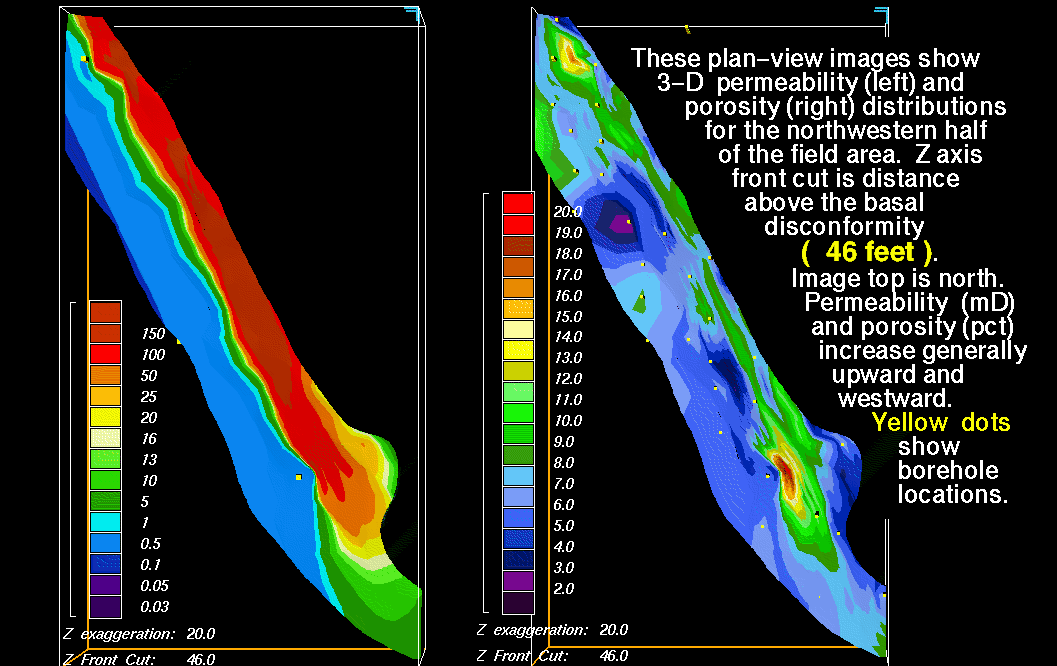
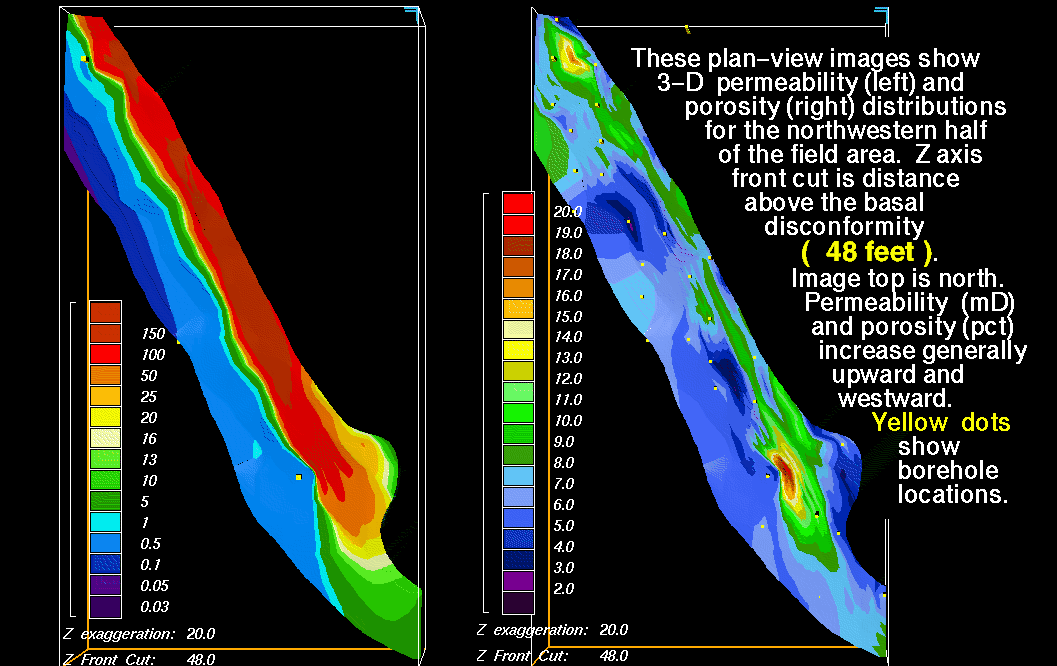
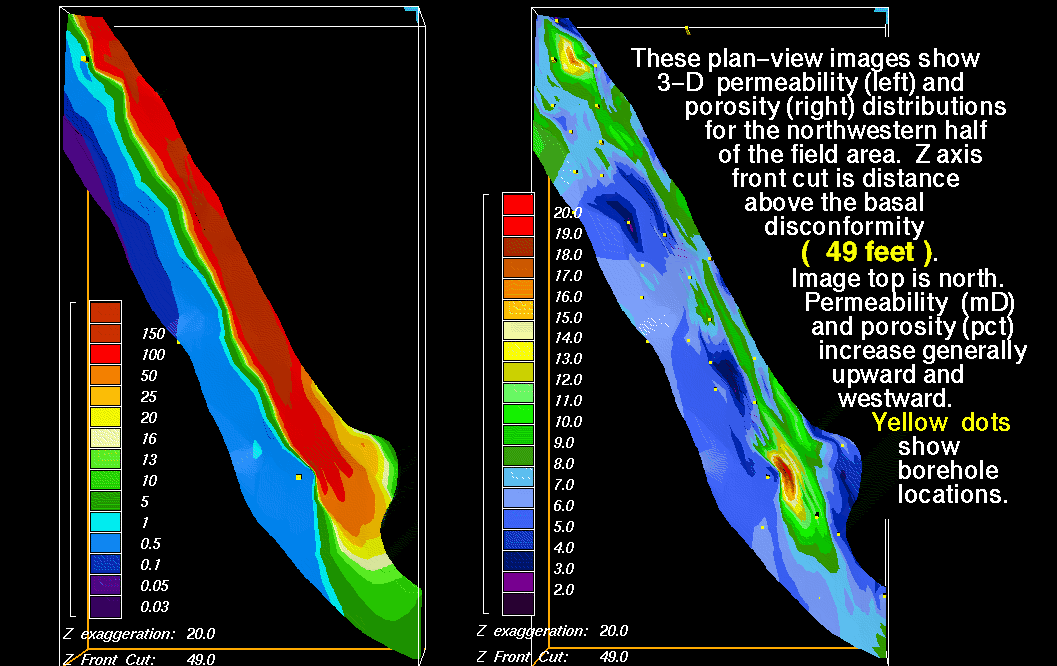
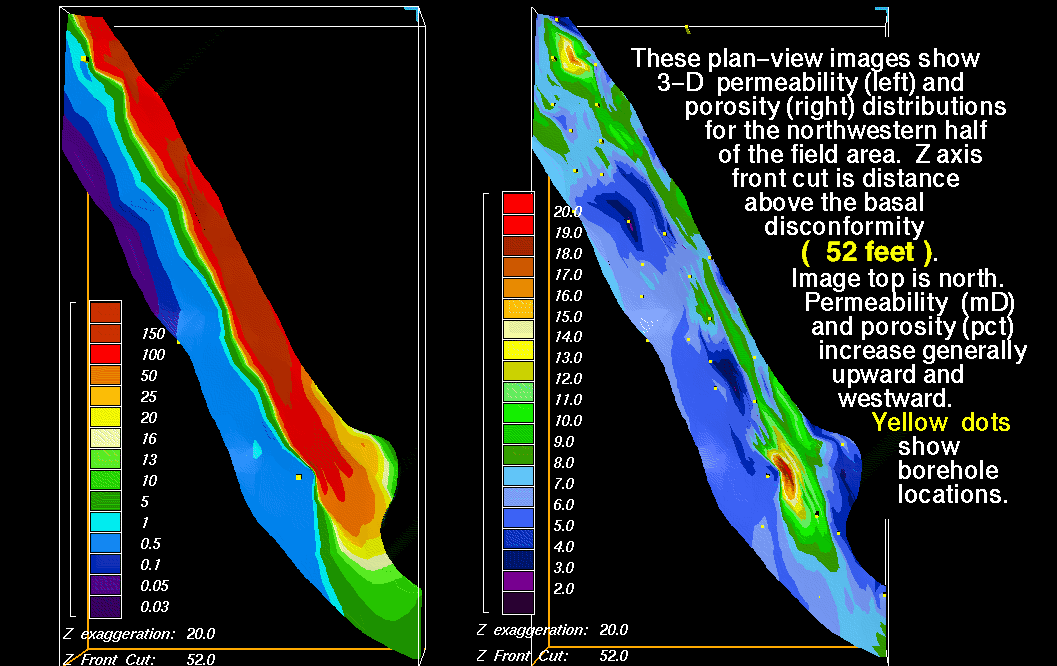