|
|
Mapping Results
Grain Size
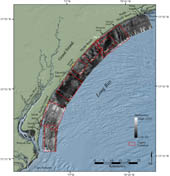 |
Figure 4. Map showing sidescan-sonar image within the study area.
Click on figure for larger image and full caption.
|
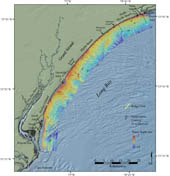 |
Figure 5. Map showing the bathymetry within the study area.
Click on figure for larger image and full caption.
|
|
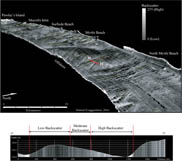
fig. 11.Perspective sidescan-sonar imagery and bathymetric profile looking towards the southwest.
Click on figure for larger image and full caption.
|
|
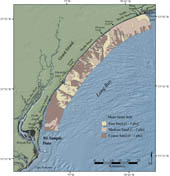
fig. 15. Map showing the mean grain size of surficial sediments in the study area.
Click on figure for larger image and full caption.
|
|
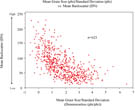
fig. 16. Plot showing mean grain size/standard deviation versus mean backscatter for surficial sediment samples collected within the study area.
Click on figure for larger image and full caption.
|
|
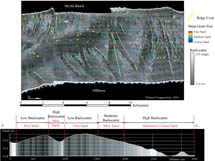
fig. 17. Perspective view of sidescan-sonar imagery looking towards Myrtle Beach.
Click on figure for larger image and full caption.
|
|
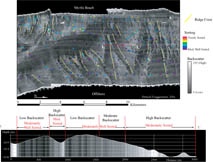
fig. 18. Perspective view of sidescan-sonar imagery looking towards Myrtle Beach.
Click on figure for larger image and full caption.
|
The surface sediments of the inner shelf within Long Bay primarily consist of poorly sorted sands (Appendix A). Grain size distribution within the study area ranges from very coarse sand (-1 phi) to a coarse silt (6 phi), with a mean grain size of medium sand (1.6 phi) (fig. 15). Sorting ranges from well sorted (0.39 phi) to very poorly sorted (2.94 phi), with a mean of poorly sorted (1.09 phi).
In order to evaluate the relationship between variations in textural properties of the surficial sediment and acoustic backscatter, mean backscatter values were extracted from the sidescan-sonar imagery using a 10-m radius around sample locations and plotted against mean grain size divided by sorting (fig. 16). The 10-m radius was chosen to account for navigational uncertainty in sample locations. Samples were excluded from analysis if the 10-m radius encompassed backscatter transitions, for example an abrupt boundary between high and low backscatter. Ninety-nine samples fell along backscatter transitions, leaving 623 samples for analysis.
There is a wide range of scatter and no statistically significant correlation between mean grain size divided by standard deviation versus mean backscatter (fig. 16). However, a qualitative relationship exists between grain size distribution and sorting, variations in backscatter and sea floor morphology (figs. 4, 5 and 15). For example, the surficial sediments within the low backscatter expanses of the inlet shoal complexes and the shore-detached shoal consist predominately of moderately sorted, fine sand (mean sorting = 0.8 phi; mean grain size = 2.34 phi). In contrast, the surface sediments within the moderate to high backscatter, gently sloping regions offshore of Surfside Beach and Pawley's Island consist of poorly sorted, medium to coarse sand (sorting = 1.33 phi; mean grain size = 1.05 phi). The less expansive regions of mixed low to moderate backscatter display variable bathymetry (low-relief ridges and areas of gently sloping sea floor) and are characterized by poorly sorted, medium sands (sorting = 1.05 phi; mean grain size = 1.6 phi).
Grain size and sorting distributions along the low-relief ridges offshore of Myrtle Beach further exemplify these patterns. Surficial sediment generally becomes finer along a transect that begins in the high backscatter trough, rises up the gentle north-facing slope, and ends at the crest. Sorting follows a similar pattern along the same transect, with relatively poorly sorted material in the trough and slightly better sorted material on the north-facing slope and crest. Although the vertical exaggeration of the perspective views within figs. 17 and 18 is extreme (200x) and ridges only show ~1 m of vertical relief over horizontal distances of ~2 km, the general association of fining grain size and improved sorting to position on the ridge (i.e., crest, trough, or flank) appears to be characteristic of the study area (fig. 11). Textures are generally finer and better sorted on the crests and north-facing slopes, whereas textures are coarser and less well sorted in the troughs and south-facing slopes.
|

 Back to Previous Section
 Forward to Next Section