|
|
Mapping Results
Sidescan-Sonar
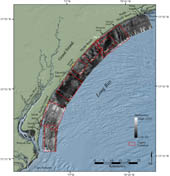 |
Figure 4. Map showing sidescan-sonar image within the study area.
Click on figure for larger image and full caption.
|
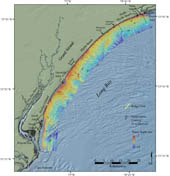 |
Figure 5. Map showing the bathymetry within the study area.
Click on figure for larger image and full caption.
|
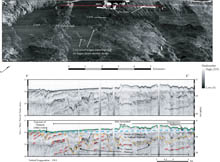 |
Figure 7. Sidescan-sonar imagery and chirp seismic-reflection profile offshore of Murrells Inlet.
Click on figure for larger image and full caption.
|
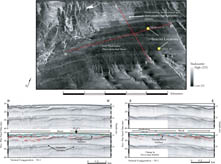 |
Figure 8. Sidescan-sonar imagery and chirp seismic-reflection profiles offshore of northern Myrtle Beach.
Click on figure for larger image and full caption.
|
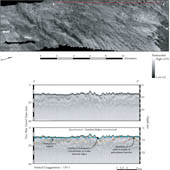 |
Figure 9. Sidescan-sonar imagery and chirp seismic-reflection profile on the inner shelf.
Click on figure for larger image and full caption.
|
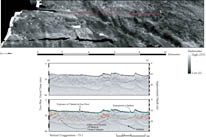 |
Figure 10. Sidescan-sonar imagery and chirp seismic-reflection profile on the inner shelf offshore of North Island.
Click on figure for larger image and full caption.
|
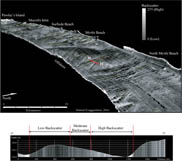 |
Figure 11. Perspective sidescan-sonar imagery and bathymetric profile looking towards the southwest.
Click on figure for larger image and full caption.
|
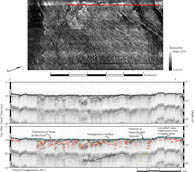 |
Figure 12. Sidescan-sonar imagery and chirp seismic-reflection profile offshore of Surfside Beach.
Click on figure for larger image and full caption.
|
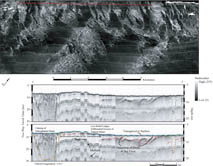 |
Figure 13. Sidescan-sonar imagery and chirp seismic-reflection profile directly offshore of Myrtle Beach.
Click on figure for larger image and full caption.
|
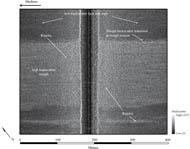 |
Figure 14. Sidescan-sonar image offshore of Myrtle Beach.
Click on figure for larger image and full caption.
|
The variation in acoustic backscatter within the sidescan-sonar imagery reveals the complexities of the sea floor within Long Bay (fig. 4). High backscatter, or a strong acoustic return, is represented by light tones and low backscatter, or a weak acoustic return, is represented by dark tones. Three primary regimes have been identified based on dominant backscatter characteristics of the sea floor: 1) uniform areas of low backscatter, 2) uniform areas of moderate to high backscatter, and 3) patchy areas of mixed low and high backscatter.
1) Areas of Low Backscatter
Two expanses of uniform low backscatter lie offshore of Myrtle Beach and Murrells Inlet and correspond to localized bathymetric highs; the shore-detached shoal and inlet shoal complex, respectively (fig. 4 and 5). Low backscatter extends from the shoreface to the offshore extent of the survey in both locations. The shore-detached shoal offshore of Myrtle Beach is bound by areas of moderate to high backscatter, with more abrupt backscatter gradients to the north and west than to its south/southeast. To the north, a series of cross-hatched shore-normal and shore-parallel thin bands of high-backscatter (< 500 m in length) abut the shoal. To the west, a well defined transition from low to high backscatter borders the shoal. A more gradual transition exists along its south/southeastern boundary, where backscatter grades from low to a region of patchy low to moderate backscatter that extends to the seaward edge of the survey area (fig. 8).
The inlet shoal complex offshore of Murrells Inlet is characterized by large expanses of low backscatter with isolated areas of moderate backscatter (fig. 7). Sharp transitions exist between the low backscatter expanses and adjacent moderate to high backscatter areas along the south/southwest and north/northeast borders of the complex. The low-backscatter expanses correspond to the south/southwest sides and crests of the shore-perpendicular shoals, while the north/northeast sides and trough are characterized by moderate backscatter (fig. 11). Narrow bands of shore-oblique, moderate backscatter extend from the shoreface to the offshore extent of the survey area and average < 100 m wide and ~1 km long. The moderate backscatter signature corresponds to the trough of a series of low-relief ridges superimposed upon the larger shoal complex (fig. 5). The low-relief ridge crests and sides are characterized by low backscatter (fig. 7).
2) Areas of Moderate to High Backscatter
Two expanses of moderate to high backscatter lie offshore of Surfside Beach and between Pawley's Island and the mouth of Winyah Bay (fig. 4). Little bathymetric variability is present within the high-backscatter region offshore of Surfside Beach; the area is characterized by a gently, seaward dipping sea floor and complex patterns of shore-normal and sinuous high-backscatter (fig. 12). The area is bordered by the low-backscatter expanse of the Murrells Inlet shoal complex to the south, and patchy regions of low to moderate backscatter to the north.
The high-backscatter area offshore of Pawley's Island shows slight bathymetric variability. Small-scale, shore-oblique ridges (< 1 m relief) lie inshore of the 8-m isobath and are characterized by high backscatter on the southern side and moderate backscatter along the northern side and trough (fig. 9). Offshore of the 8-m isobath to the seaward edge of the survey area, relatively uniform high backscatter covers a gently, seaward dipping sea floor, with few bathymetric perturbations. Offshore of North Island to the south, large-scale, shore-oblique ridges show moderate backscatter on the southern sides and high backscatter along the northern sides and troughs (fig. 10).
3) Areas of Mixed Low, Moderate, and High Backscatter
Localized areas of low, moderate, and high backscatter on the inner shelf are located primarily from Myrtle Beach north to Little River Inlet (fig. 4). The complex backscatter patterns correspond to a series of low-relief ridges trending roughly northwest (NW) to southeast (SE). In water depths less than 9-m off Myrtle Beach, low backscatter covers the SW-facing sides and crests of the ridges, and moderate to high backscatter cover the NE-facing sides and trough (fig. 11). The transition from low to high backscatter across these features is gradual. More abrupt backscatter transitions are present inshore of the 9-m isobath, where shore-normal bands of low and high backscatter extend seaward from the shoreface (fig. 13). High backscatter appears to be concentrated within the trough of shore-normal low-relief ridges, with low backscatter along the crest. In some locations, shore-parallel ripples were resolved within the high backscatter troughs. Figure 14 displays ripple crests present within one trough and illustrate the characteristically sharp transition between high to low backscatter at trough margins.
Complex patterns of moderate to high backscatter are present offshore of North Myrtle Beach north to Little River Inlet, where the sea floor displays a gentle, seaward-dipping slope. Little bathymetric variability appears to be associated with the shore-normal regions of low and high backscatter offshore of the 9-m isobath.
|

 Back to Previous Section
 Forward to Next Section