|
|
Mapping Results
Bathymetry
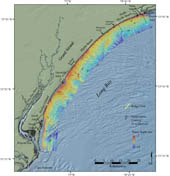
The inner shelf of Long Bay exhibits a low-relief, gently seaward-dipping sea floor. Water depths range from 4 m in nearshore areas (< 1 km offshore) to 14 m at the seaward edge of the survey area (10 km offshore)
(fig. 5). Average sea floor gradients vary across the shelf. The steepest slopes of 1 - 4 m/km occur in nearshore areas (landward of the 7-m isobath) and decrease to 0.5 -1 m/km in offshore areas. The gentle seaward dip is interrupted in many locations by isolated bathymetric highs defined here as large-scale shoals, associated with modern inlets or shore-detached, and smaller-scale, low-relief ridges present throughout the study area (table 1). Shoals and ridges were identified using swath bathymetry and seismic-reflection profiles. Figure 3 outlines the location of inlet-associated and shore-detached shoals. Ridge crests are outlined on figure 5 and ridge morphology is summarized in table 2.
Table 1: Feature Classification
Shoals
- large features
- > 5 km in length and width, > 1 m in height
- Inlet-associated
- Little River Inlet
- Murrells Inlet
- North Inlet
|
Ridges
- smaller, low-relief features
- < 5 km in length, < 2 km in width, < 1.5 m in height
- present throughout the study area
|
Table 2: Ridge Morphology and Orientation
| Ridge Location |
Ridge Length (km) |
Ridge Width (km) |
Ridge Height (m) |
Mean Crest Azimuth - Degrees from North |
N. Myrtle Beach to Myrtle Beach
Offshore (> 9 m water depth) |
1 - 2.5 |
0.5 - 1.5 |
0.5 - 1.0 |
100 |
| Myrtle Beach - Nearshore (< 9 m water depth) |
< 0.5 - 3 |
0.1 - 1.0 |
<1.0 |
125 |
| Murrells Inlet Shoal Complex |
0.4 - 3 |
0.5 - 1.5 |
0.5 - 1.5 |
85 |
| Pawley's Island to Winyah Bay Shoal Complex |
< 1 - 6 |
0.1 - 1.0 |
0.5 - > 3.0 |
60 |
Shoals
Inlet-Associated
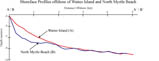
Offshore of Waites Island, an inlet shoal complex abuts the shoreface and extends along the coast from Little River Inlet to North Myrtle Beach. Variations in shoreface profiles illustrate the along- and cross-shore extent of the shoal complex (fig. 6). Seaward of Waites Island, the shoreface has a gentle slope with average gradients of ~2 - 4 m/km in < 7 meter water depth. To the southwest, the shoreface steepens and exhibits average gradients of ~6 - 8 m/km in < 7 meter water depth, marking the southern terminus of the shoal complex.
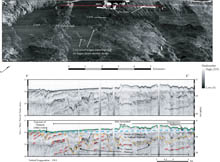
Offshore of Murrells Inlet a series of well-developed, shore-perpendicular shoals extend from the shoreface to the offshore extent of the survey area, ranging from ~5 - 12 m water depth (fig. 5). The shoals generally are 1 - 2 m high, 4 - 5 km wide, and 10 km long and show some asymmetry with slightly steeper NE-facing sides (fig. 7).
Offshore of North Inlet, a third inlet shoal complex extends from the nearshore bounds of the survey (1 km offshore; ~5 m water depth) to the ~8-m isobath (~5 km offshore) and along the coast from the southern edge of Pawley's Island south to North Island (fig. 3). Average gradients offshore of North Inlet are 2 - 4m/km in < 8 m water depth (fig. 5).
Shore-detached
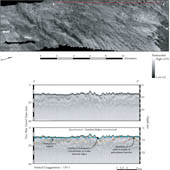
A large, shore-oblique, N/NE-S/SW trending shoal extends from the shoreface offshore of northern Myrtle Beach to the offshore edge of the study area, in water depths ranging from ~7 - 12 m (fig. 5). The shoal is ~2 m high, 5 - 6 km wide, and 11 km long and shows no discernable asymmetry (fig. 8).
Ridges
Small-scale, low-relief ridges range from the shoreface to the offshore extent of the survey area from North Myrtle Beach to Winyah Bay (fig. 5). These features average < 1 m high and ~1 km wide and range in length from 0.5 to 3 km. Orientation varies from shore-perpendicular to shore-oblique, with shore-perpendicular features lying primarily offshore of Myrtle Beach. Little to no asymmetry is observed along these shore-normal features.
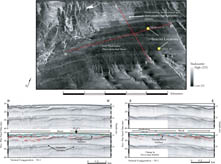
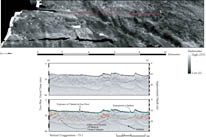
Between Pawley's Island and the southern extent of the survey area, the inner shelf is characterized by a NE-SW bathymetric fabric produced by a series of shore-oblique sand ridges (fig. 5). Directly offshore of Pawley's Island, the ridges are moderately- to poorly-developed (~1 to 2 m in height, < 0.5 km in width, and 1 km in length), have little to no asymmetry, and trend NE-SW from the shoreface to the 9-m isobath (fig. 9). The ridges become well-developed offshore of North Island (~2 to 6 m high, 0.5 to 1 km wide, and 1 to 6 km long), where they exhibit definitive asymmetry (steep southern facing slopes), and trend NE-SW from the shoreface to the offshore extent of the survey area (fig. 10). More subtle bathymetric highs, directly offshore of North Inlet and just north of the mouth of Winyah Bay, represent the smaller inlet shoal complexes associated with North Inlet and Winyah Bay.
|
|
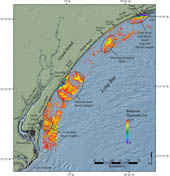
Figure 3. Map showing the thickness of modern sediment within the study area.
Click on figure for larger image and full caption.
|
|
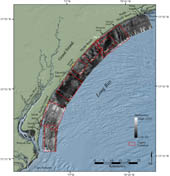
Figure 4. Sidescan-sonar image of the study area and figure locations.
Click on figure for larger image and full caption.
|
|
Figure 5. Map showing the bathymetry within the study area.
Click on figure for larger image and full caption.
|
|
Figure 6. Bathymetric profiles across the shoreface and inner shelf of Long Bay.
Click on figure for larger image and full caption.
|
|
Figure 7. Sidescan-sonar imagery and chirp seismic-reflection profile across the inlet shoal complex offshore of Murrells Inlet.
Click on figure for larger image and full caption.
|
|
Figure 8. Sidescan-sonar imagery and chirp seismic-reflection profiles on the inner shelf offshore of northern Myrtle Beach.
Click on figure for larger image and full caption.
|
|
Figure 9. Sidescan-sonar imagery and chirp seismic-reflection profile on the inner shelf offshore of Pawley's Island.
Click on figure for larger image and full caption.
|
|
Figure 10. Sidescan -sonar imagery and chirp seismic-reflection profile on the inner shelf offshore of North Island.
Click on figure for larger image and full caption.
|
| |

 Back to Previous Section
 Forward to Next Section