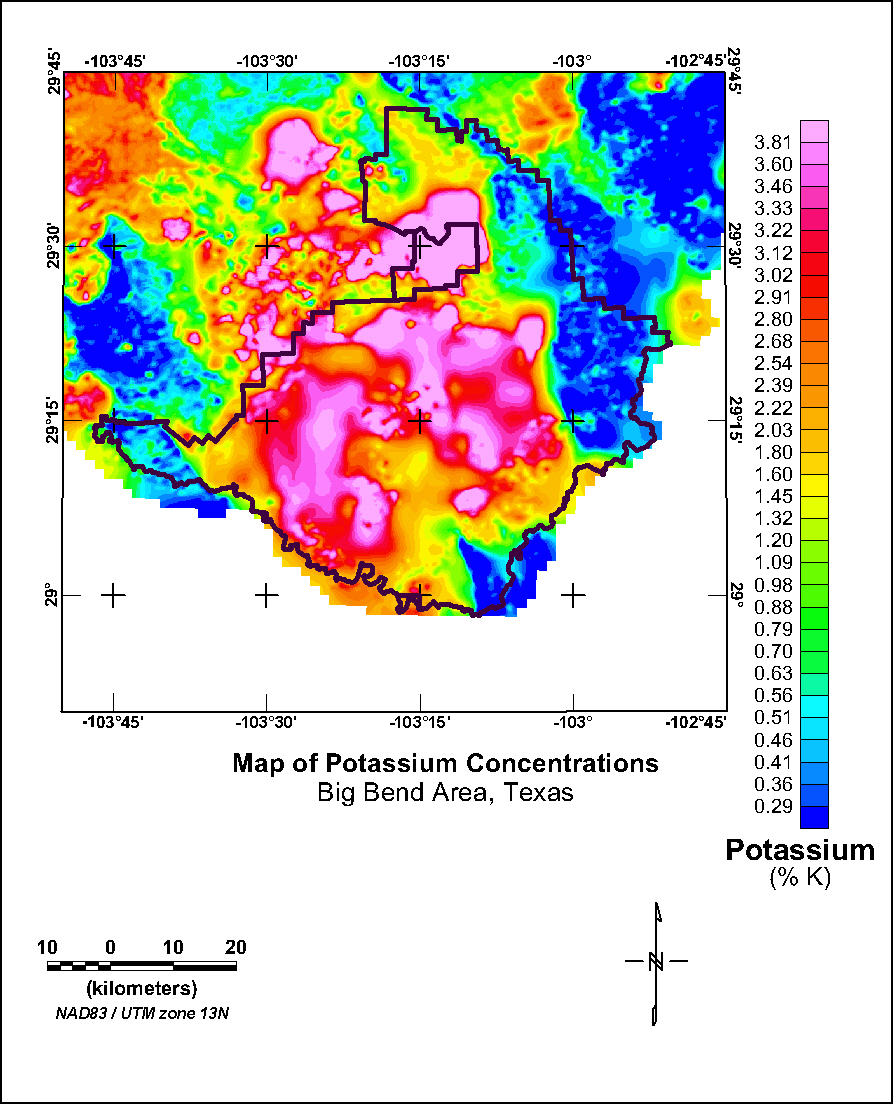
Figure 6. Map showing potassium concentrations in the Big Bend study area. The black lines mark the boundary of the Big Bend National Park.
K Map | U Map | Th Map | Gamma-ray Map | Landsat Visible | Landsat Red | Landsat Infrared | Landsat Color | DEM
Intro | Geology | Gamma-ray Data | Landsat Data | Discussion | Conclusions | Listing of Data Files | References | Tutorial

![]() U.S. Department of the Interior |
U.S. Geological Survey
U.S. Department of the Interior |
U.S. Geological Survey
URL: http://pubsdata.usgs.gov/pubs/of/2005/1371/html/Kmap.htm
Page Contact Information: Stephen Snyder
Page Last Modified: Saturday, 12-Jan-2013 21:45:09 EST