
| Lake Pontchartrain Basin: Bottom Sediments and Related Environmental Resources |
![]() Back to Contents
Back to Contents
LIST OF FIGURES
Figure 1. Example of a relational database query
Figure 2. Relationships between EMAP sediment tables
Figure 3. Flow chart showing database development
Figure 4. Map showing sample locations by source
Figure 5. Map showing areas in "AREA_CODE" field
Figure 6. Map showing numbered grid squares in "AREA_CD_SQ" field
Figure 7. Log-log plot for Zn:Al
Figure 8. Log-log plot for Zn:Cr
Figure 9. Log-log plot for Zn:Cu
Figure 10. Log-log plot for Zn:As
Figure 11. Linear plot of Fe and Zn data
Figure 12. Grain size distribution draped over bathymetry
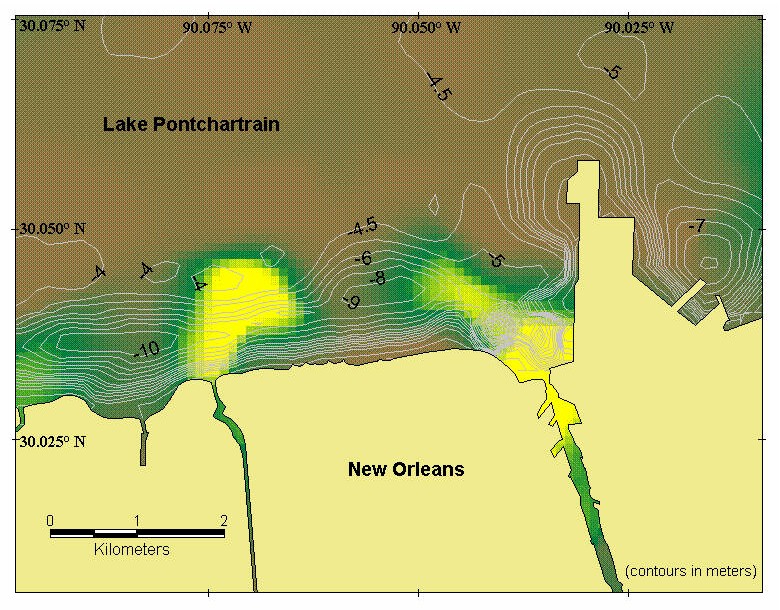
Figure 13. Grain size distribution in New Orleans shore area
Figure 14. Physiography in the vicinity of New Orleans, circa 1750 A.D.
Figure 15. Histogram distribution of organic carbon concentrations
Figure 16. Organic carbon concentrations in sediments from Lakes Pontchartrain and Maurepas
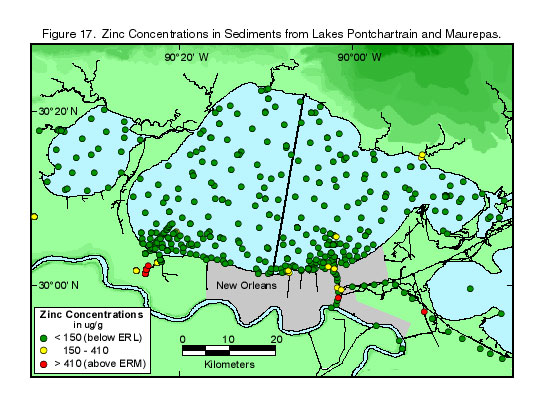
Figure 17. Zinc concentrations in sediments from Lakes Pontchartrain and Maurepas
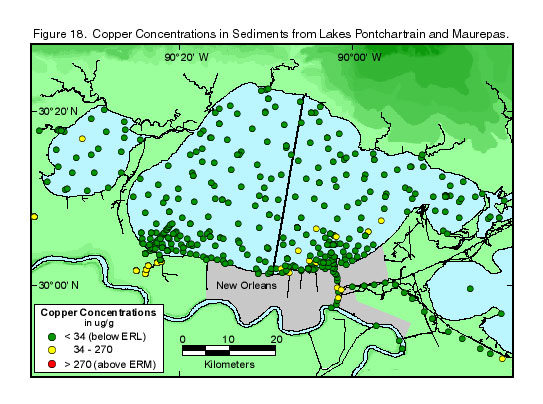
Figure 18. Copper concentrations in sediments from Lakes Pontchartrain and Maurepas
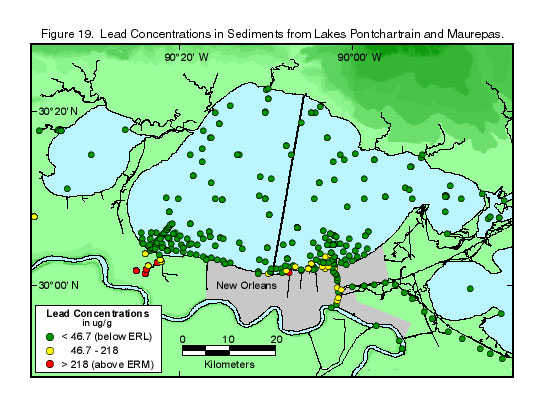
Figure 19. Lead concentrations in sediments from Lake Pontchartrain
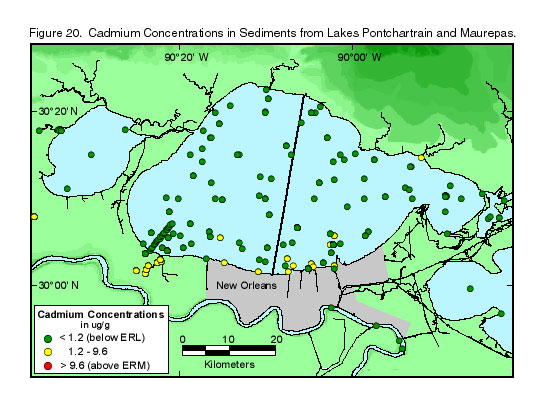
Figure 20. Cadmium concentrations in sediments from Lakes Pontchartrain and Maurepas
Figure 21. Chromium concentrations in sediments from Lakes Pontchartrain and Maurepas
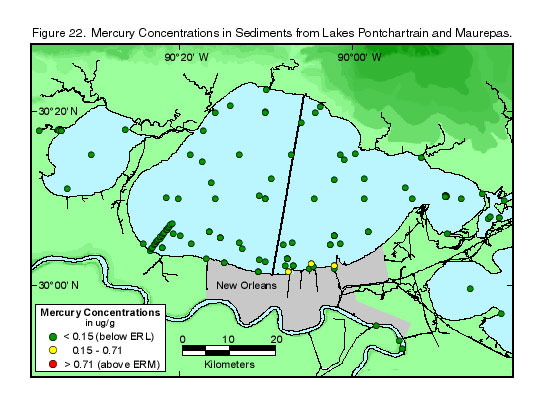
Figure 22. Mercury concentrations in sediments from Lakes Pontchartrain and Maurepas
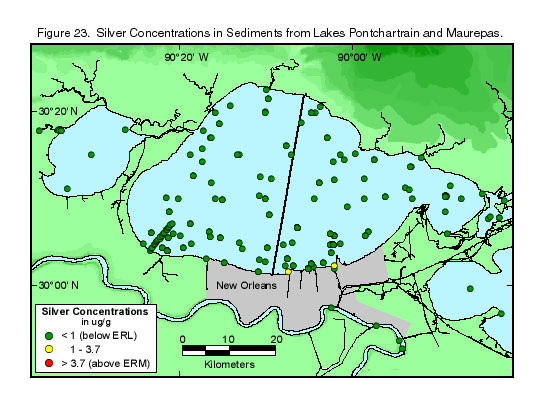
Figure 23. Silver concentrations in sediments from Lakes Pontchartrain and Maurepas
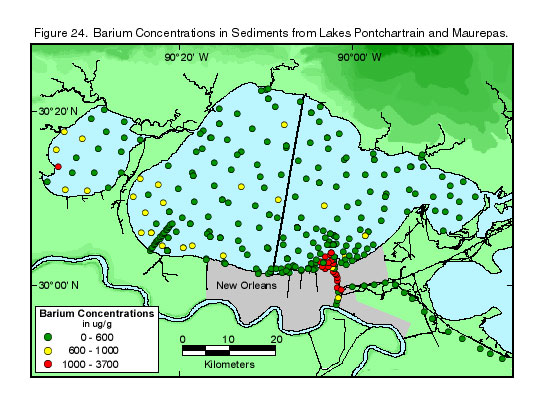
Figure 24. Barium concentrations in sediments from Lakes Pontchartrain and Maurepas
Figure 25. Log-log plot of phenanthrene versus four PAHs
Figure 26. Perylene concentrations in sediments from Lakes Pontchartrain and Maurepas
Figure 27. Pyrene concentrations in sediments from Lakes Pontchartrain and Maurepas
Figure 28. PCB 44 concentrations in sediments from southeastern Louisiana waterways
Figure 29. Seston distribution interpreted from remote sensing data, March 24, 1997
Figure 30. Seston distribution interpreted from remote sensing data, March 26, 1997
Figure 31. Profiles of zinc and copper concentrations near the Bonnet Carré Spillway
Figure 32. Plots of copper and lead against zinc (Bonnet Carré Spillway)
Figure 33. Lead concentration in a dated core from the Mississippi Delta
Figure 34. Selected frequency distributions for metal concentrations in sediments
Figure 35a. Bathymetric detail for location of vibracore VC 98-3 in dredged pit off New Orleans
Figure 35b. X-ray CAT scan and photograph of split vibracore VC 98-3
Figure 35c. Lead concentrations in vibracore VC 98-3
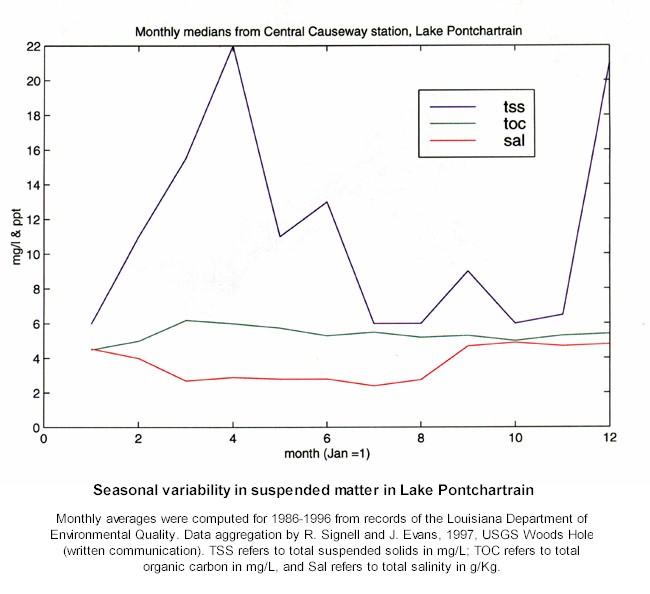
Figure 36. Seasonal variability in suspended matter in Lake Pontchartrain
Figure 37. Water quality data, Mississippi River Station
Figure 38. Water quality data, north of New Orleans
Figure 39. Water quality data, north shore of Lake Pontchartrain
Figure 40. Metals in leachate analyses of sediments as a fraction of total metal content
LIST OF TABLES
Table 1. Sample from the consolidated data table, a flat file
Table 2. Sediment chemistry table from USEPA
Table 3. Example of "horizontal" format for Pontchartrain chemistry table
Table 4. Sample of data dictionary
Table 5. Sample of station data table
Table 6. Sample of inorganic data (metals)
Table 7. List of sediment data sources and sponsoring agencies
Table 8. Alert range rable
Table 9. Means and standard deviations for metal concentrations in Lake Pontchartrain sediments
Table 10. Organic constituents (in order of frequency of occurrence)
Table 12. Pollutant concentrations for selected contaminant metals in Lake Pontchartrain surficial sediments
Table 13. Biological oxygen demand (BOD) and total suspended solids (TSS) in surface water samples
Table B1. Codes used in qualifier field of sediment database
Table B2. Interpretive notes
Table B3. Station class codes used for USEPA EMAP data in sediment database
Table B4. Miscellaneous abbreviations used in sediment database
![]() Back to Contents
Back to Contents