Link to USGS home page
Prepared in cooperation with the Miami-Dade Department of Environmental Resources Management
Correlation Analysis of a Ground-Water Level Monitoring Network, Miami-Dade County, Florida

By Scott T. Prinos

The topic is Coastal Erosion. Open-File Report 2004-1412
Abstract
Introduction
Correlation Analysis of a Ground-Water Level Monitoring Network
Analytical Considerations
Spatial Relations
Seasonal Water-Level Variation
Temporal Changes in Correlation Between Monitoring Wells
Evaluating Correlation of Water-Level Data
Analysis Methodology
Analysis Results
Summary
References Cited
Appendixes I & II
image of Duval County, Florida

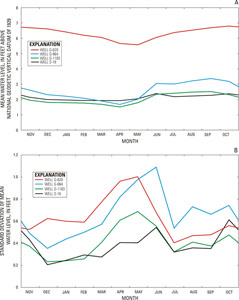
CORRELATION ANALYSIS OF A GROUND-WATER LEVEL MONITORING NETWORK

Analytical Considerations

Seasonal Water-Level Variation

The seasonal pattern of rainfall, combined with the way in which the hydrologic system is managed in southern Florida, creates distinct differences in the water levels at monitoring wells in the wet and dry seasons. The seasonal variation in aquifer water levels depends on the hydrology and management of the area. The monthly variation in mean water levels and the variation in monthly standard deviation of water levels for wells G-620, G-864, G-1183, and S-18 are shown in figure 4. Some differences in water levels that occur seasonally at these wells include the: (1) timing of the transition from lowest to highest water level, with the lowest water levels typically occurring in May at well G-620 and in April at wells G-1183 and G-864; (2) extent of variation in mean monthly water levels, with mean monthly water levels and their standard deviation displaying less seasonal variation at well S-18 than at wells G-620, G-864, and G-1183; and (3) timing and extent of monthly standard deviation of water levels, with the monthly standard deviation of water levels being greater at well G-864 than at well G-620 from May to October, but the reverse being true from November to April. These seasonal differences in water levels, whether responding primarily to natural or anthropogenic effects, in turn, can affect the extent of correlation of the water-level data being compared.

Graphs showing seasonal variation in mean water levels and variation in monthly standard deviation of mean water levels for wells G-620, G-864, G-1183, and S-18. Figure 4. Graphs showing seasonal variation in mean water levels and variation in monthly standard deviation of mean water levels for wells G-620, G-864, G-1183, and S-18. Link to larger version

The widely varying amounts of rainfall at differing locations that occur in southern Florida particularly during the wet season (fig. 3A and 3B) can have a direct effect on how well the water-level data from different monitoring wells correlate. Conversely, during the dry season, the allocation of water through the system of canals, control structures, and well fields can become an overriding factor in determining whether water levels at two different wells will correlate. Therefore, an important consideration is whether water levels at wells in the ground-water monitoring network correlate from season to season.

Next:


Figures: Click on a caption to view the figure.
Figure 1. Map showing location of continuous ground-water level monitoring network wells in Miami-Dade County, Florida.

Figure 2. Map showing water-supply and water-management systems in Miami-Dade County.

Figure 3. Maps showing lines of equal rainfall in Miami-Dade County during (a) Hurricane Irene on October 14-16, 1999, and an (b) unnamed storm on October 2-3, 2000.

Figure 4. Graphs showing seasonal variation in mean water levels and variation in monthly standard deviation of mean water levels for wells G-620, G-864, G-1183, and S-18.

Figure 5. Hydrograph showing variation in water levels at wells G-3 and G-1368A along with estimated average daily pumpage based on annual pumpage totals during water years 1974-2000.

Figure 6. Hydrograph showing variation in water level at well G-1502 during water years 1974-2000.

Figure 7. Map showing grouping of wells based on average correlation of water-level data during the wet season.

Figure 8. Map showing grouping of wells based on average correlation of water-level data during the dry season.

Figure 9. Map showing grouping of wells based on average correlation of water-level data during both the wet and dry seasons.

Figure 10. Map showing grouping of wells near the West Well Field based on average correlation of water-level data during both wet and dry seasons.

Figure 11. Graph showing temporal variation in seasonal correlation between water-level data from well G-1487 and that of well G-855 during water years 1974-2000.

Figure 12. Hydrographs showing water-level elevations from wells G-855 and G-1487 during the 1986 and 1998 water years.

Figure 13. Map showing grouping of wells near the Hialeah-Miami Springs Well Field based on average correlation of water-level data during both the wet and dry seasons.

Figure 14. Graph showing temporal variation in seasonal correlation between water-level data from well G-3466 and that of wells G-3465, S-19, and S-68 during water years 1988-2000.

Figure 15. Hydrographs showing water-level elevations from wells G-3465, G-3466, S-19, and S-68 during the 1990 and 1996 water years.

Figure 16. Hydrograph showing water-level elevations from wells G-3465, G-3466, S-19, and S-68 during water years 1988-99.

Figure 17. Graph showing temporal variation in seasonal correlation between censored and uncensored water-level data from well G-3466 and that of wells G-3465, S-19, and S-68 during water years 1988-2000.

Figure 18. Graph showing temporal variation in seasonal correlation between water level data from well G-1362 and that of well G-757A during water years 1974-2000.

Figure 19. Hydrograph showing water-level elevations from wells G-757A and G-1362 during the 1989 and 1997 water years.

Figure 20. Graph showing temporal variation in seasonal correlation between water-level data from well G-864 and that of well G-864A during water years 1974-2000.

Figure 21. Hydrograph showing water-level elevations from wells G-864 and G-864A during the 1990 and 2000 water years.


FirstGov.gov U.S. Department of the Interior | U.S. Geological Survey
Water Resources Discipline, Florida

email Feedback | USGS privacy statement | Accessibility