Link to USGS home page
Prepared in cooperation with the Miami-Dade Department of Environmental Resources Management
Correlation Analysis of a Ground-Water Level Monitoring Network, Miami-Dade County, Florida

By Scott T. Prinos

The topic is Coastal Erosion. Open-File Report 2004-1412
Abstract
Introduction
Correlation Analysis of a Ground-Water Level Monitoring Network
Analytical Considerations
Analysis Methodology
Analysis Results
West Well Field
Hialeah-Miami Springs Well Field
Remaining Well Groups
Summary
References Cited
Appendixes I & II
image of Duval County, Florida

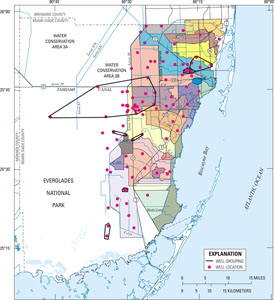
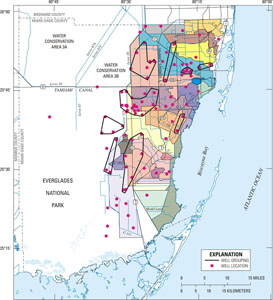
CORRELATION ANALYSIS OF A GROUND-WATER LEVEL MONITORING NETWORK

Analysis Results

Results of a water-level correlation analysis can be used to aid in the evaluation of well redundancy. Table 3 lists each network well and the number of other network wells with data correlated at coefficient values that are 0.99, 0.95, and 0.90 or greater, on average, for the wet and dry seasons.

When arranged geographically (north-south and west-east), the correlation matrices (app. I and II) indicate several geographic areas where water-level data in many wells correlate to a high degree. The degree of correlation in the water-level data of network wells was almost always in excellent agreement with the spatial distribution of the wells. Wells that had highly correlated water-level data usually were near each other and/or influenced by the same hydrologic controls such as municipal well fields, canals, or drainage basins.

Examination of the GIS coverages of wet- and dry-season correlation revealed areas where wells could be spatially separated into groups for which the water levels from each well were correlated to those of one or more additional wells within the same group with an average coefficient of 0.95 or greater. For the wet and dry seasons, these groupings are depicted in figures 7 and 8, respectively. Differences between the wet- and dry-season spatial grouping are most likely indicative of seasonal differences in the hydrologic system.

Map showing grouping of wells based on average correlation of water-level data during the wet season. Figure 7. Map showing grouping of wells based on average correlation of water-level data during the wet season. Link to larger version

Map showing grouping of wells based on average correlation of water-level data during the dry season. Figure 8. Map showing grouping of wells based on average correlation of water-level data during the dry season. Link to larger version

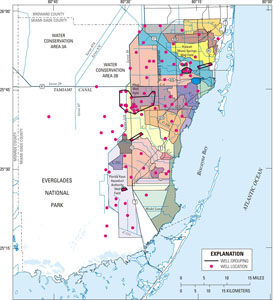
To aid in the assessment of redundancy, it was necessary to identify wells that would be highly correlated to other wells during both the wet and dry seasons. Examination of the GIS coverages of correlation revealed five well groups where the water levels from each well were correlated to those of one or more additional wells within the same group with an average coefficient of 0.95 or greater during both seasons (fig. 9). Three of the five groups are located near the Hialeah-Miami Springs, Florida Keys Aqueduct Authority, and West Well Fields (fig. 9). The remaining two groups are located in or near the C-1 and C-102 basins and the C-6 and C-7 basins, respectively. The information for these well groupings is summarized in table 4.

Map showing grouping of wells based on average correlation of water-level data during both the wet and dry seasons. Figure 9. Map showing grouping of wells based on average correlation of water-level data during both the wet and dry seasons. Link to larger version

Next:


Figures: Click on a caption to view the figure.
Figure 1. Map showing location of continuous ground-water level monitoring network wells in Miami-Dade County, Florida.

Figure 2. Map showing water-supply and water-management systems in Miami-Dade County.

Figure 3. Maps showing lines of equal rainfall in Miami-Dade County during (a) Hurricane Irene on October 14-16, 1999, and an (b) unnamed storm on October 2-3, 2000.

Figure 4. Graphs showing seasonal variation in mean water levels and variation in monthly standard deviation of mean water levels for wells G-620, G-864, G-1183, and S-18.

Figure 5. Hydrograph showing variation in water levels at wells G-3 and G-1368A along with estimated average daily pumpage based on annual pumpage totals during water years 1974-2000.

Figure 6. Hydrograph showing variation in water level at well G-1502 during water years 1974-2000.

Figure 7. Map showing grouping of wells based on average correlation of water-level data during the wet season.

Figure 8. Map showing grouping of wells based on average correlation of water-level data during the dry season.

Figure 9. Map showing grouping of wells based on average correlation of water-level data during both the wet and dry seasons.

Figure 10. Map showing grouping of wells near the West Well Field based on average correlation of water-level data during both wet and dry seasons.

Figure 11. Graph showing temporal variation in seasonal correlation between water-level data from well G-1487 and that of well G-855 during water years 1974-2000.

Figure 12. Hydrographs showing water-level elevations from wells G-855 and G-1487 during the 1986 and 1998 water years.

Figure 13. Map showing grouping of wells near the Hialeah-Miami Springs Well Field based on average correlation of water-level data during both the wet and dry seasons.

Figure 14. Graph showing temporal variation in seasonal correlation between water-level data from well G-3466 and that of wells G-3465, S-19, and S-68 during water years 1988-2000.

Figure 15. Hydrographs showing water-level elevations from wells G-3465, G-3466, S-19, and S-68 during the 1990 and 1996 water years.

Figure 16. Hydrograph showing water-level elevations from wells G-3465, G-3466, S-19, and S-68 during water years 1988-99.

Figure 17. Graph showing temporal variation in seasonal correlation between censored and uncensored water-level data from well G-3466 and that of wells G-3465, S-19, and S-68 during water years 1988-2000.

Figure 18. Graph showing temporal variation in seasonal correlation between water level data from well G-1362 and that of well G-757A during water years 1974-2000.

Figure 19. Hydrograph showing water-level elevations from wells G-757A and G-1362 during the 1989 and 1997 water years.

Figure 20. Graph showing temporal variation in seasonal correlation between water-level data from well G-864 and that of well G-864A during water years 1974-2000.

Figure 21. Hydrograph showing water-level elevations from wells G-864 and G-864A during the 1990 and 2000 water years.


FirstGov.gov U.S. Department of the Interior | U.S. Geological Survey
Water Resources Discipline, Florida

email Feedback | USGS privacy statement | Accessibility