Figure 3 shows the regional geology for sub-area 1. The blue and red arrows shown on the figure point to Tertiary intrusive rocks that are interpreted to be similar rock types based upon the Landsat and gamma-ray data. These arrows appear in each of the images presented as part of this discussion.
Figure 4 shows the image of Landsat bands 3, 2, and 1 as shades of red, green, and blue. This image is an approximation of how a normal color photograph of the area might look. Note that the blue arrows point to intrusive rocks that are lighter in color and may have brown tones compared to the much darker rocks to which the red arrows point. The very dark colors indicate low reflectance from the rocks and suggest the presence of abundant dark minerals. The brown tones suggest the presence of visible iron oxides.
Figure 5 shows the image of Landsat bands 5, 4, and 7 as shades of red, green, and blue. The blue arrows point to rocks that have distinctive blue and cyan colors whereas the red arrows point to rocks that appear very dark brown or black.
Figure 6 shows the color-ratio composite of Landsat band ratios 3/4, 3/1, and 5/7 as shades of red, green, and blue. The blue arrows point to rocks with distinctive blue-green colors and typically have scattered orange pixels around them. The red arrows point to rocks that appear as darker blue colors in the image.
Figure 7 shows the gamma-ray color-composite image with uranium, potassium, and thorium as shades of red, green, and blue. The blue arrows point to rocks that are much more radioactive than the rocks to which the red arrows point.
The description of the intrusive rocks given for the regional geologic map indicates that both mafic and silicic rocks are present. The low gamma-ray signatures and the presence of dark minerals from the Landsat data indicate that the red arrows point to rocks that are most likely mafic. The blue arrows point to rocks that are much more radioactive and also more reflective (indicating a greater abundance of quartz and other light-colored minerals) and such a signature indicates the presence of rocks that are silicic. These data do not distinguish between the rocks and landslide or alluvial materials composed of rock fragments. Nonetheless, the larger landslides are easily differentiated based upon the distinctive appearance of landslides in the Landsat images. Aside from the intrusive rocks many of the other geologic materials have different colors in the Landsat images as well as different radioactivity signatures. These data together with selective field checks should significantly facilitate the mapping of the geology in this area.
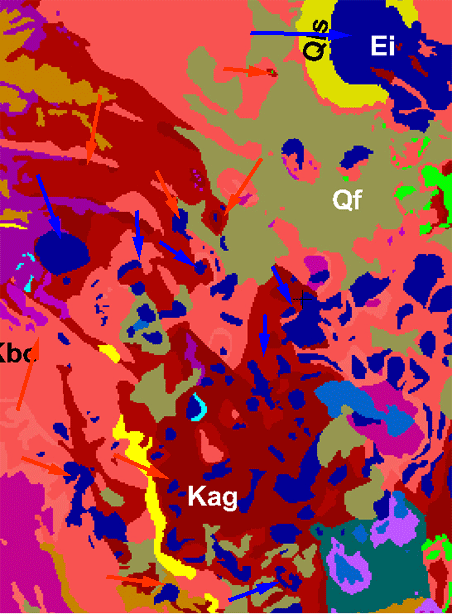
Figure 3. Image of the regional geology for sub-area 1. The blue and red arrows point to Tertiary intrusive rocks and the color of the arrows indicates rocks interpreted to be similar types.
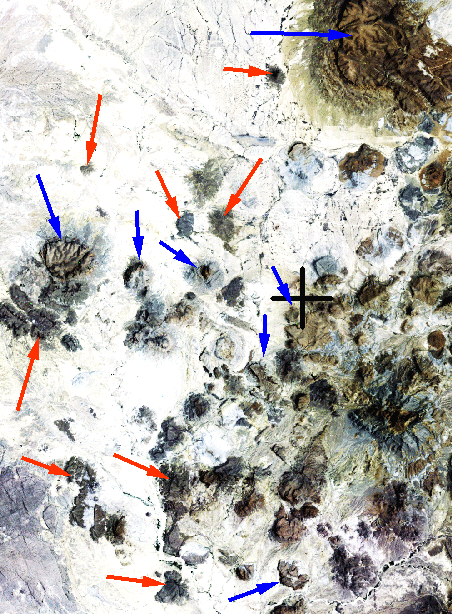
Figure 4. Sub-area 1 image of Landsat bands 3, 2, and 1 as shades of red, green, and blue.
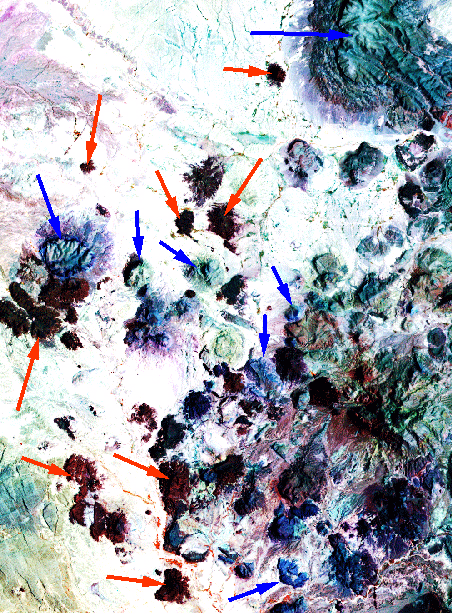
Figure 5. Sub-area 1 image of Landsat bands 5, 4, and 7 as shades of red, green, and blue.
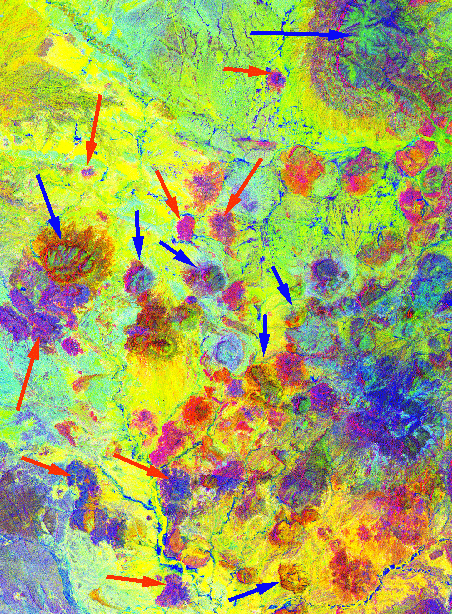
Figure 6. Color-ratio composite of Landsat band ratios 3/4, 3/1, and 5/7 as shades of red, green, and blue.
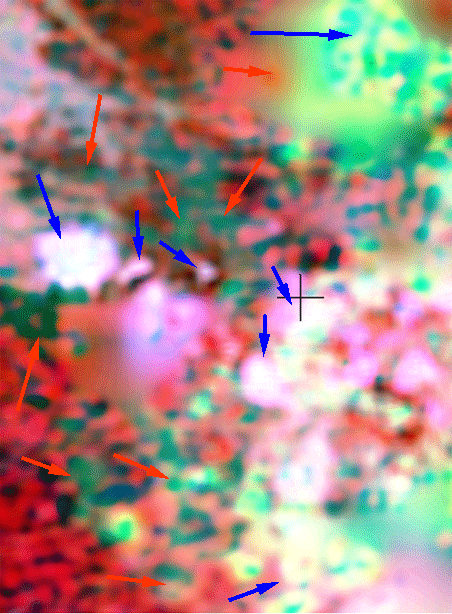
Figure 7. Gamma-ray color-composite image with uranium, potassium, and thorium as shades of red, green, and blue.
Gamma-ray Data | Subarea Index | Subarea 1 | Subarea 2 | Subarea 3
Intro | Geology | Gamma-ray Data | Landsat Data | Maps | Conclusions | Listing of Data Files | References | Tutorial