 |
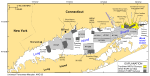
Figure 1. Map showing locations of the combined LIDAR/multibeam bathymetric surveys off New London and Niantic, Connecticut, in northeastern Long Island Sound. Also shown are the sites of other National Oceanic and Atmospheric Administration (NOAA) bathymetric surveys and U.S. Geological Survey/Connecticut Department of Environmental Protection (USGS/CT DEP) sidescan-sonar surveys in Long Island Sound. Bathymetric surveys: H11250--Poppe and others (2006b, 2007a); H11255--Poppe and others (2006c); H11252/H11361--Poppe and others (2007b, 2008); H11043--Poppe and others (2004); H11444--McMullen and others (2005), Poppe and others (2006a); H11045--Beaulieu and others (2005). Sidescan-sonar surveys: Norwalk--Twichell and others (1997); Milford--Twichell and others (1998); New Haven harbor and Central Long Island Sound (CLIS) Dumping Ground--Poppe and others (2001); Roanoke Point--Poppe and others (1999a); Falkner Island--Poppe and others (1999b); Hammonasset--Poppe and others (1997); Niantic Bay--Poppe and others (1998a); New London--Lewis and others (1998), Zajac and others (2000, 2003); Fishers Island Sound--Poppe and others (1998b). |
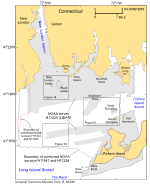 |
Figure 2. Index map showing boundaries of the New London survey areas (H11224 LIDAR, light gray shaded polygons; combined H11441 and H11224 bathymetry, dashed gray line), local physiographic features, and locations of figures 14, 15, and 16. Dashed red line shows the boundary of the combined Niantic surveys. |
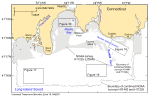 |
Figure 3. Index map showing boundaries of the Niantic survey areas (H11225 LIDAR: light gray shaded polygons; H11442 multibeam: dashed line), local physiographic features, and locations of figures 10, 17, 18, and 19. Green dashed line shows the boundary of the combined New London surveys. |
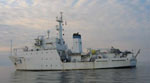 |
Figure 4. Port-side view of the National Oceanic and Atmospheric Administration Ship Thomas Jefferson at sea. Note that the 8.5–m survey launch normally stowed on this side of the ship has been deployed. |
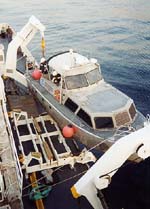 |
Figure 5. Image showing National Oceanic and Atmospheric Administration (NOAA) Launch 1014 being deployed from the NOAA Ship Thomas Jefferson. |
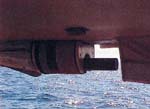 |
Figure 6.
Image showing the RESON Seabat 8101 hull mounted in the keel cut out of National Oceanic and Atmospheric Administration Launch 1005. |
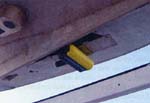 |
Figure 7. Image showing the RESON Seabat 8125 hull mounted in the keel cut out of National Oceanic and Atmospheric Administration Launch 1014. |
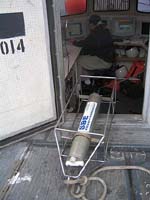 |
Figure 8. CTD (conductivity-temperature-depth) profiler. Data derived from frequent deployments of this device were used to perform sound-velocity corrections on the multibeam data.
|
 |
Figure 9. Image shows a Dash 8–202 series aircraft containing the airborne part of the LADS Mk II system at the Groton-New London airport, Connecticut. |
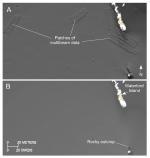 |
Figure 10. Clips from digital terrain models of the sea floor produced from the combined multibeam and LIDAR bathymetric data collected during National Oceanic and Atmospheric Administration surveys H11442 and H11225 off Niantic, Connecticut: (A) Unadjusted bathymetry showing artifacts caused by the multibeam dataset being shallower than the corresponding LIDAR bathymetry, and (B) image showing the same area of the sea floor after the multibeam dataset was adjusted 25 cm deeper. (Location of clips is shown in figure 3.) |
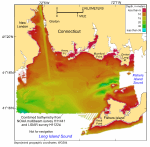 |
Figure 11. Digital terrain model of the sea floor produced from the combined multibeam and LIDAR bathymetric data collected during National Oceanic and Atmospheric Administration surveys H11441 and H11224 off New London, Connecticut. Image is sun-illuminated from the north and vertically exaggerated 4x. |
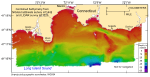 |
Figure 12. Digital terrain model of the sea floor produced from the combined multibeam and LIDAR bathymetric data collected during National Oceanic and Atmospheric Administration surveys H11442 and H11225 off Niantic, Connecticut. Image is sun-illuminated from the north and vertically exaggerated 4x. |
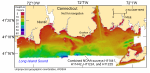 |
Figure 13. Digital terrain model of the sea floor produced from the combined multibeam and LIDAR bathymetric data collected during National Oceanic and Atmospheric Administration surveys H11441, H11442, H11224, and H11225 off New London and Niantic, Connecticut. Image is sun-illuminated from the north and vertically exaggerated 4x. |
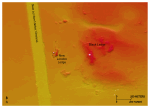 |
Figure 14. Detailed planar view of the combined multibeam and LIDAR bathymetric data from National Oceanic and Atmospheric Administration surveys H11441 and H11224. Image shows part of the New London Harbor Channel and the bedrock outcrops at New London and Black Ledges, Connecticut. (Location of view is shown in figure 2.) |
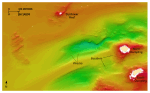 |
Figure 15. Detailed planar view of the combined multibeam and LIDAR bathymetric data from National Oceanic and Atmospheric Administration surveys H11441 and H11224 off New London and Niantic, Connecticut. Image shows the bouldery sea floor at exposures of the Clumps moraine, scour depressions at the western end of Fishers Island Sound, and shipwrecks. (Location of view is shown in figure 2.) |
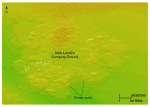 |
Figure 16. Detailed planar view of the combined multibeam and LIDAR bathymetric data from National Oceanic and Atmospheric Administration surveys H11441 and H11224. Image of the New London Dumping Ground showing dredge spoils. (Location of view is shown in figure 2.) |
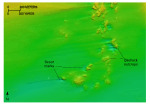 |
Figure 17. Detailed planar view of the combined multibeam and LIDAR bathymetric data from National Oceanic and Atmospheric Administration surveys H11442 and H11225. Image of rocky outcrops south of Black Point and scour features indicating net westward sediment transport. (Location of view is shown in figure 3.) |
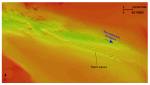 |
Figure 18. Detailed planar view of a sand-wave field at the eastern end of Twotree Island Channel in the combined multibeam and LIDAR bathymetric data from National Oceanic and Atmospheric Administration surveys H11442 and H11225. Sand-wave asymmetry indicates net eastward sediment transport. (Location of view is shown in figure 3.) |
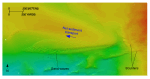 |
Figure 19. Detailed planar view of the combined multibeam and LIDAR bathymetric data from National Oceanic and Atmospheric Administration surveys H11442 and H11225. Image shows the bouldery character of the flanks of Bartlett Reef and a nearby sand-wave field. Sand-wave asymmetry indicates net westward sediment transport. (Location of view is shown in figure 3.) |


