
|
All instruments were recovered successfully, and data were retrieved and
processed using proprietary software from the instrument manufacturers and
MATLAB data analysis software. Data were edited to remove spurious spikes,
signals with biological fouling, and periods when an instrument was out of
the water. Data were then converted to
EPIC-compliant variables and placed into
NetCDF format. NetCDF files allow for sharing of data in a common
format that is machine-independent and contains appropriate metadata.
Documentation of the U.S. Geological Survey's Oceanographic Time-Series
Measurement Database can be found
here.
The data are publicly served at http://stellwagen.er.usgs.gov/wfal.html,
which contains details of all field activities associated with this
project, Google Earth visualizations of deployment locations,
and sampling interval information. The edited, final data files can be
accessed using OpenDAP here.
File naming conventions for time-series observations are described
here. Data in formats that did not conform to the structure of the
Time-Series Measurment Database can be found in the appendix.
|
| Click on figures for larger images |
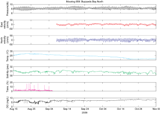 |
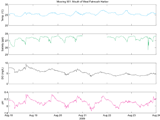
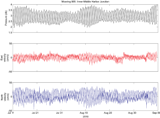
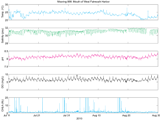
| Figure 12. Time series of pressure, east
velocity, north velocity, water temperature, salinity, transmission,
and dissolved oxygen (DO) from mooring 859, Buzzards Bay North |
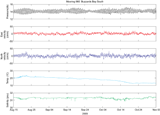 |
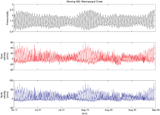
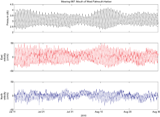
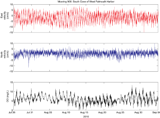
| Figure 13. Time series of pressure, east
velocity, north velocity, water temperature, and salinity from mooring 860,
Buzzards Bay South. |
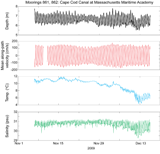 |
| Figure 14. Time series of water level, mean
along-path channel velocity (ebb/southwest positive), water temperature,
and salinity from moorings 861 and 862, Cape Cod Canal at Massachusetts
Maritime Academy. |
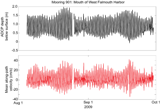 |
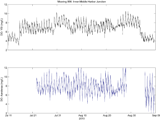
| Figure 15.Time series of ADCP depth below
surface and mean along-path channel velocity (ebb/west positive) from mooring
901, mouth of West Falmouth Harbor. |
 |
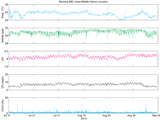
| Figure 16.Time-series of water
temperature, salinity, dissolved oxygen, and pH from mooring 901, mouth of West
Falmouth Harbor. |
 |
| Figure 17.Time series of pressure, east
velocity, and north velocity from mooring 882, Mashapaquit Creek. |
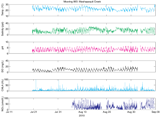 |
| Figure 18. Time series of water temperature,
salinity, pH, dissolved oxygen (DO), chlorophyll-A (CHLA), and nitrate (NO3)
from mooring 883, Mashapaquit Creek. |
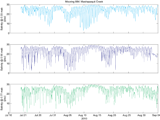 |
| Figure 19. Time series of salinity from three
vertical elevations on mooring 884, Mashapaquit Creek..
|
 |
| Figure 20.Time series of pressure, east
velocity, and north velocity from mooring 885, Inner-Middle Harbor Junction. |
 |
| Figure 21.Time series of water temperature,
salinity, pH, dissolved oxygen (DO), and chlorophyll-A (CHLA) from mooring
886, Inner-Middle Harbor Junction. |
 |
| Figure 22. Comparison of dissolved oxygen (DO)
measurements from YSI 6920 sensor and Aanderaa Optode at mooring 886,
Inner-Middle Harbor Junction. |
 |
| Figure 23.Time series of pressure, east
velocity, and north velocity from mooring 887, mouth of West Falmouth Harbor. |
 |
| Figure 24.Time series of water temperature,
salinity, pH, dissolved oxygen (DO), and chlorophyll-A (CHLA) from mooring
888, mouth of West Falmouth Harbor. |
 |
| Figure 25.Time series of east velocity, north
velocity, and dissolved oxygen from mooring 900, South Cove of West Falmouth
Harbor. |
|


