 |
Figure 1. Photograph of West
Falmouth Harbor, looking east from the harbor entrance near Buzzards Bay. |
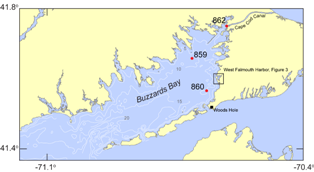 |
Figure 2. Map of portions of
southeastern Massachusetts, Cape Cod, and Buzzards Bay. Moorings in Buzzards
Bay and Cape Cod Canal are indicated with a red circle and mooring number (859,
860, and 862). Bathymetric contours are in meters, referenced to mean low
water. Box indicates inset for figure 3.
|
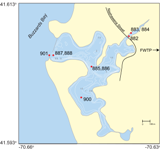 |
Figure 3. Map of West Falmouth
Harbor, Massachusetts. Moorings in West Falmouth Harbor are indicated with a
red circle and mooring number (882, 883, 884, 885, 886, 887, 888, 900, and
901). Bathymetric contours are in meters. FWTP, Falmouth Wastewater Treatment
Plant. |
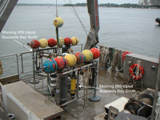 |
Figure 4. Tripods prior to
deployment in Buzzards Bay (moorings 859, 860). |
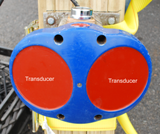 |
Figure 5. Side-looking ADCP
(SL-ADCP) before deployment on the rudder of the T/S Kennedy (mooring
861). Two acoustic transducers allow for estimation of two-dimensional
horizontal velocities; three- and four-transducer ADCPs estimate
two-dimensional horizontal velocities and vertical velocities. |
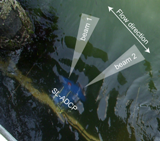 |
Figure 6. Position and schematic of beam spread for the
SL-ADCP deployed on pier, facing entrance channel to West Falmouth Harbor
(mooring 901). Actual beams traveled over 20 meters into the channel before
interference with the channel bed and water surface (due to
beam vertical spreading).
|
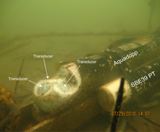 |
Figure 7. Upward-looking
Nortek Aquadopp and Sea-Bird 39 PT sensor deployed on the seabed (moorings
882, 885, 887). White paste on transducers is zinc oxide, used to reduce
biological growth, which interferes with signal transmission.
|
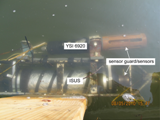 |
Figure 8. Satlantic ISUS nitrate
sensor and YSI 6920 multiparameter sonde deployed on floating dock at
0.12 meters below surface (mooring 883).
|
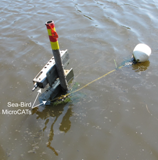 |
Figure 9. Sea-Bird MicroCATs deployed on a
vertical tower array (mooring 884). Three sensors were mounted on this
array at 0.33 meters above bottom (not visible), 0.55 meters above bottom,
and 0.77 meters above bottom.
|
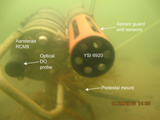 |
Figure 10. Aanderaa RCM9 with optical dissolved oxygen (DO)
probe and YSI 6920 multiparameter sonde, deployed on the seabed using a
pedestal mount (mooring 886) 0.3 meters above bottom. Mooring 888 used a
similar mount, with only a YSI multiparameter sonde.
|
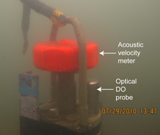 |
Figure 11. Aanderaa RCM9 with acoustic velocity meter (Doppler
Current Sensor; DCS) and optical dissolved oxygen (DO) probe mounted on
seabed (mooring 900).
|
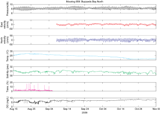 |
Figure 12. Time series of pressure,
east velocity, north velocity, water temperature, salinity, transmission,
and dissolved oxygen (DO) from mooring 859, Buzzards Bay North. |
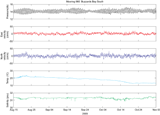 |
Figure 13. Time series of pressure,
east velocity, north velocity, water temperature, and salinity from mooring
860, Buzzards Bay South. |
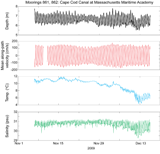 |
Figure 14. Time series of water
level, mean along-path channel velocity (ebb/southwest positive),
water temperature, and salinity from moorings 861 and 862, Cape Cod Canal
at Massachusetts Maritime Academy. |
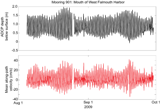 |
Figure 15. Time series of ADCP depth
below surface and mean along-path channel velocity (ebb/west positive) from
mooring 901, mouth of West Falmouth Harbor. |
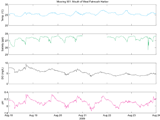 |
Figure 16. Time series of water
temperature, salinity, dissolved oxygen (DO), and pH from mooring 901, mouth of
West Falmouth Harbor. |
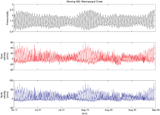 |
Figure 17. Time series of pressure,
east velocity, and north velocity from mooring 882, Mashapaquit Creek. |
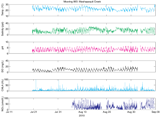 |
Figure 18. Time series of water
temperature, salinity, pH, dissolved oxygen (DO), chlorophyll-a (CHLA), and
nitrate (NO3) from mooring 883, Mashapaquit Creek. |
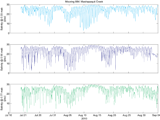 |
Figure 19. Time series of salinity
from three vertical elevations on mooring 884, Mashapaquit Creek. |
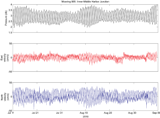 |
Figure 20. Time series of pressure,
east velocity, and north velocity from mooring 885, Inner-Middle Harbor
Junction. |
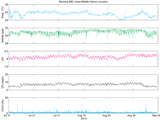 |
Figure 21. Time series of water
temperature, salinity, pH, dissolved oxygen (DO), and chlorophyll-a (CHLA)
from mooring 886, Inner-Middle Harbor Junction. |
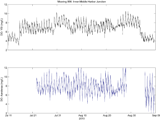 |
Figure 22. Comparison of dissolved
oxygen (DO) measurements from YSI 6920 sensor and Aanderaa Optode at mooring
886, Inner-Middle Harbor Junction. |
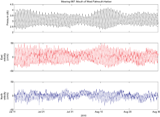 |
Figure 23. Time series of pressure,
east velocity, and north velocity from mooring 887, mouth of West Falmouth
Harbor. |
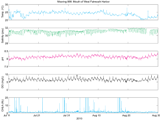 |
Figure 24. Time series of water
temperature, salinity, pH, dissolved oxygen (DO), and chlorophyll-a (CHLA)
from mooring 888, mouth of West Falmouth Harbor. |
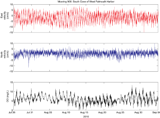 |
Figure 25. Time series of east
velocity, north velocity, and dissolved oxygen from mooring 900, South Cove of
West Falmouth Harbor. |


