 |
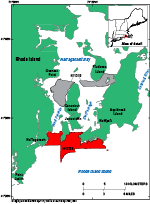
Figure 1. Map showing the location of the National Oceanic and Atmospheric Administration (NOAA) survey H12324 (red-shaded polygons) in southern Narragansett Bay, Rhode Island. Also shown is NOAA survey H11310 (gray-shaded polygons), which has been interpreted as part of this series in Narragansett Bay (McMullen, Poppe, Signell, and others, 2007). |
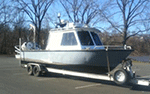 |
Figure 2. Photograph of the National Oceanic and Atmospheric Administration (NOAA) survey vessel S3002, which was used to collect the bathymetric data in the study area. Photograph courtesy of NOAA. |
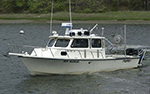 |
Figure 3. Photograph of the U.S. Geological Survey research vessel (RV) Rafael, which was used to collect sediment samples and photographs and video of the sea floor in the study area. |
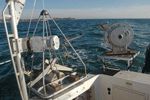 |
Figure 4. Photograph of the small Seabed Observation and Sampling System (SEABOSS), a modified Van Veen grab sampler with attached still and video cameras. The SEABOSS is deployed from the starboard side of the U.S. Geological Survey research vessel Rafael by using a winch mounted on a davit (left), and a take-up reel for the video-signal and power cable (right). |
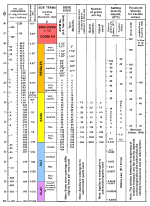 |
Figure 5. Chart showing the relations among phi sizes, millimeter diameters, size classifications (Wentworth, 1922), and American Society for Testing and Materials (ASTM) and Tyler sieve sizes. Chart also shows the corresponding intermediate diameters, grains per milligram, settling velocities, and threshold velocities for traction. Abbreviations in the image include cm/sec, centimeter per second; d, diameter; m, meter; mg, milligram; mm, millimeter; µm, micrometer; no., number; °C, degrees Celsius; and ", inch. Chart produced in the Woods Hole Coastal and Marine Science Center Sediment Lab. |
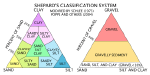 |
Figure 6. Sediment-classification scheme from Shepard (1954), as modified by Schlee (1973) and Poppe and others (2004). Special characters include %, percent; <, less than. |
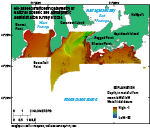 |
Figure 7. Hill-shaded multibeam bathymetry image of National Oceanic and Atmospheric Administration survey H12324. Bathymetry is color-coded for depth, with warm colors (reds) representing shallow areas and cool colors (blues) representing deep areas. |
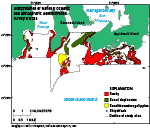 |
Figure 8. Interpretation of the sea floor in the National Oceanic and Atmospheric Administration survey H12324 study area. Features include rocky areas, scour depressions, sand waves and megaripples, and shipwrecks. Areas that are not shaded lack these features and have a smooth sea floor. |
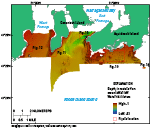 |
Figure 9. Map of the study area showing locations of the figures with detailed bathymetric imagery (red rectangles). Fig., figure. |
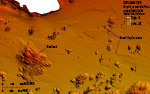 |
Figure 10. Detailed bathymetric image of a rocky area of the sea floor south of Aquidneck Island. Localized bathymetric highs are exposed bedrock. Scour depressions are also visible in this area. Location of image is shown in figure 9. |
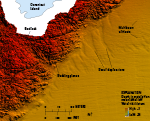 |
Figure 11. Detailed bathymetric image of scour depressions south of Conanicut Island and exposed bedrock near the coast. Scour depressions are aligned perpendicular to the coast. Bedding planes in the bedrock are visible. Artifacts in the multibeam bathymetry are present. Location of image is shown in figure 9. |
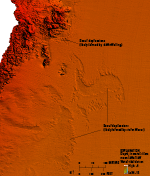 |
Figure 12. Detailed bathymetric image of scour depressions in West Passage. Those located adjacent to the shoreline and submerged bedrock were likely formed by downwelling of return flow from storm waves, while those further from the shore were likely scoured by storm-wave-induced currents. Location of image is shown in figure 9. |
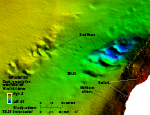 |
Figure 13. Detailed bathymetric image of sand waves located in the deep channel west of Aquidneck Island. Sand-wave profiles are nearly symmetrical indicating that there is no dominant direction of net sediment transport. Bedrock is present along the eastern side of the image. Site of gravelly sediment obtained at station 324-20 is also displayed. Artifacts in the multibeam bathymetry are present. Location of image is shown in figure 9. |
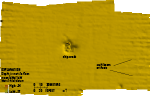 |
Figure 14. Detailed bathymetric image of a shipwreck south of Aquidneck Island. Artifacts in the multibeam bathymetry are present. Location of image is shown in figure 9. |
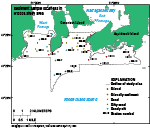 |
Figure 15. Map showing locations of the sediment samples collected in the study area during U.S. Geological Survey (USGS) cruise 2014-046-FA (circles) and historical data (squares) from Poppe and others (2003). Sediment samples are color coded by grain size. |
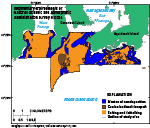 |
Figure 16. Map of the sedimentary environments in the National Oceanic and Atmospheric Administration survey H12324 study area. Environments include those characterized by erosion or nondepositon, coarse-grained bedload transport, and sorting and reworking. Interpretations are based on multibeam-bathymetric, sediment, and photographic data. |
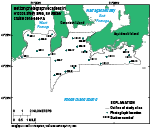 |
Figure 17. Map of the locations of photographs in the study area taken during U.S. Geological Survey cruise 2014-046-FA. RV, research vessel. |
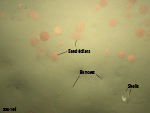 |
Figure 18. Photograph of a sandy sea floor at station 324-10. Image shows sand dollars, burrows, and shells on the sea floor. Location of photograph is shown in figure 17. |
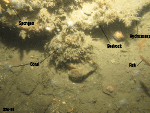 |
Figure 19. Photograph of exposed bedrock on the sea floor at station 324-9. Bedrock and boulders are covered with hydrozoans, coral, and sponges. Location of photograph is shown in figure 17. |

