CORRELATION ANALYSIS OF A GROUND-WATER LEVEL MONITORING NETWORK
Analysis Results
Hialeah-Miami Springs Well Field
The second largest group of wells is near the Hialeah-Miami Springs Well Field, which consists of wells G-3327, G-3465, G-3466, G-3467, S-19, and S-68 (fig. 13). Of these six wells, the water-level data from two wells (G-3327 and G-3467) correlate only to each other with a correlation coefficient greater than 0.95 during the wet and dry seasons (tables 7 and 8, respectively). When reviewing water-level data from a monitoring well, it is useful to have data from at least one other well that correlates to a high degree. A hydrographic comparison of these data sets allows the reviewer to rapidly distinguish between valid and erroneous water-level data and to apply accurate corrections. Therefore, if there are only two wells with similar data, this degree of redundancy is actually beneficial.
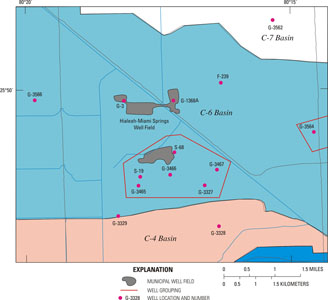 Figure 13. Map showing grouping of wells near the Hialeah-Miami Springs Well Field based on average correlation of water-level data during both the wet and dry seasons. Link to larger version
 |
Water-level data from well G-3466 correlated with an average coefficient of 0.95 or greater during wet and dry seasons with that of wells G-3465, S-19, and S-68 (tables 4, 7, and 8). This was the greatest potential redundancy observed in the area; however, on average, the data from only five wet seasons and six dry seasons were used to determine these average correlation coefficients (table 4). The temporal variation in seasonal correlation of water-level data from well G-3466 and that of wells G-3465, S-19, and S-68 is shown in figure 14. As evidenced, the correlation coefficients derived from the comparison of seasonal water-level data generally were greater than 0.95 during water years 1988-91 and lower during water years 1992 and 1996.
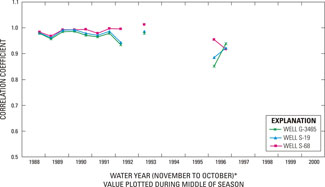 Figure 14. Graph showing temporal variation in seasonal correlation between water-level data from well G-3466 and that of wells G-3465, S-19, and S-68 during water years 1988-2000. Link to larger version
 |
Water-level elevations from wells G-3465, G-3466, S-19, and S-68 during the 1990 and 1996 water years are shown in figure 15. Seasonal correlation coefficients ranged from 0.97 to 0.99 during the 1990 water year and from 0.85 to 0.95 during the 1996 water year (fig. 14). The reduction in the correlation of water-level data between the 1990 and 1996 water years is evident when comparing the plots in figure 15.
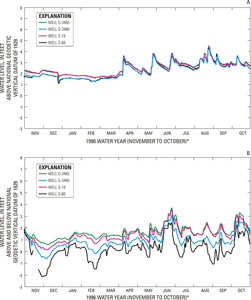 Figure 15. Hydrographs showing water-level elevations from wells G-3465, G-3466, S-19, and S-68 during the 1990 and 1996 water years. Link to larger version
 |
The change in water levels, evident in figure 15, occurred abruptly in 1992 (fig. 16) and was caused by a resumption in pumpage at the Hialeah-Miami Springs Well Field (fig. 5). The rapid changes in water-level elevation in this area, following resumed ground-water withdrawals, can affect the monitoring equipment installed in network wells. Equipment malfunctions in this area often resulted in more than 5-percent missing record during the 1992-2000 water years. Because years with this amount of missing record were censored, only about four seasons of water-level data could be compared during this period. As a result, the majority of the correlation coefficients used in creating the averages were from the water years prior to resumption of well-field withdrawals. Thus, the average correlation coefficients derived from this analysis are much more representative of water-level data prior to 1992 than current conditions.
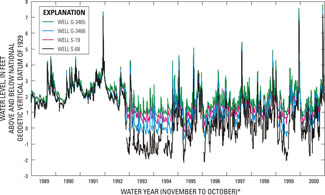 Figure 16. Hydrograph showing water-level elevations from wells G-3465, G-3466, S-19, and S-68 during water years 1988-99. Link to larger version
 |
The variation in the derived correlation coefficient when the water-level data are censored and uncensored for missing record is shown in figure 17. For the comparison between water-level data from well G-3466 and that of wells S-19, S-68, and G-3465, the uncensored correlation analyses indicate that the extent of correlation in recent years may be routinely lower than the 0.95 criterion established for significance. The accuracy of these results, however, is uncertain because of the missing data during this period.
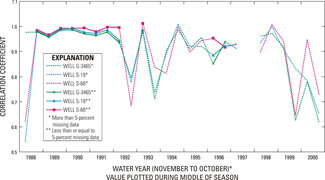 Figure 17. Graph showing temporal variation in seasonal correlation between censored and uncensored water-level data from well G-3466 and that of wells G-3465, S-19, and S-68 during water years 1988-2000. Link to larger version
 |
Other wells in this area had more complete data available for comparison over longer periods. Results indicated, however, that water-level data from these wells generally correlated with that of only one or two other wells.
Next: Remaining Well Groups
|