CORRELATION ANALYSIS OF A GROUND-WATER LEVEL MONITORING NETWORK
Analysis Results
Remaining Well Groups
The remaining three well groups each consist of only two wells where water-level data from one well are correlated to that of the other well with an average coefficient of 0.95 or greater (table 4). These groups include wells G-757A and G-1362 in the C-102 and C-1 basins, respectively; wells G-864 and G-864A near the Florida Keys Aqueduct Authority Well Field; and wells F-45 and G-3564 in or near the C-7 and C-6 basins, respectively (figs. 1 and 2).
The temporal variation in seasonal correlation between the water-level data from well G-1362 and that of well G-757A is shown in figure 18. The correlation coefficients derived from this comparison generally were high for the period analyzed; however, there were several periods (specifically during water years 1976, 1980, 1984, 1987, and 1997) where correlation of the water-level data was unusually low. Water-level elevations from wells G-757A and G-1362 during water years 1989 and 1997 are shown in figure 19. The correlation coefficients derived for comparison of the 1989 water year water-level data were 0.96 and 0.99 respectively, derived during the dry and wet seasons (fig. 18). By comparison, 1997 water year water-level data had correlation coefficients of 0.83 and 0.97, respectively, during the dry and wet seasons (fig. 18).
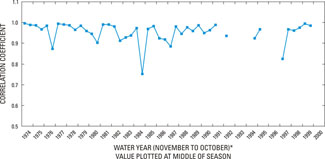 Figure 18. Graph showing temporal variation in seasonal correlation between water level data from well G-1362 and that of well G-757A during water years 1974-2000. Link to larger version
 |
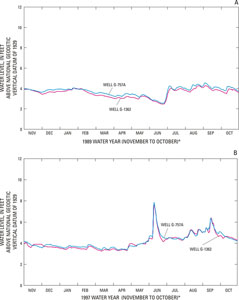 Figure 19. Hydrograph showing water-level elevations from wells G-757A and G-1362 during the 1989 and 1997 water years. Link to larger version
 |
The water-level data from wells G-757A and G-1362 seem to be very similar (fig. 19) for water years 1989 and 1997. Some of the water-level changes in well G-1362, however, were not apparent in well G-757A during the 1997 dry season (particularly in November).
Wells G-864 and G-864A, which are only about 0.4 mi apart and at about the same depth (20 ft), are located about 0.4 and 0.2 mi, respectively, from the Florida Keys Aqueduct Authority Well Field (figs. 1 and 2). The temporal variation of seasonal correlation between water-level data from well G-864 and that of well G-864A is shown in figure 20. The correlation coefficients derived from the seasonal water-level data generally were high for the period analyzed. The lowest correlation coefficients were 0.94 during the dry season of water year 1989 and 0.92 during the wet season of water year 1990. Correlation coefficients were 0.99 during the dry season of water year 2000, and 1.0 during the wet season of water year 2000. Water-level elevations from wells G-864 and G-864A during water years 1990 and 2000 are shown in figure 21. The water-level data seem to be very similar in figure 21; however, peaks are often sharper in well G-864A than in well G-864. Because the water-level data are similar and that relation is maintained throughout the period analyzed, the final determination of redundancy rests on determining the degree of resolution of water-level data required in this particular area.
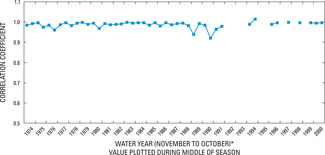 Figure 20. Graph showing temporal variation in seasonal correlation between water-level data from well G-864 and that of well G-864A during water years 1974-2000. Link to larger version
 |
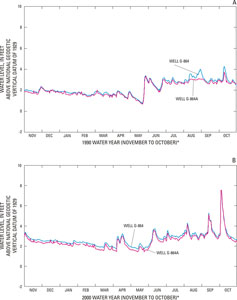 Figure 21. Hydrograph showing water-level elevations from wells G-864 and G-864A during the 1990 and 2000 water years. Link to larger version
 |
After seasons were censored to address missing record, wells F-45 and G-3564 in the C-6 and C-7 basins (fig. 1) could only be compared for four wet seasons and five dry seasons (table 4). As such, it may not be reasonable to conclude that either of these wells is redundant based on the limited amount of data available.
Next: Summary
|