CORRELATION ANALYSIS OF A GROUND-WATER LEVEL MONITORING NETWORK
Analysis Results
West Well Field
The largest area where wells had water-level data that correlated to a high degree is near the West Well Field and includes wells that are located in eastern Everglades National Park near the L-31N canal. In this area, the GIS coverages of wet- and dry-season correlation (figs. 7, 8, and 9) indicated that water-level data from more wells correlated during the wet season (26 wells) than the dry season (22 wells). Twenty-one wells had water-level data that correlated during both seasons (fig. 10). The wet- and dry-season correlation matrices for these 21 wells are presented in tables 5 and 6, respectively.
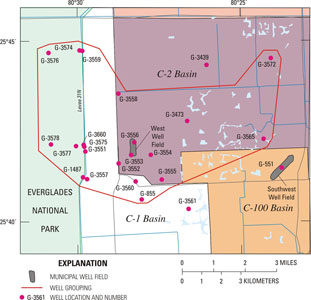 Figure 10. Map showing grouping of wells near the West Well Field based on average correlation of water-level data during both wet and dry seasons. Link to larger version
 |
Generally, there was excellent agreement between the degree of correlation and spatial distribution of the wells, except for two instances for which the correlation coefficients were based on limited data. The water-level data from wells G-3575 and G-3577 (fig. 10) correlated to that of well G-3253 (fig. 1), with a coefficient of 0.95 or greater on average during the dry season (app. II). Well G-3253 is in the center of the Northwest Well Field (fig. 2), whereas wells G-3575 and G-3577 are near the L-31N canal and the West Well Field (fig. 10). The average correlation coefficient for all three wells for the dry season was based on the water-level data for just one season. Data from these wells correlated with coefficients of only 0.76 (well G-3575) and 0.75 (well G-3577) on average during the wet season when evaluated for two and four seasons, respectively (app. I). Considering that the extent of correlation of water-level data from wells G-3253, G-3575, and G-3577 is tenuous, this relation was excluded from the West Well Field group.
The amount of data available for most of the wells in the West Well Field group generally is only a few years. Therefore, in many instances, it is not known how well the water-level data from these wells would have correlated during the major floods and droughts that historically have affected this area.
Of the 21 wells in this group that have highly correlated water-level data, only wells G-855 and G-1487 had water-level data for more than 10 years (table 2). Well G-855 is only about 2 mi southeast of well G-1487 (fig. 10), and both wells are drilled to a depth of 20 ft (table 1). The average correlation coefficients, however, for the comparison of the water-level data from both wells was only 0.82 during the wet season based on data from 13 seasons (table 5) and 0.86 during the dry season based on data from 18 seasons (table 6). Using the selected criteria of an average correlation coefficient of 0.95 or greater for both seasons, water-level data from wells G-855 and G-1487 are not considered to be redundant.
The temporal variation in seasonal correlation between water-level data from well G-855 and that of well G-1487 has not remained constant (fig. 11). The correlation coefficients derived from the seasonal water-level data ranged from about 0.50 to almost 1.00. The correlation coefficient of 0.50 was determined from the water-level data for the wet season of 1988. A drought in 1989-90 (Trimble and others, 1990) may have influenced water levels; however, neither the 1989-90 drought nor another that occurred in 1985 (South Florida Water Management District, 1985) appear to directly correspond to the decrease in correlation of 0.58 to 0.73 that occurred from the 1986 dry season to the 1987 dry season. The standard deviations of the averaged wet- and dry-season correlation coefficients for the comparison of water-level data from wells G-855 and G-1487 were 0.13 and 0.12, respectively (tables 5 and 6). The seasonal correlation coefficients determined from water-level data for the 1989 and 1987 wet seasons and the 1986 and 1987 dry seasons are well above the standard deviation of the averaged seasonal correlation.
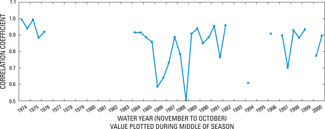 Figure 11. Graph showing temporal variation in seasonal correlation between water-level data from well G-1487 and that of well G-855 during water years 1974-2000. Link to larger version
 |
Water-level elevations from wells G-855 and G-1487 for the 1986 water year are shown in figure 12A, and those for the 1998 water year are shown in figure 12B. The wet- and dry-season correlation coefficients for both wells were 0.64 and 0.59, respectively, for the 1986 water year, and 0.88 and 0.93, respectively, for the 1998 water year (fig. 11). Changes in water levels at both wells are very similar for both water years, but examination of hydrographs for the 1986 and 1998 water years (fig. 12) reveals more instances in 1986 where water-level changes in one well are not reflected in the other.
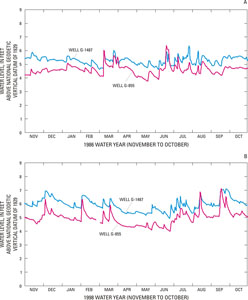 Figure 12. Hydrographs showing water-level elevations from wells G-855 and G-1487 during the 1986 and 1998 water years. Link to larger version
 |
The sparse water-level data available from wells G-3551 and G-3552 correlated with an average coefficient of 0.95 or greater with that of seven other wells during both the wet and dry seasons (table 4). In the vicinity of the West Well Field, water-level data from these two wells could potentially be the most redundant for the period analyzed. Water-level data from well G-3551, located near the L-31N canal (fig. 10), correlated with an average coefficient of 0.95 or greater with that of most wells located within a 3-mi radius. Well G-355 is about 1 mi east-southeast of well G-3551 and about 0.5 mi southwest of the West Well Field (fig. 10). Water-level data from this well correlated with an average coefficient of 0.95 or greater with that of several wells near the L-31N canal and most other wells located within a 4-mi radius (table 4).
With the exception of wells G-3551 and G-3552, well G-3575 is the most potentially redundant well near the West Well Field (fig. 10) and may be unnecessary because of its proximity to well G-3660. Water-level data from well G-3575, which is only about 0.12 mi northwest of well G-3551 and about 0.06 mi southeast of well G-3660 (fig. 10), correlated with a coefficient of 0.95 or greater with that of six other wells during the wet and dry seasons (table 4). Although the average correlation coefficients for the comparisons of water-level data from wells G-3660 and G-3575 were 1.0 and 0.99 during the wet and dry seasons, respectively (tables 5 and 6), these coefficients were determined from water-level data from only one wet season and one dry season. Furthermore, the depth of well G-3575 (9.0 ft) is shallower than that of well G-3660 (57 ft) (table 1).
Considering the amount of variation in seasonal correlation that wells G-855 and G-1487 exhibited through time, the lack of data available for analysis for the other wells in the West Well Field represents a substantial problem in assessing network redundancy. For most of the wells in this area that have only limited water-level record, it can only be noted that if the relations determined for the few years analyzed were to continue, then wells G-3551, G-3552, and G-3575 would potentially be the most redundant wells. If these three wells were removed, the water-level data from each of the remaining wells in this area would, at most, correlate to that of only three other wells with an average correlation coefficient of 0.95 or greater.
On average, the water-level data from each well near the West Well Field and the L-31N canal correlate to that of 3.0 to other wells with an average coefficient of 0.95 or greater during the wet and dry seasons. If wells G-3551, G-3552, and G-3575 were removed, this value (the number of wells with correlated water-level data) would decrease to only 1.5.
Next: Hialeah-Miami Springs Well Field
|