|
Each experiment has its own web page (fig. 33) describing the research and the data collected. These experiment pages are accessed from the map or legend on the main page or from the experiment list page of the server. Each experiment page is the landing page for the dataset Digital Object Identifier (DOI) assigned to the published data. Access to the data is provided by the links at the top right of each experiment page.
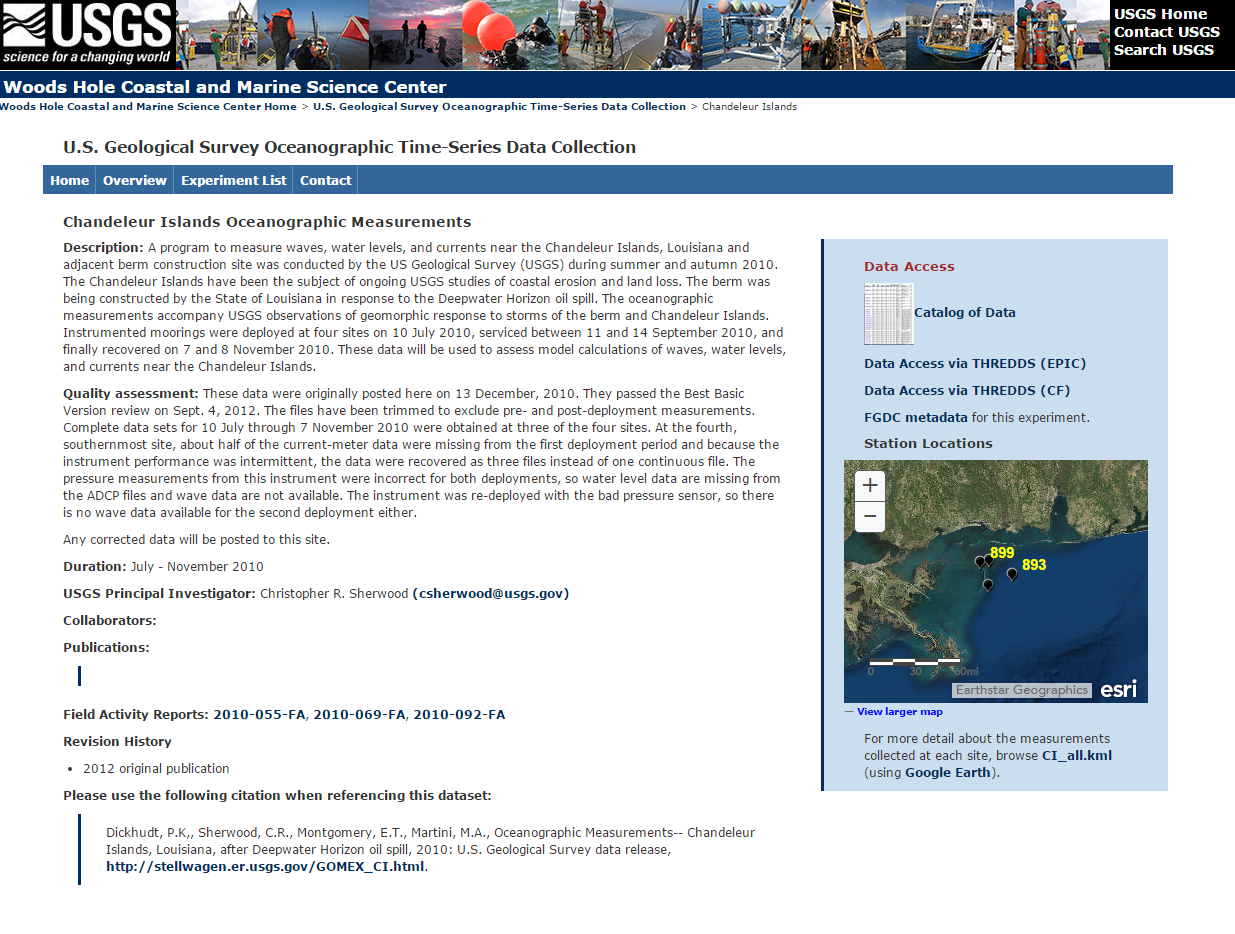 |
Figure 33. Example experiment page, which also functions as the landing page for new experiments that have data Digital Object Identifiers (DOIs). |
The pages follow the same style and include these common elements:
- Description
- Duration
- USGS principal investigators (PIs) and collaborators
- Publications
- Field Activity Reports
- Revision history
- The suggested citation for the data
- Links to access the data.
- A map showing station locations
- A .kml file providing greater detail about where individual sensors were deployed
The first elements document the “who, what, when, where and why” of the experiment. The field activity reports are links to more details of how and what. The platform locations and selected instrument metadata (what, where) may be displayed using Google Earth to view the .kml file provided underneath the map.
The Data Access section is always at the top right an experiment page, and the data files collected are made available in two ways:
- File download from the catalog of data
- Access to data via THematic Real-time Distributed Data Services (THREDDS)
The data catalog link shows a human-readable table of information about each file and provides download capability. Data are always provided at the basic sampling interval (the rate at which the instrument made observations); hourly-averaged and 6-hour low-passed files may also be available. Below the catalog link are one or more “Data access via THREDDS links” that identify which convention of data is served at each. THREDDS provides OPeNDAP (http://www.opendap.org) and several OGC remote data access protocols. THREDDS was developed at Unidata to allow users to access to data from anywhere on the Internet. (Data Access Protocol [DAP] employs lower level services such as hypertext transfer protocol [HTTP], file transfer protocol [FTP], and FTP for grid computing [GridFTP] in its implementation.) OPeNDAP was originally developed by opendap.org and evolved from an earlier protocol named DODS (Distributed Ocean Data System). Various clients are available to access the files, including loaddap for MATLAB, an IDL (Interactive Data Language) client, and the OPenDAP data connector (a Java application) for access.
Station locations are displayed under the “Data Access” section. Below that is a link to a Google Earth .kml file that provides another method of browsing the measurements found in each file.
On any of the experiment pages, by selecting the "Catalog of data" link next to the icon at top right, a table of the filenames and their contents similar to the one in figure 34 is displayed to allow easier selection of the desired data. This catalogue is an important method of identifying whether the desired measurement is in any of the available files. The Oceanographer Canyon Experiment is used in the figure; note that salinity data are available only in file 2492TCT-A.cdf, and that instrument was at 40.5029N, 68.1680W, deployed in 227 m of water. In this table the filenames are blue or purple, indicating actual links in the database where the user may click on a blue filename to download the desired file.
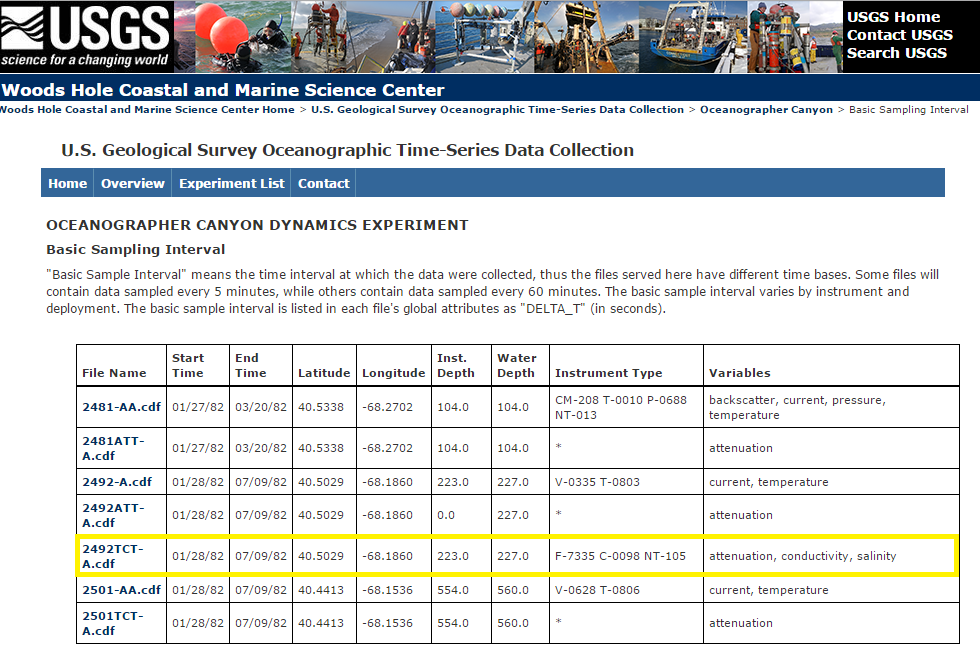 |
Figure 34. Display of the files available and the station information from the Oceanographer Canyon Dynamics Experiment, as organized on the page displayed by Catalog of Data link on the top right of each experiment page. |
In this database, the OPeNDAP access is provided at the "Data Access via THREDDS" link, below the Catalog of Data link on each experiment page. Various clients are available to access the files, including loaddap for MATLAB, an IDL (Interactive Data Language) client, and the OPenDAP data connector (a Java application) for access. This is the real power of OPeNDAP—that the data files accessed through OPeNDAP do not need to be downloaded prior to use. By using a URL to this database in an OPeNDAP-enabled application, the data may be accessed directly from the server. An example of how the global attributes, the variables, and a subset of their attributes are displayed using OPeNDAP is shown in figure 35.
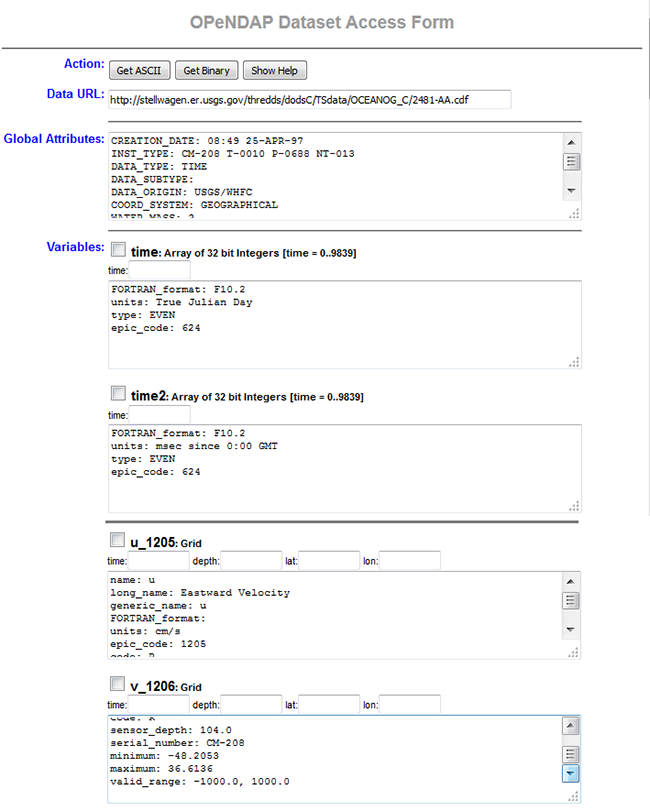 |
Figure 35. OPeNDAP display of file 2481-AA.cdf, from the Oceanographer Canyon Experiment. The global attributes are shown in the top box, then the attributes of the time dimensions in the next two boxes. The horizontal line indicates that variables were skipped. The bottom two boxes show the attributes associated with the eastward and northward velocity variables (u_1205 and v_1206). Note the scrolling was adjusted in the bottom two boxes to allow different attributes to be displayed; there are too many to fit in the layout without scrolling. |
The files comprising the database are also listed in environmental directories or aggregators, such as the NASA Global Change Master Directory (GCMD) or Data.gov. A portal for access to oceanographic and model data outputs is under development. The USGS CMGP Oceanographic Model and Data Portal is designed to enhance discovery and visualization of the data. Listings in the national catalogues of environmental measurements enhances discoverability of the time-series data; thus enabling a potential user to search for "currents" and "Gulf of Maine" and find the appropriate links to this database.
|