|
Several different types of current meters were used to acquire the current velocity measurements in this database. The instruments were selected to provide the most accurate observations given the existing technology and processes to be measured. The quality and precision of a velocity measurement depends on the sensor type, the sampling rate, the location of the measurement (near the bottom or surface), the amount and nature of biofouling, the platform on which the sensor is mounted (mooring, tripod or ship) and the measurement volume.
Mechanical Current Meters
SeaData Bursting Current Measurement System
Between about 1976 and 1993, the USGS tripod system employed a mechanical sensor manufactured by Bendix Inc. to obtain near-bottom current measurements (Butman and Folger, 1979). This current sensor measured speed at two heights above the sea floor with Savonius rotors and direction with a single vane mounted below the upper rotor. The current and other sensors were sampled and recorded using a data logger manufactured by SeaData, Inc. (Hosom and Butman, 1979). The SeaData logger sampled sensors in an interval and burst mode. In the interval mode, upper and lower rotor and pressure were integrated over a basic sampling interval, typically 3.75 or 7.5 minutes. Average rotor speed and pressure were computed during data processing. In the burst mode, beginning in the center of the sampling interval, the system sampled upper rotor speed, vane, and pressure, typically every 2 or 4 seconds for about 1 minute (the burst sample rate was adjustable from 2 to 16 seconds and burst length from 6 to 90 samples, in increments of 6 samples). For a typical 4-month winter deployment at 80 m water depth, the basic sampling interval was 7.5 minutes, the burst rate was 4 seconds, and the burst duration was 48 seconds. In summer, the basic sampling interval was 3.75 minutes. The burst current measurements were vector-averaged and the mean and standard deviation of the burst pressure measurements were computed during data processing. The vector-averaged current is a measure of flow with fluctuations averaged out and the standard deviation of the burst pressure and the ratio of vector current speed to scalar current speed are measures of the fluctuations. The SeaData logger also obtained single samples of temperature and turbidity in the middle of the basic sampling interval.
The estimated accuracy of current speed was 2.5 centimeters per second (cm/s) and current direction was 5 degrees. Temperature was accurate to 0.1° C and resolution was 0.02° C. The estimated accuracy of pressure was ± 3 millibars and the resolution was about 0.04 millibars and 1.0 millibars for the interval and individual burst pressure measurements, respectively.
Vector-Averaging Current Meter (VACM)
Vector-averaging current meters were used to measure temperature and horizontal current velocity at a single location in the water column. Current magnitude was measured using a Savonius rotor, direction using a vane and temperature with a precision thermistor (fig. 8A). Vector averaging refers to the instrument's sampling scheme, which averages speed and direction measurements as they are made (McCullough, 1975). For every eighth revolution of the rotor, the instrument samples the compass and vane and converts the polar coordinate measurements to Cartesian coordinates representing east and north components. These east and north components are added to the previous east and north component sums to give a new north and a new east sum. This addition process yields total east and north components for a particular interval in time. The rate of the summing process (number of sums / unit time) is proportional to the rate of rotation of the Savonius rotor. Eight calculations are made for each revolution of the rotor. These data represent an average over the time interval, typically 3.75 to 15 minutes over durations of several months to several years—thus the term "averaging" in the name of the instrument.
The VACM's Savonius rotor is empirically calibrated for a measurement range of 2.5 to 30 cm/s. The calibration gives an approximate rotor constant of 34.6 cm of water per revolution. The rotor stalls at about 2.5 cm/s; however, vector-averaged speeds below this floor are possible. Intercomparison studies indicate that the accuracy of VACM currents is approximately 3 cm/s (see Lentz and others, 1995). Temperature is accurate to 0.01 ºC measured using calibrated thermistors. Heading and vane direction are accurate to 2.8º. The sums are recorded on magnetic tape at a preselected interval (the recording interval).
Some VACMs were modified to also record turbidity using a Seatech transmissometer and conductivity using a Sea-Bird SBE4 conductivity cell (fig. 8B; Strahle and Butman, 1984). Salinity was computed from the temperature and conductivity readings. See descriptions of these sensors for details.
VACMs record data on 1/4 inch cassette tapes using SeaData recorders. After the VACMs were recovered, these data were read from the cassette into a file on a personal computer, and then translated into Woods Hole Oceanographic Institution (WHOI) CAssette Reader Program (CARP) format, using programs from SeaData and PCARPHP (Danforth, 1990). Decoding and calibration of data were performed using the Buoy Group Data Processing System. Until September 1999, data were edited, truncated, averaged, and filtered using the Buoy System, but since then VACM data have been written to netCDF files, and these procedures have been conducted in the USGS-WHOI system. Since February 2001, data were also decoded and calibrated using the USGS-WHOI system. VACMs were retired from service at the USGS because the magnetic recording tapes and other spare parts were no longer manufactured, and because of the extensive time required to prepare, deploy and debrief the instruments.
Vector-Measuring Current Meters (VMCM)
Vector-measuring current meters (Weller and Davis, 1980) were developed to obtain measurements in the presence of oscillating horizontal and vertical currents associated with surface waves and mooring motion. The VMCM has two orthogonally mounted propellers to directly measure current velocity in two horizontal directions at the depth deployed (fig. 9). The counting method for propeller rotation is direction-sensitive; this characteristic enables the instrument to remove fluctuating signals from the velocity measurements. Vector sums are accumulated until the end of a sampling interval, and then are rotated to east and north, according to heading output from the compass, and recorded. The instrument can resolve 9.36 centimeters (cm) flow per count (2.67 revolutions per meter of flow) with ± 1 percent each for linearity and cosine response. Current meter intercomparison studies (see Beardsley, 1987; Halpern, 1987) indicate that the accuracy of VMCM current measurements is approximately the same as for VACMs, about 3 cm/s. The stall threshold for the VMCM is 0.9 cm/s. Heading is accurate to less than 5 degrees. Temperature is measured by the same calibrated thermistor used in the VACM. Until about 2004, VMCMs recorded data on 1/4 inch cassette tapes using SeaData recorders. After 2004, the VMCMs were upgraded to solid-state control circuitry and modern datalogging systems replaced the magnetic tape system. A new compass was included in these upgrades. The sensors for current velocity and temperature remain the same.
These instruments are typically deployed in-line as part of a subsurface mooring. The bottom cage contains a Savonious rotor that turns at a rate proportional to the current speed and a vane that aligns with the current (see text for a description of the sampling scheme). The blue paint on the cases and white paint on the rotor and vane is antifouling paint used on instruments deployed near the surface where biological growth might foul the sensors. The steel bands around the center of the case were used to support additional instruments, such as a transmissometer or conductivity sensor.
VMCMs were used in USGS field experiments to measure temperature and velocity at a sampling interval of 3.75 minutes. VMCMs were deployed beneath surface-following buoys to obtain near-surface current measurements where large oscillatory currents caused by waves were present, as well as on subsurface moorings.
A conductivity sensor is mounted on the pressure case between the transmissometer and the rotors. These enhanced VACMs were deployed on subsurface moorings to obtain current, temperature, conductivity, and light-transmission measurements in the water column.
Acoustic Current Meters
Acoustic current meters measure the time of travel of sound between two points, or the Doppler phase shift of sound reflected from particles in the water to measure current. Subcategories of the Doppler instruments are pulse-coherent, non-pulse-coherent, profiler, and single point instruments. The advantages and disadvantages of each type depend on the amount of averaging required to achieve a certain level of accuracy under certain flow conditions; sample resolution in time and space; power consumption; and the size; location and geometry of the measurement volume.
Time-of-Travel Acoustic Current Meters
Benthic Acoustic Stress Sensor (BASS)
The benthic acoustic stress sensor (BASS) is a four-axis acoustic time of travel current-velocity sensor that measures velocity components along four axes in a single sampling volume (fig. 10). Postprocessing calculations resolve these components into measurements of current velocity in the east, north, and vertical directions. In USGS deployments, the BASS typically has been attached to a USGS MIDAS datalogger that controlled sampling and stored output (Martini and Strahle, 1993; Martini and Williams, 1994). BASS current sensors are capable of resolving currents to 0.03 cm/s; however, accuracy is affected by the capacitance of the long cables that connect the datalogger to the sensors. The capacitance correction requires a field determination of the zero current-flow reading and a calibration must be obtained each time the datalogger and sensor wiring are attached to a tripod frame. An accuracy of 0.03 cm/s can be achieved when the "zero" offsets generated by these capacitance changes are measured and removed from the data. A set of experiments was performed to determine the most efficient method of calibrating the BASS to 0.3 cm/s accuracy (Morrison and others, 1993). For USGS measurements, a zero calibration for the BASS current sensors was obtained with the sensors mounted on the tripod system and connected to the MIDAS datalogger prior to deployment and after recovery. A water-tight jacket was fitted around the two BASS sensors, and filled with water, and the data were recorded for at least 12 hours to determine a mean offset under no-flow conditions. Because BASS uses acoustic time-of-travel techniques, the accuracy of 0.3 cm/s is a "per ping" accuracy. No averaging of samples is required to achieve this accuracy. For a comparison of BASS and VMCM velocity measurements, see Lentz and others (1995).
Modular Acoustic Velocity Sensor (MAVS)
The modular acoustic velocity sensor (MAVS) is a four-axis acoustic time-of-travel velocity sensor (fig. 11) made by Nobska Instruments (http://www.nobska.net). It works on the same principal as the BASS, and can be considered the second generation of the BASS. In USGS deployments, the MAVS typically has been attached to a USGS MIDAS datalogger that controlled sampling and storage. MAVS current sensors are capable of resolving 0.03-cm/s currents. MAVS does not have the same cable capacitance concerns as the BASS because the sensing head is directly connected to the electronics. Field-calibration procedures similar to those used for the BASS were typically performed to check the baseline offset of the sensor. The MAVS current-sensor voltages were measured when there was no flow through the measurement volume, and this "zero" offset was subtracted from measurements made during the deployment. The experiments that were performed to determine the most efficient method of calibrating the BASS to 0.3-cm/s accuracy (Morrison and others, 1993) also apply to MAVS. For USGS measurements, a zero calibration for the MAVS current sensors was obtained by placing the sensors in a bucket while the instrument was mounted on the tripod system and connected to the MIDAS datalogger, prior to deployment and after recovery. An accuracy of 0.3 cm/s was typical postcalibration. Since MAVS, like BASS, uses acoustic time-of-travel techniques, the accuracy of 0.3 cm/s applies to each acoustic ping. No averaging of samples is required to achieve this accuracy.
Acoustic Doppler Current Profilers (ADCPs) and Velocimeters (ADVs)
An ADCP obtains a profile of velocity in an ensonified region tens of meters deep by measuring the Doppler shift when acoustic beams reflect from particles in the water column. Scatterers in the water column, such as small particles and plankton traveling with the water flow, reflect the acoustic pulses. The ADCP transducer assembly receives the reflected pulses. Because Doppler shift is proportional to the component of water flow along the beam, the beam geometry is used to convert the returned signal into eastward, northward, and vertical components of water flow. The same acoustic return may also be used to compute sea-surface height and wave velocity and direction. Unlike acoustic time-of-travel techniques, Doppler methods produce an estimate of current velocity with each acoustic ping, and the error for any single ping may be large. Thus, ADCPs must average numerous pings to achieve the same accuracy that a time of travel instrument can achieve in a single ping. ADCPs are produced by several vendors and may use three, four, or five beam configurations. The advantage of ADCPs is that they do not intrude into the sampling volume and a single instrument can measure profiles of current velocity in water from 1 to 500 m deep. Because the sampling volume expands as a cone shape away from the transducer head, the more distant measurements are inherently made over a larger volume of water and may capture more variability than those made closer to the transducer head. In addition, the currents are assumed constant over this sampling volume, which is not always the case in coastal regions; this assumption can lead to erroneous current measurements (Scotti and others, 2005). Acoustic Doppler techniques for current measurement were compared to the VACM and VMCM (see Irish 1995; Gilboy, 2000) before their accuracy was accepted.
Typically, the ADCP transducer head would be mounted at the top of a USGS tripod, approximately 3 meters above bottom, oriented toward the surface (upward looking). The instruments are usually configured to obtain profiles of currents in bins to cover the entire water column (up to 100 m for a 300 kHz ADCP), averaging 40 to 60 pings at a 1-second interval per measurement (ensemble) to calculate a current velocity estimate every 3 to 15 minutes with an accuracy of less than 1 cm/s. An acoustic Doppler velocimeter (ADV) works on the same principle as the profiler except that it makes a measurement at only one point with much higher accuracy and resolution in time. ADVs are used to resolve turbulence and other small-scale flow properties.
ADCPs and ADVs can be grouped into pulse-coherent or non-pulse-coherent and monostatic or bistatic configurations. Pulse-coherent measurements use pairs of acoustic pulses from which the Doppler shift is determined; non-pulse-coherent methods use only one pulse. Pulse-coherent instruments can measure small volumes close to boundaries with fine precision, but cannot profile over distances more than a few meters. Monostatic instruments use the same transducers to transmit the ping and listen for the return; bistatic instruments have separate ceramics for the transmit and receive pulses. The transducers and loggers are integral systems, so ADCP, ADV, and PCADP current data are stored in files specific to the instrument.
Teledyne RD Instruments Acoustic Doppler Current Profiler (TRDI-ADCP) and Sentinel V
Most of the ADCP data in the USGS time-series archive were obtained using Teledyne-RD Instruments (TRDI) hardware with a four-beam orthogonal (Janus) configuration (fig. 12). When installed with waves acquisition firmware, TRDI-ADCPs also record three different types of time series from which wave properties may be computed: pressure, range to surface along each orthogonal beam (that is, water level), and orbital velocities of the surface waves taken from three bins nearest the surface in each of the four beams. It is possible to estimate nondirectional wave energy spectra, and thus wave height and period, from any of the three time series, but the orbital-velocity time series are required for definition of the directional distribution of the wave energy. References for the principles of operation for the Doppler water-flow measurement technique can be found at: http://www.rdinstruments.com. TRDI-ADCPs may be used in a pulse-coherent or non-pulse-coherent mode, depending on the desired measurement accuracy and the size and location of the measurement volume. These are monostatic instruments.
ADCPs were first tested in 1994 and were used routinely beginning in 1997. Because of their ability to measure currents throughout the water column, they have typically replaced the point current meters VACMs and VMCMs. The Sentinel V is a newer version of the Workhorse ADCP. The main enhancements include a 5th beam to better resolve the surface, lower power consumption and more versatile configuration options. They are also capable of collecting wave measurements similarly to the older models. One V was deployed as a test in 2014, and they will replace some of our aging ADCP inventory.
ACDPs are typically set to sample for 5 minutes at 1 Hz several times each hour in 2-m bins. This scheme provides an accuracy of at least 0.4 cm/s for each 5-minute average. The accuracy varies slightly for other configurations. The ping rate, averaging interval, and bin size may be adjusted for each field experiment depending on the processes of interest and experiment duration. Since about 2000, the ADCPs have been configured to obtain both current and wave measurements simultaneously. For wave sampling, the instrument typically recorded a 20-minute time series of pressure and wave orbital velocities every hour. The manufacturer’s software is used to compute wave statistics, then the output is converted to netCDF.
Nortek Aquadopp (AQD) Acoustic Profiler and Nortek Aquadopp High Resolution (HR) Profiler
The Nortek Aquadopp (AQD) profilers measure water flow and wave characteristics. They are usually mounted with transducers oriented upward to sample currents in 50–100-cm bins and waves in water shallower than 20 meters. Like a TRDI-ADCP, the Aquadopp measures water flow using Doppler principles (fig. 13). For wave measurements, the Aquadopp measures wave pressure and near-bed velocities. The PUV (Pressure and the U,V, components of velocity) method is used to estimate wave parameters. The pressure signal is used to estimate wave height; the measurements of the waves' orbital velocities provide an estimate of the wave direction. Unlike an ADCP, the Aquadopp has three acoustic beams that can be arranged in any of five configurations. Each configuration is optimized for certain applications. The HR version is intended for use in boundary layer studies and can sample as fast as 8 Hz. It is usually oriented downward looking, configured with small (3-cm) bins over a 1 to 2-m distance. For additional information on the Nortek Aquadopp acoustic profiler, refer to the manufacturer's Web site, http://www.nortek-as.com/. The Aquadopp is a monostatic instrument.
Typical USGS sampling schemes are identical to those used for TRDI-ADCPs; current velocities are computed over 5-minute averages every 15 minutes in 0.5- to 2-m bins. An accuracy of at least 0.4 cm/s was obtained for each 5-minute measurement by averaging 300 pings emitted at a rate of 1 ping per second. For wave measurements, the instrument recorded a 20-minute time series of pressure and wave orbital velocities every hour.
Nortek Acoustic Wave and Current Profiler (AWAC)
“The Nortek acoustic wave and current profiler (AWAC) measures waterflow by using Doppler principles. The AWAC, like other acoustic water-flow instruments, determines the Doppler shift that occurs when acoustic beams reflect from scatterers that are carried by the water. The AWAC has a central beam and uses acoustic surface tracking (AST) to directly measure the distance to the sea surface. The AWAC uses a hybrid solution representing both AST and PUV.” (Armstrong 2015).
Nortek Vector
The Vector is a form of acoustic Doppler velocimeter, using the same principals of operation as the SonTek ADV (see below). Because of their small size and flexible orientation, Vectors with remote cabled heads were used on the NIMBBLE to measure adjacent near-sea-floor currents, allowing computation of bottom stress. These sensors may also be used for estimating turbulence. For more detail, see http://www.nortek-as.com/en/products/velocimeters/vector.
SonTek Argonaut-XR Acoustic Doppler Profiler (ADP)
The ADP measures water flow using Doppler principles. Like a TRDI-ADCP and an Aquadopp, the Argonaut-XR measures the Doppler shift that occurs when acoustic beams reflect from scatterers that are carried by the water. Like the Nortek Aquadopp, the SonTek Argonaut-XR has three acoustic beams. When installed with the SonWave wave spectra collection package, the SonTek Argonaut-XR can measure wave pressure and near-bed velocities in order to estimate wave characteristics (PUV method). The SonTek Argonaut-XR Principles of Operation are available at http://www.sontek.com/productsdetail.php?Argonaut-XR-10. The ADP is a monostatic instrument.
Typical USGS sampling schemes recorded 5-minute averages of water flow every 15 minutes. An accuracy of at least 0.4 cm/s was obtained for each 5-minute measurement by averaging 300 pings emitted at a rate of 1 ping per second. Data were recorded in bins that were 1-m in height, except that the data in the last bin were an average of data for all depths.
SonTek Pulse-Coherent Acoustic Doppler Profiler (PCADP)
The SonTek PCADP is a pulse-coherent Doppler profiler (fig. 14). Compared to the non-pulse-coherent instruments above, the PCADPs achieve higher spatial resolution. They can measure water-flow measurement regions as short as 1.6 cm along the beam, as opposed to more typical 50 cm for non-pulse-coherent instruments. This capability is particularly useful to the USGS for measuring flows within a few meters of the sea bed. The PCADP is a monostatic instrument, but it is no longer made or supported. The USGS may use existing PCADP sensors, but are evaluating suitable replacements. The PCADP is a monostatic instrument.
The typical USGS sampling scheme is 20-minute averages of water flow every hour. The typical vertical bin size was 9.5 centimeters.
SonTek Acoustic Doppler Velocimeters (ADV)
An ADV measures current speed and direction at a single point in a sampling volume of approximately 2 cubic centimeters using the Doppler principle and the difference between signal returns at the three receivers (bistatic). The instrument can sample both currents and pressure at high frequencies in multiple sampling schemes and rates, and store the complete raw dataset, allowing for the calculation of wave and turbulence parameters. The ADVs used by the CMGP are typically mounted on tripods, facing downward (fig. 15). They are unique in their ability to sample three components of flow with accuracies of less than 0.3 cm/s at rates of up to 25 Hz. USGS ADVs typically are set to sample for 12 minutes at 10 Hz every hour or for 3 minutes at 1 Hz every 30 minutes. The ocean probe ADV is no longer made or supported. The USGS may use existing ADV sensors and is evaluating suitable replacements.
SonTek IQ Flow Monitor
The IQ is a low-profile acoustic current meter, with five beams and a pressure transducer. It is deployed so that two beams are oriented along channel, two across channel, and the vertical beam pointing up as shown at the right in figure 16. The pressure data combined with data from the vertical beam provide accurate water level measurement. The velocity resolution is 0.0001 meter per second (m/s) in a ±5 m/s range. The bin size is dynamically assigned, and propriety software computes flow statistics and water level. Details on the SonTek IQ can be found at: http://www.sontek.com/productsdetail.php?SonTek-IQ-Series-15
|
Click on figures for larger images.
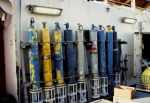
Figure 8A. Vector Averaging Current Meters (VACMs) stored in a rack on deck en route to an experiment near California. |
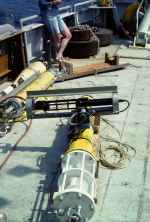
Figure 8B. A Vector Averaging Current Meter (VACM) with Sea Tech transmissometer mounted horizontally in a protective bracket. |
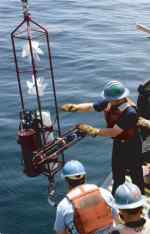
Figure 9. A Vector Measuring Current meter (VMCM) being deployed as part of a subsurface mooring. |

Figure 10. A Benthic Acoustic Stress Sensor (BASS) employs four pairs of acoustic sensors mounted on two rings spaced 20 centimeters apart vertically to measure currents. |
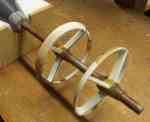
Figure 11. The sensor rings of a Modular Acoustic Velocity Sensor (MAVS). |
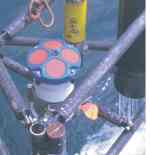
Figure 12. An upward-looking Acoustic Doppler Current Profiler (ADCP) mounted on a corner of a small tripod frame. |

Figure 13. An Aquadopp acoustic profiler mounted on a grate prior to deployment. |
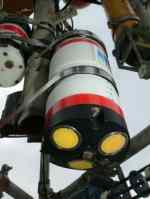
Figure 14. A SonTek pulse-coherent acoustic Doppler profiler (PCADP). |
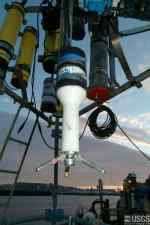
Figure 15. A 5-megahertz Ocean Acoustic Doppler Velocimeter (ADV) mounted on a tripod. |

Figure 16. SonTek IQ (right) and YSI 6600 sonde as deployed on a grate platform in the Rachel Carson National Wildlife refuge in 2013. |
|