|
|
The database contains sets of measurements collected during experiments conducted at different times and locations since 1975. As additional experiments are completed and the data are processed, reviewed, and approved as the "best basic version" (BBV), those files will be added to the database. This database contains no real-time measurements, rather, it contains archived data from past field experiments.
Most field experiments lasted a few months to a few years, and individual instrument deployments were typically 1 to 6 months in duration. Many experiments consisted of arrays of instruments deployed simultaneously at several locations. No continuous measurements at any one site span the period from 1975 to present; however, measurements at several locations were made over a period of years. For example, measurements on the southern flank of Georges Bank were collected from 1975 to 1980, and near continuous data from the sea surface to a depth of 32 meters (m) (the sea floor) are available from the long-term study in Massachusetts Bay from 1990 to 2006.
The temporal resolution of the data varies and depends on the instrument capabilities and the objectives of the experiment. The instrument sampling rates must be sufficiently rapid to adequately describe the processes of interest. Fluctuations caused by surface waves, with periods of 2 to 10 seconds, require rapid sampling and present a challenge for long-term measurements. To sample waves over several months, some instruments utilize a "burst" sampling scheme, in which data are collected very rapidly (a burst of observations) for some period, and the burst is repeated at a longer interval (for instance, sampling at 10 hertz [Hz] for 5 minutes every 30 minutes). The instruments may save the raw data, or sometimes an average value and a variance to optimize data storage.
Prior to 2000, small data-storage capacity constrained the sampling schemes and experiment duration. Power to run the instruments is supplied by batteries. Power constraints may further limit sampling rates for long deployments. In general, the instruments were configured to sample as rapidly as possible given the experiment duration and instrument storage capacity. Recent increases in memory have made storing large amounts of data during a deployment possible. The data collected between 1975 and 2000 were sampled at rates of a few minutes (typically 3.75 - 15 minutes), whereas more recently acquired data may have been collected at 10 Hz.
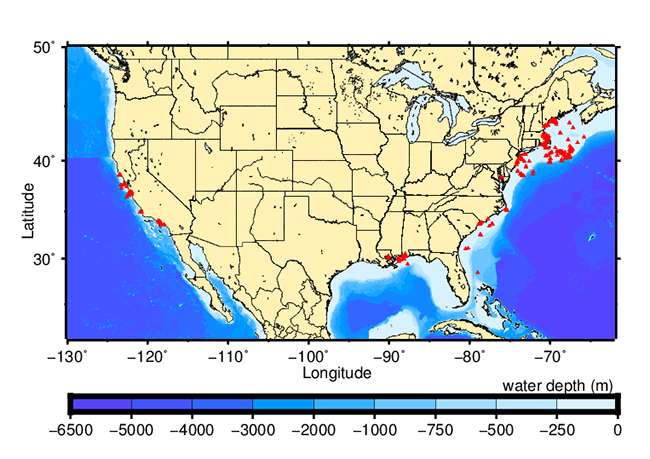
Most of the measurements in this database were collected on the continental shelf of the United States. Because of scientific interest in sediment transport, the measurements are typically concentrated within a few meters of the sea floor, but accompanying measurements were commonly made throughout the water column. The water depth of the experiments ranges from less than a meter to more than a thousand meters. The red triangles in figure 3 indicate where measurements near the continental United States in this database were obtained.

Figure 3. Map of North America showing the locations at which data in the oceanographic time-series database were collected. Data were collected as part of regional or long-term field studies. Most data were collected along the Northeast Coast of the United States and offshore of California [m, meters]. |
|