U.S. Geological Survey Open-File Report 2009-1150
Surficial Geology of the Floor of Lake Mead (Arizona and Nevada) as Defined by Sidescan-Sonar Imagery, Lake-Floor Topography, and Post-Impoundment Sediment Thickness
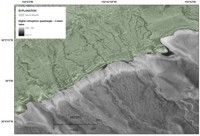
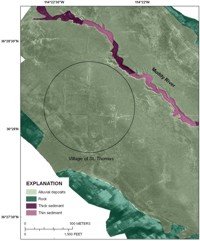
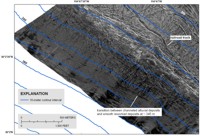
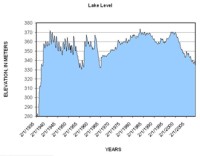
The sidescan-sonar imagery provides a detailed view of the lake-floor geology and allows for extending the geology of the surrounding landscape under the lake. Adjacent to steep rock cliffs the sidescan-sonar imagery shows high backscatter surfaces that indicate a strong acoustic return from these rock faces (fig. 2, 4). Adjacent to alluvial deposits that surround large parts of the lake, the sidescan imagery shows the same intricate network of channels (fig. 11) that is seen on the subaerially exposed parts of these deposits. The preservation of these pre-impoundment surfaces suggests that virtually no sediment has accumulated on these areas. If there were sediment covering these areas, it must be less than 0.5 m thick, otherwise it would be apparent on the seismic profiles that cross these areas (fig. 7). The geophysical and bathymetric data indicate that the post-impoundment sediments are found only along the floors of the deepest parts of the lake, namely, above the river valleys that drained the area prior to impoundment (figs. 3, 7, 9). The distribution of post-impoundment sediments in the lake indicates transport processes that are restricted to the axes of the submerged valley floors (figs. 2, 7, 8, 9). Early studies showed that turbidity currents were the primary sediment dispersal process in the lake and that they could travel its entire length (Gould, 1951; Smith and others, 1960). The post-impoundment sediment distribution revealed by the sidescan is consistent with deposition from turbidity currents (fig. 2). The preservation of the morphology of the surface of the alluvial deposits is of additional interest because it implies little reworking of the lake floor during the flooding of the lake and since the lake became full. These alluvial deposits consist of unconsolidated silt, sand, and gravel (Wilson and others, 1969; Ludington and others, 2005) that would be remobilized if strong currents or large waves were present in the lake. The preservation of the alluvial surfaces and the presence of roads and a town that were created prior to the formation of the lake (fig. 12) indicate that processes acting on the lake floor as lake level rose and since then have been insufficient to erase these features. One place where there is evidence of pre-impoundment deposits being reworked is along the western edge of Boulder Basin in an area where lake-floor elevations are above approximately 343 m. Here the alluvial deposits have a more uniform high-backscatter appearance that suggests a continuous smooth sheet of sand (fig. 13). This smooth sand sheet may reflect reworking and redistribution of the unconsolidated alluvial deposits by waves breaking on the beach during periods when lake level was lower. Prior to 1966, when the Glen Canyon Dam was completed, lake level fluctuated by 5 to 15 m annually (fig. 14), and this smoothed band of alluvial deposits may record reworking during these periods of shifting lake level. In summary, the interpretation based on the datasets included in this report shows the surficial geology of the lake floor as of 2001, when these data were collected. Alluvial deposits cover nearly 48 percent of the surveyed part of the lake, thin and thick post-impoundment sediments cover approximately 26 percent, and rocks are exposed on the remainder of the lake floor (fig. 5). In general, sediment that has accumulated in the lake since impoundment is distributed along the paths of the former Colorado River and its tributaries. Rock and alluvial deposits remain exposed on the lake floor surrounding these areas (fig. 2). Lake level has dropped from 370 m in 2000 to 339 m at the beginning of 2009 (fig. 14). One consequence of this 31-m drop in lake level over 9 years is erosion of the unconsolidated delta deposits and the redistribution of these sediments into deeper parts of the lake. The distribution of post-impoundment sediments on the lake floor is dynamic and closely tied to fluctuations in lake level, and while the amount of sediment transported to the deep parts of the lake may vary between periods of high and low lake level, sediment distribution limited to the valley floors will remain the same. |

![]() U.S. Department of the Interior |
U.S. Geological Survey
U.S. Department of the Interior |
U.S. Geological Survey
[an error occurred while processing this directive]
URL: https://pubsdata.usgs.gov
Page Contact Information: Contact USGS
Page Last Modified: Wednesday, 07-Dec-2016 22:18:33 EST