U.S. Geological Survey Open-File Report 2012-1178
Profile Measurements and Data From the 2011 Optics, Acoustics, and Stress In Situ (OASIS) Project at the Martha's Vineyard Coastal Observatory
| Click on figure for larger image |
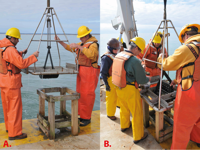 |
| Figure 5. Sediment sampling with van Veen grab. A, van Veen grab coming onboard after getting sediment sample. B, Subsampling and bagging surface sediments (top 2 centimeters) using small metal scoop. |
|
Narrative and Time LineA time line of activities during the experiment is included for each of the two USGS moorings (table 1). Highlights are summarized here.The tripod (USGS mooring 910) was assembled and tested on the Woods Hole Oceanographic Institution (WHOI) dock. Deployment was delayed a few days due to weather as Hurricane Maria passed offshore. On September 17, 2011, the tripod was deployed from the University of Connecticut research vessel (R/V) Connecticut and placed on the seafloor at the 12-meter (m) MVCO node. Divers connected the cable to the underwater node. The monopod (USGS mooring 911) was then deployed about 3 to 5 m southeast of the tripod. Divers reported that the flotation on the monopod ground line was excessive, suspending the anchor and ground-line chain and potentially destabilizing the monopod. Divers collected samples in water bottles and reported very poor visibility during most of the deployment dives. On September 21, divers replaced the 35.6-centimeter (cm; 14-inch)-diameter subsurface float on the monopod ground line with a 20-cm (8-inch)-diameter float and reoriented the ground line toward the north. Divers cleaned the optical and acoustical sensors on the profiling tripod on September 21, September 27, October 6, and October 11. Diver visibility was poor during the deployment on September 17, but was better on September 21 and even better on October 6, 11, and 12. Underwater video of the tripod was recorded on October 6 by Michael Casso. The minimum angle for the profiling arm, which determines the arm's lowest position, was initially set at -27.5 degrees (°). It was changed (by adjusting input parameters to the arm-control software) to -25° on October 6 and to -24° on October 11. Wave and current measurements indicate that remnants of Hurricane Maria were present during deployment and for a few days afterward, and bottom conditions were very turbid. Spring tides occurred September 27-30. Long-period swells from Hurricane Ophelia were observed October 2-4. The period of October 6-13 was extremely calm, with good diver visibility and low backscatter from both acoustic and optical sensors. Beginning on October 14, a series of fronts crossed the region, culminating in a gale with significant wave heights of 4 m that capsized the tripod. Sediment SamplesSamples of the seabed sediment (table 2) were collected for grain size analysis on September 17, September 21, and October 23. Sediment samples were collected either by scuba divers inserting small push cores into the sediment or with a van Veen grab (fig. 5). After collection, diver push cores were extruded from their core tubes and sampled at specific intervals (0-2 cm and 2-5 cm). The top 2 cm of van Veen grab samples were subsampled with a small metal scoop.Sediment grain-size analysis was performed by the USGS sediment lab in Woods Hole, Mass. Samples were wet-sieved to separate the coarse (sand sized) and fine (silt and clay) fractions. The grain size of the fine fraction was analyzed with a Coulter counter and the coarse fraction was analyzed by dry sieving. Water SamplesOne-liter water samples for analyses of suspended solids concentrations (SSC; table 3) were collected by scuba divers near the sensors on the end of the profiling arm on September 17, 21, and 27 and October 6, 11, and 23. Water samples were kept cool until they could be processed in the laboratory. Water samples were analyzed for SSC following USGS method I-3765-85 (Fishman and Friedman, 1989). The data from discrete SSC samples can be compared with optical transmission, optical backscatter, or acoustic backscatter data to derive a calibration that allows estimation of a time series of SSC from the optical and acoustic data.Mooring InformationMooring information is included in the mooring log (table 4), including USGS mooring identification (ID), serial number, elevation, and the names of the data files for each of the instruments. |


