U.S. Geological Survey Open-File Report 2012-1178
Profile Measurements and Data From the 2011 Optics, Acoustics, and Stress In Situ (OASIS) Project at the Martha's Vineyard Coastal Observatory
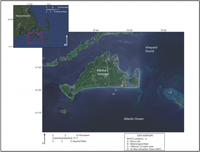
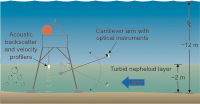
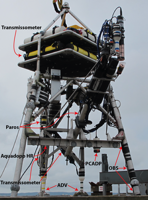
BackgroundThe data described here were obtained as part of the Optics, Acoustics, and Stress In Situ (OASIS) Project, a cooperative effort between the U.S. Navy Office of Naval Research (ONR) and the U.S. Geological Survey (USGS). Field data were collected in September and October 2011 near the Martha's Vineyard Coastal Observatory (MVCO; fig. 1) in collaboration with other OASIS investigators. ObjectivesThe goal of the project was to measure optical and acoustical characteristics of particles suspended near the seafloor under a variety of wave and current conditions. In particular, we wanted to measure vertical profiles of acoustic and optical backscatter and attenuation, along with estimates of particle size. Profiles of acoustic properties can be made with readily available instruments, but because light is attenuated in marine environments, profiles of optical properties are more difficult to measure. To obtain both optical and acoustic profiles, we designed and built a tripod-mounted profiler to move a package of optical and acoustic sensors up and down through the bottom 2 meters (m) of the water column (figs. 2 and 3). This report describes the profiler, associated instrumentation, field program, and resulting data. |