 |
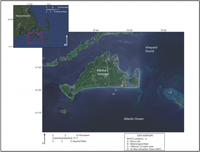
Figure 1.
Satellite photograph of Martha's Vineyard and Cape Cod (inset), Massachusetts. Study site is indicated by "C" and is 2 kilometers offshore, to the south of Martha's Vineyard. |
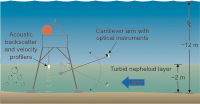 |
Figure 2.
Schematic illustration of profiling tripod with instruments on cantilever arm for profiling particle distributions in the bottom boundary layer. Refer to the Abbreviations and Symbols section. |
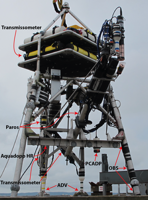 |
Figure 3.
Front view of the tripod with the profiling arm; frame-mounted instruments are labeled. Profiling arm is in the up position. See the Instrumentation section for a complete description of these instruments. |
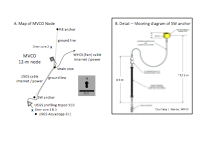 |
Figure 4.
Schematic diagrams showing A, location of node infrastructure and U.S. Geological Survey (USGS) moorings at the Martha's Vineyard Coastal Observatory (MVCO) 12-meter node, and B, detail of mooring diagram of southwest (SW) anchor and buoy at the MVCO, courtesy of Jay Sisson, Woods Hole Oceanographic Institute (WHOI). Refer to the Abbreviations and Symbols section. |
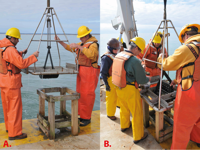 |
Figure 5.
Sediment sampling with van Veen grab. A, van Veen grab coming onboard after getting sediment sample. B, Subsampling and bagging surface sediments (top 2 centimeters) using small metal scoop. |
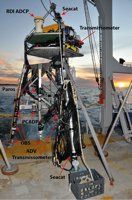 |
Figure 6.
Rear view of tripod with profiling arm; frame-mounted instruments are labelled. See the Instrumentation section for a complete description of these instruments. |
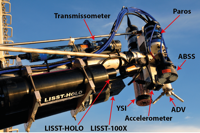 |
Figure 7.
Side view of profiling arm; instruments are labeled. See the Instrumentation section for a complete description of these instruments. |
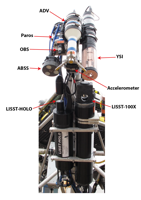 |
Figure 8.
Bottom view of profiling arm; instruments are labeled. See the Instrumentation section for a complete description of these instruments. |
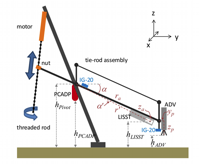 |
Figure 9.
Schematic diagram of the geometry and key components of a profiling arm. Refer to the Abbreviations and Symbols section. See the Instrumentation section for a complete description of these instruments. |
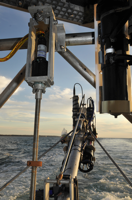 |
Figure 10.
Photograph of Technadyne rotary actuator, mount, and upper portion of drive screw. |
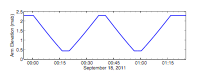 |
Figure 11.
Graph showing an example arm elevation time series for one profile cycle. Refer to the Abbreviations and Symbols section. |
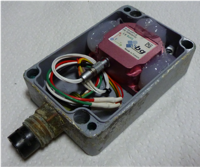 |
Figure 12.
Photograph of an SBG IG-20 two-axis inclinometer and three-axis accelerometer glued in the waterproof housing (lid removed). |
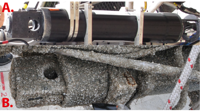 |
Figure 13.
Photograph of the Sequoia Scientific LISST-100X laser particle sizer on profiling arm A, before deployment and B, after recovery. |
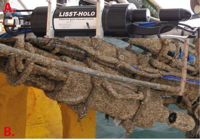 |
Figure 14.
Photograph of the Sequoia Scientific LISST-HOLO submersible digital holographic particle imaging system on profiling arm A, before deployment and B, after recovery. |
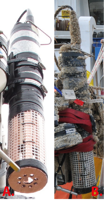 |
Figure 15.
Photograph of the YSI 6600 multiparameter sonde on profiling arm A, before deployment and B, after recovery. |
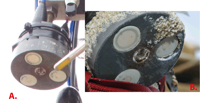 |
Figure 16.
Photograph of the Aquatec Aquascat acoustic backscatter system on profiling arm A, before deployment and B, after recovery. |
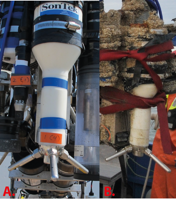 |
Figure 17.
Photograph of the SonTek ADV on profiling arm A, before deployment and B, after recovery. |
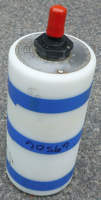 |
Figure 18.
Photograph of the Paroscientific, (Paros) Digiquartz pressure sensor. |
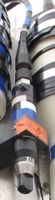 |
Figure 19.
Photograph of the D&A Instrument Company optical backscatter sensor (OBS) on the profiling arm before deployment. |
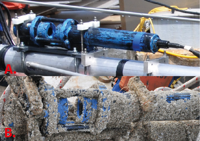 |
Figure 20.
Photograph of Seatech 5-centimeter transmissometer on the profiling arm A, before deployment and B, after recovery. |
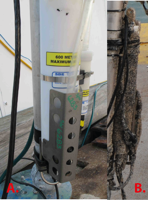 |
Figure 21.
Photograph of the Sea-Bird SEACAT mounted on a tripod leg 0.4 meters above the bottom A, before deployment and B, after recovery. |
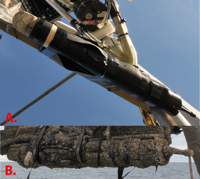 |
Figure 22.
Photograph of the Nortek Aquadopp HR velocity profiler mounted on the tripod crossbeam 1.08 meters above the bottom A, before deployment and B, after recovery. |
 |
Figure 23.
Photograph of the SonTek PCADP mounted on the tripod crossbeam 1.03 meters above the bottom A, before deployment and B, after recovery. |
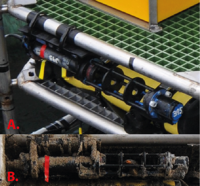 |
Figure 24.
Photograph of the Seatech 25-centimeter transmissometer logged with the red PCADP and mounted on the tripod frame 2.75 meters above the bottom A, before deployment and B, after recovery. |
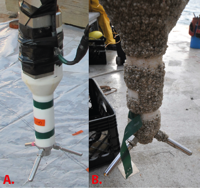 |
Figure 25.
Photograph of the SonTek ADV (9105) mounted on the tripod frame 0.42 meter above the bottom A, before deployment and B, after recovery. |
 |
Figure 26.
Photograph of the SonTek ADV (9106) mounted on the tripod frame 0.42 meter above the bottom A, before deployment and B, after recovery. |
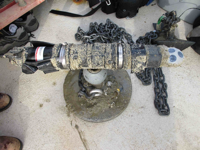 |
Figure 27.
Photograph of the Nortek Aquadopp (9111) profiler mounted on a monopod 0.16 meter above the bottom after recovery. |
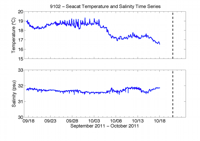 |
Figure 28.
Graphs showing time series of temperature and salinity from the Sea-Bird SEACAT mounted 3.16 meters above the bottom.
Dashed line marks time when tripod tipped over by strong waves and currents. Refer to the Abbreviations and Symbols section. |
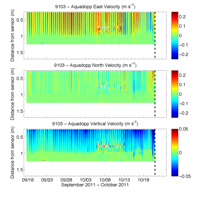 |
Figure 29.
Graphs showing time series profiles of east, north, and vertical velocity from a Nortek Aquadopp HR profiler mounted 1.08 meters above the bottom. Dashed line marks time when tripod was tipped over by strong waves and currents. Refer to the Abbreviations and Symbols section. |
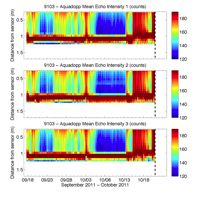 |
Figure 30.
Graphs showing echo intensity time series profiles for beams 1, 2, and 3 from a Nortek Aquadopp HR profiler mounted 1.08 meters above the bottom. Dashed line marks time when tripod was tipped over by strong waves and currents. Refer to the Abbreviations and Symbols section. |
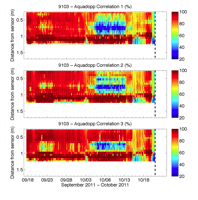 |
Figure 31.
Graphs showing correlation time series profiles for beams 1, 2, and 3 from the Nortek Aquadopp HR profiler mounted 1.08 meters above the bottom. Dashed line marks time when tripod was tipped over by strong waves and currents. Refer to the Abbreviations and Symbols section. |
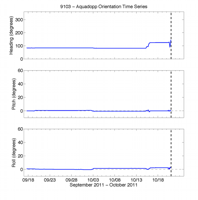 |
Figure 32.
Graphs showing time series for heading, pitch, and roll from the Nortek Aquadopp HR profiler mounted 1.08 meters above the bottom. Note: the compass data were incorrect. The data were processed using the heading from ADV 9105 plus 54.5 degrees. Dashed line marks time when tripod was tipped over by strong waves and currents. |
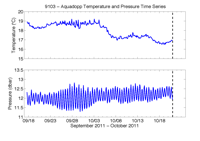 |
Figure 33.
Graphs showing time series for temperature and pressure from the Nortek Aquadopp HR profiler mounted 1.08 meters above the bottom. Dashed line marks time when tripod was tipped over by strong waves and currents. Refer to the Abbreviations and Symbols section. |
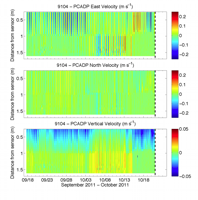 |
Figure 34.
Graphs showing time series profiles for east, north, and vertical velocity from the SonTek PCADP mounted 1.03 meters above the bottom. Dashed line marks time when tripod tipped over by strong waves and currents. Refer to the Abbreviations and Symbols section. |
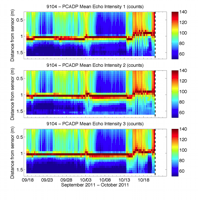 |
Figure 35.
Graphs showing echo intensity time series profiles for beams 1, 2, and 3 from the SonTek PCADP mounted 1.03 meters above the bottom. Dashed line marks time when tripod tipped over by strong waves and currents. Refer to the Abbreviations and Symbols section. |
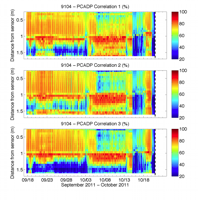 |
Figure 36.
Graphs showing correlation time series profiles for beams 1, 2, and 3 from a SonTek PCADP mounted 1.03 meters above the bottom. Dashed line marks time when tripod tipped over by strong waves and currents. Refer to the Abbreviations and Symbols section. |
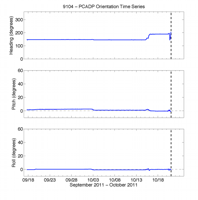 |
Figure 37.
Graphs showing time series of heading, pitch, and roll from a SonTek PCADP mounted 1.03 meters above the bottom. Dashed line marks time when tripod tipped over by strong waves and currents. |
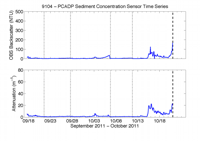 |
Figure 38.
Graphs showing time series of optical backscatter and transmissometer attenuation from OBS mounted 1.18 meters above the bottom and 25-centimeter transmissometer mounted 2.75 meters above the bottom. Dashed line marks time when tripod tipped over by strong waves and currents. Dotted lines mark times when optical sensors were cleaned by divers. Refer to the Abbreviations and Symbols section. |
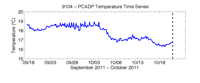 |
Figure 39.
Graph showing time series of temperature from the SonTek PCADP mounted 1.03 meters above the bottom. Dashed line marks time when tripod tipped over by strong waves and currents. Refer to the Abbreviations and Symbols section. |
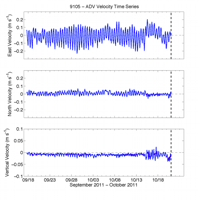 |
Figure 40.
Graphs showing times series of east, north, and vertical velocity from the green ADV mounted 0.42 meters above the bottom. Dashed line marks time when tripod tipped over by strong waves and currents. Refer to the Abbreviations and Symbols section. |
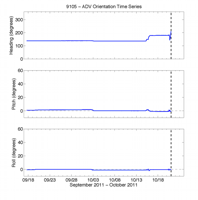 |
Figure 41.
Graphs showing time series of heading, pitch, and roll from and the green ADV mounted 0.42 meters above the bottom. Dashed line marks time when tripod tipped over by strong waves and currents. |
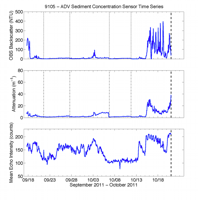 |
Figure 42.
Graphs showing time series of optical backscatter, transmissometer attenuation, and ADV mean echo intensity from the OBS mounted 0.23 meters above the bottom of the array, the 5-centimeter transmissometer mounted 1.20 meters above the bottom, and the ADV sample volume 0.24 meters above the bottom. Dashed line marks time when tripod tipped over by strong waves and currents. Dotted lines mark times when optical sensors were cleaned by divers. Refer to the Abbreviations and Symbols section. |
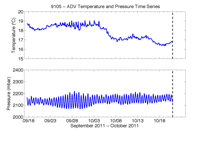 |
Figure 43.
Graphs showing time series of temperature and pressure. Temperature data are from the green ADV mounted 0.42 meters above the bottom and pressure data are from the Paros pressure sensor mounted 1.53 meters above the bottom. Dashed line marks time when tripod tipped over by strong waves and currents. Refer to the Abbreviations and Symbols section. |
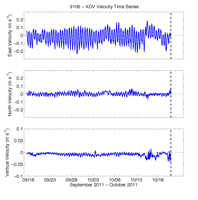 |
Figure 44.
Graphs showing time series profiles of east, north, and vertical velocity from the yellow ADV mounted 0.42 meters above the bottom. Dashed line marks time when tripod tipped over by strong waves and currents. Refer to the Abbreviations and Symbols section. |
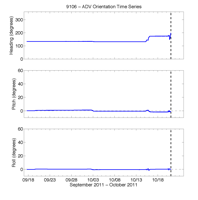 |
Figure 45.
Graphs showing time series of heading, pitch, and roll from yellow ADV mounted 0.42 meters above the bottom. Dashed line marks time when tripod tipped over by strong waves and currents. |
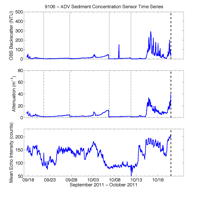 |
Figure 46.
Graphs showing time series of optical backscatter, transmissometer attenuation, and ADV mean echo intensity from the OBS mounted 0.61 meters above the bottom, the 5-centimeter transmissometer mounted 1.19 meters above the bottom, and the ADV sample volume 0.24 meters above the bottom. Dashed line marks time when tripod tipped over by strong waves and currents. Dotted lines mark times when optical sensors were cleaned by divers. Refer to the Abbreviations and Symbols section. |
 |
Figure 47.
Graphs showing time series of temperature and pressure . Temperature data are from the yellow ADV mounted 0.42 meters above the bottom and pressure data are from the Paros pressure sensor mounted 1.53 meters above the bottom. Dashed line marks time when tripod tipped over by strong waves and currents. Refer to the Abbreviations and Symbols section. |
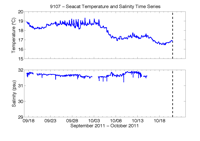 |
Figure 48.
Graphs showing time series of temperature and salinity from a Sea-Bird SEACAT mounted 0.4 meters above the bottom. Dashed line marks time when tripod tipped over by strong waves and currents. Refer to the Abbreviations and Symbols section. |
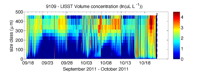 |
Figure 49.
Graph showing time series of volume concentration for 32 size classes from the LISST-100X mounted on profiling arm. Dashed line marks time when tripod tipped over by strong waves and currents. Dotted lines mark times when optical sensors were cleaned by divers. Refer to the Abbreviations and Symbols section. |
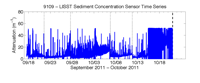 |
Figure 50.
Graph showing time series of attenuation from the LISST-100X mounted on profiling arm. Dashed line marks time when tripod tipped over by strong waves and currents. Dotted lines mark times when optical sensors were cleaned by divers. Refer to the Abbreviations and Symbols section. |
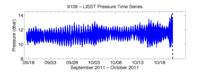 |
Figure 51.
Graph showing time series of pressure from LISST-100X mounted on profiling arm. Dashed line marks time when tripod tipped over by strong waves and currents. Refer to the Abbreviations and Symbols section. |
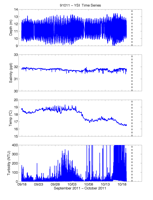 |
Figure 52.
Graphs showing time series of depth, salinity, temperature, and turbidity from the YSI multiparameter sonde mounted on profiling arm. Dashed line marks time when tripod tipped over by strong waves and currents. Refer to the Abbreviations and Symbols section. |
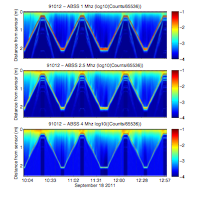 |
Figure 53.
Graphs showing example backscatter profile times series from an acoustic backscatter sensor (ABSS) mounted on profiling arm. Refer to the Abbreviations and Symbols section. |
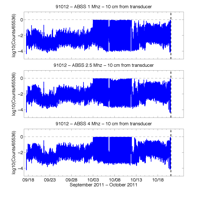 |
Figure 54.
Graphs showing time series of acoustic backscatter 10-centimeters from transducers of the acoustic backscatter sensor (ABSS) mounted on profiling arm. Units plotted on the y-axis are the logarithm of the ABSS response measured in analog-digital converter counts, normalized by the maximum number of counts. Dashed line marks time when tripod tipped over by strong waves and currents. Refer to the Abbreviations and Symbols section. |
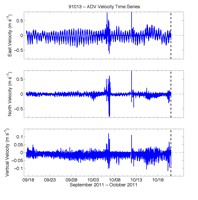 |
Figure 55.
Graphs showing time series of 1-minute median east, north, and vertical velocity from the blue ADV mounted on profiling arm. Dashed line marks time when tripod tipped over by strong waves and currents. Refer to the Abbreviations and Symbols section. |
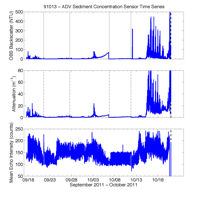 |
Figure 56.
Graphs showing time series of 1-minute median optical backscatter, transmissometer attenuation, and ADV mean echo intensity from the OBS, 5-centimeter transmissometer, and ADV mounted on profiling arm. Dashed line marks time when tripod tipped over by strong waves and currents. Dotted lines mark times when optical sensors were cleaned by divers. Refer to the Abbreviations and Symbols section. |
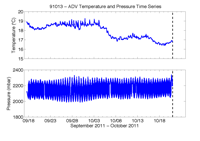 |
Figure 57.
Graphs showing time series of 1-minute median temperature and pressure. Temperature data are from the blue ADV and pressure data are from a Paros pressure sensor; both devices were mounted on profiling arm. Dashed line marks time when tripod tipped over by strong waves and currents. Refer to the Abbreviations and Symbols section. |
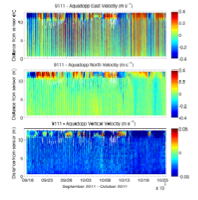 |
Figure 58.
Graphs showing time series profiles of east, north, and vertical velocity from a Nortek Aquadopp profiler mounted on a monopod 0.16 meter above the bottom. Refer to the Abbreviations and Symbols section. |
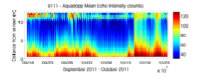 |
Figure 59.
Graph showing time series profiles of average echo intensity from a Nortek Aquadopp profiler mounted on a monopod 0.16 meters above the bottom. Refer to the Abbreviations and Symbols section. |
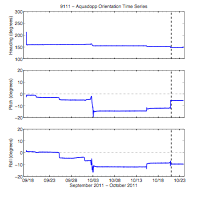 |
Figure 60.
Graphs showing time series of heading, pitch, and roll from a Nortek Aquadopp profiler mounted on a monopod 0.16 meters above the bottom. |
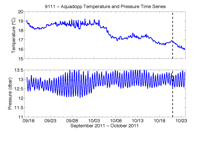 |
Figure 61.
Graphs showing time series of temperature and pressure from a Nortek Aquadopp profiler mounted on a monopod 0.16 meters above the bottom. Refer to the Abbreviations and Symbols section. |


