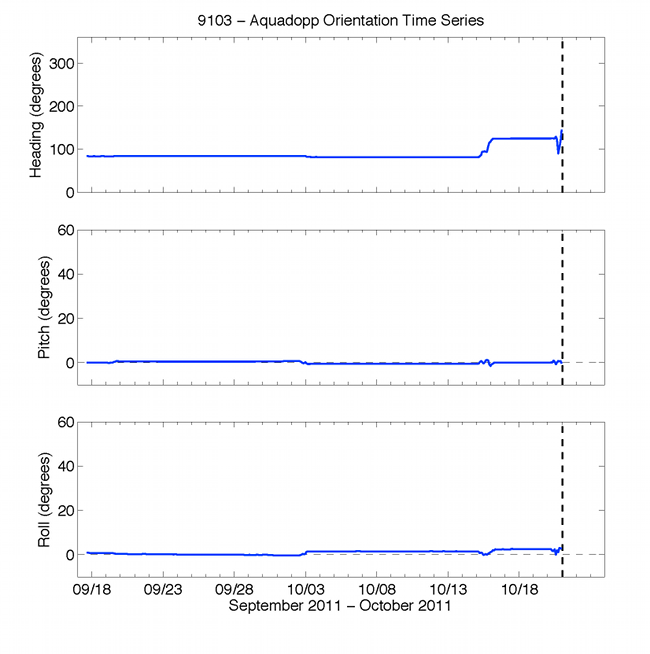
Figure 32. Graphs showing time series for heading, pitch, and roll from the Nortek Aquadopp HR profiler mounted 1.08 meters above the bottom. Note: the compass data were incorrect. The data were processed using the heading from ADV 9105 plus 54.5 degrees. Dashed line marks time when tripod was tipped over by strong waves and currents.