U.S. Geological Survey Open-File Report 2012-1178
Profile Measurements and Data From the 2011 Optics, Acoustics, and Stress In Situ (OASIS) Project at the Martha's Vineyard Coastal Observatory
/ Title Page / Acknowledgments / List of Figures / Conversion Factors / Abbreviations and Symbols / Abstract / Introduction / Site Description / Field Program / Time Line Table / Bottom Sediment Sample Table / Suspended Sediment Sample Table / Mooring Log Table / Instrumentation / Results / Digital Data File Table / References / Appendix 1 / Appendix 2 / Appendix 3 / Appendix 4 /
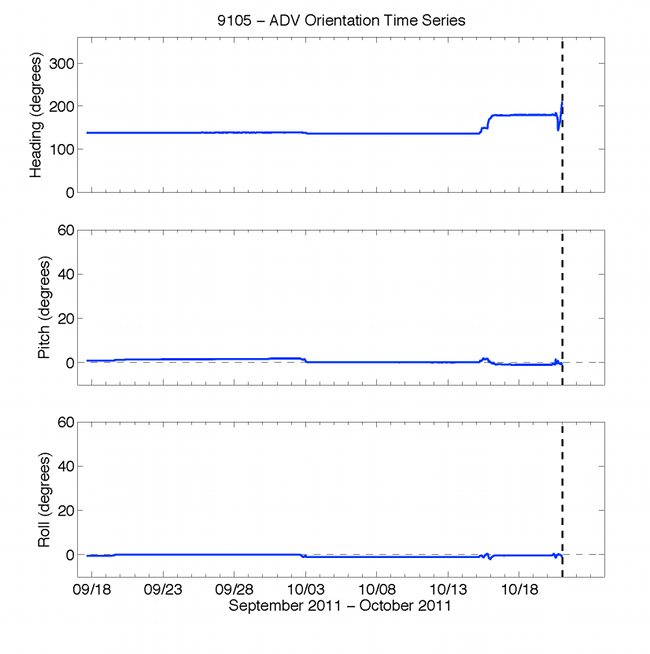
Figure 41. Graphs showing time series of heading, pitch, and roll from and the green ADV mounted 0.42 meter above the bottom. Dashed line marks time when tripod tipped over by strong waves and currents.
Download the full size image in PDF format.
To view files in PDF format, download a free copy of Adobe Reader.